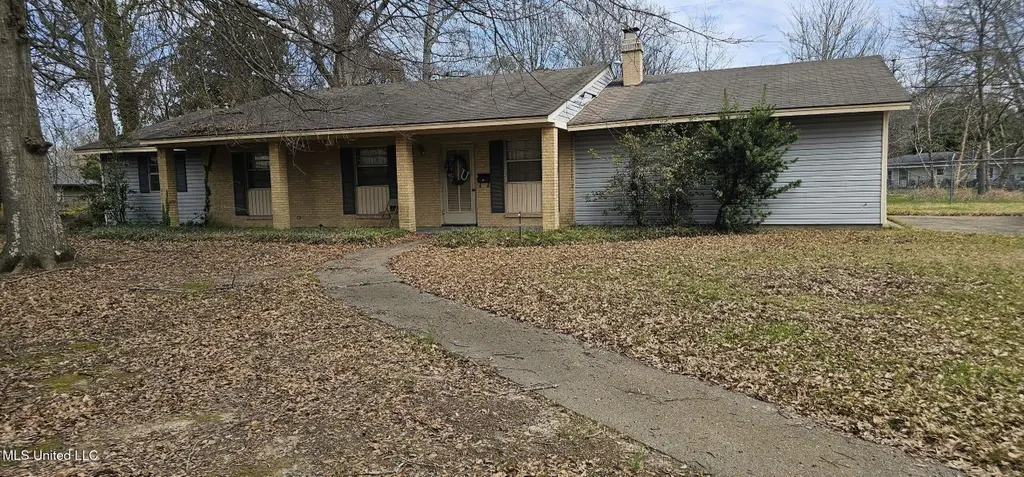
2832 Gretna Green St · Jackson, MS
Flood risk 6/10 · Moderate
- FEMA flood zone
- AE
- Chance of flooding over 30 yrs
- 0.7%
- Est. flood insurance / yr
- $1,737 – $8,500
Fire risk 1/10 · Minimal
- Est. fire insurance / yr
- $1,241 – $2,305
Heat risk 7/10 · Major
- Hot days now (above 108°F)
- 7 days/yr
- Hot days in 30 yrs
- 19 days/yr
Wind risk 8/10 · Major
- Chance of severe wind over 30 yrs
- 80.0%
Air-quality risk 1/10 · Minimal
- Unhealthy air days now
- 0 days/yr
- Unhealthy air days in 30 yrs
- 0 days/yr
Risk factors via First Street. Map © Google.
Why this score? — see what drove the B+ grade
The composite is a weighted blend of 9 inputs, each scored 0–100. Each bar is that input's sub-score; the figure is the points it added to the 100-point composite (weight × sub-score).
- Cash flow +30.0/30.0
- 1% rule +10.0/10.0
- DSCR +10.0/10.0
- Appreciation +10.0/10.0
- ARV discount +9.5/15.0
- Livability +3.4/5.0
- Rent growth +2.5/5.0
- Condition / age +2.5/5.0
- Schools +1.1/10.0
$55,000
🖨 Deal sheet 📄 Offer letter ✓ Due diligence
Listing remarks MLS
This is a great property, fixer upper perfect for the handyman or investor that looking to produce a steady income. Less than a mile from Jackson State, grocery store across the street. This is a solid investment or home for the right person.
Key facts
- 0.43 acre lot
- 2 garage spots
- Built 1961
Neighborhood map
What this means for you Summary
Snapshot
- This is a 3-bed/2.0-bath single-family listed at $55k.
Deal economics
- At list price, monthly cash flow is $168 ($2k/yr) — positive.
- The deal already cash-flows at list — no discount required.
- Meets the 1% rule at list price ($1k rent vs $55k).
- Recommended offer: $48k (12.0% below list) — sets the bar for market timing.
- Cap rate 19.3% vs local median 9.9% in Jackson — top-decile yield for the area; either an underpriced asset or a hidden risk that comps aren't pricing in. Stress-test before assuming the spread holds.
Location & tenants
- Location reads 68/100 on livability (#66 in MS) — a middle-class / working-renter tenant base. Strengths: commute A+, cost of living A+, housing A+; Watch: schools F, amenities F, employment F.
- Jackson Public School District (urban): math 9% / reading 18% proficiency, ranked #112 of 130 in MS (top 86%) — low school quality limits family demand, transient renter base, plan for 1-2y turnover; 88% free/reduced lunch — lower-income household profile, screen leases tightly.
- Market conditions: 165 active listings in the ZIP; 8 comparable units currently listed for rent nearby; rentals at typical pace (median 23d on market — plan ~3-4 weeks tenant-placement turnaround); lower-income renter base — watch delinquency; 167 units permitted in Hinds County in 2024 (0 in 5+ unit buildings).
- This rent runs 44% of the median local income ($36k/yr) — at the standard rent-burdened threshold; future hikes will face affordability resistance.
Forward outlook
- In year one you build about $6k of equity ($380 loan paydown + $6k appreciation (10.0% local appreciation)).
- Hinds County population projected to shrink 6% by 2050 — rents likely to lag national; underwrite the cash flow, not the appreciation.
- At projected returns (10.0% appreciation + 3.0% rent growth), your $15k cash investment doubles in ~2 years — after that, you're playing with house money.
- By year 6, paydown + projected appreciation supports a ~$35k cash-out refi (75% LTV) — recoverable capital for the next deal without selling this one.
Negotiation context
- It's been on market 212 days — a 12% lower offer ($48k) is reasonable based on typical stale-listing flexibility.
- 2 sale attempts; this cycle's ask has dropped $16k (23%) from the opening price — seller is motivated, your offer sets the floor, not the list.
Risks & watch-outs
- Watch-outs: property tax is 3.1% of price; flood insurance adds $427/mo.
- Climate carrying-cost: in FEMA flood zone AE (mandatory federal flood insurance); severe wind risk, 80% chance of damaging wind over 30y; extreme-heat days projected 7→19/yr by 2055 (HVAC capex compounding) — expect insurance premiums to compound above CPI over the hold.
Questions for the listing agent
- It's been on market 212 days. Have you received any prior offers? Is the seller open to a 12% concession, seller financing, or rate buy-down credit?
- Built in 1961 — when were the roof, HVAC, electrical panel, plumbing, and water heater last replaced?
- Property tax is high relative to price — has the assessment been appealed recently, and will the sale trigger a re-assessment?
- What's the actual annual flood-insurance premium (NFIP or private), and is the property in a SFHA with mandatory coverage?
- Why hasn't it sold? Are there any deal-killer items the seller is aware of (foundation, flood, title, zoning, code violations)?
- Is there a deadline driving the sale (1031 exchange, divorce, estate, relocation)? That informs how much negotiation room exists.
- Schools are F-rated, which usually means shorter tenancies and higher turnover. Who's the typical renter profile here, and what's been the actual vacancy rate?
- What's the average days-on-market for RENTAL listings here right now (not sales)? A rising rental-DOM trend means longer vacancies and softer asking-rent achievability than the comps imply.
- What's the recent tenant-quality profile in this submarket — average credit score on applications, eviction rate, late-payment / NSF rate, and stable-employment percentage? A property-management company in the area should have these aggregated.
- How much new for-sale + rental construction is in the pipeline within 1–3 miles? Heavy new supply typically softens prices + rents 12–24 months out; constrained supply supports both.
Investment metrics
- 1% rule
- 2.42% ✓
- Cap rate
- 19.27%
- Cash-on-cash
- 46.33%
- DSCR
- 3.06
- GRM
- 3.4
CMA / ARV
- ARV (median comp)
- $57,543
- List price
- $55,000
- Delta
- -4.42%
- Verdict
- FAIR
- Comps
- 20 within 1.0 mi
Show comp detail 12 sales within ~0.75 mi
| Address | Dist | Beds/Ba | Sqft | Sold | Price | $/sf | Match |
|---|---|---|---|---|---|---|---|
| 1053 Ellis Ave | 0.20mi | 3/2.0 | 1,488 (-5%) | 13mo | $53,000 | $36 | 71 |
| 2920 Robinson Rd | 0.31mi | 3/2.0 | 1,388 (-12%) | 12mo | $90,000 | $65 | 56 |
| 962 West Ridge Dr | 0.53mi | 3/2.0 | 1,572 (+0%) | 23mo | $80,000 | $51 | 56 |
| 3288 Burch St | 0.43mi | 3/1.0 | 1,374 (-12%) | 5mo | $25,000 | $18 | 51 |
| 3328 Santa Rosa St | 0.54mi | 3/2.0 | 1,700 (+8%) | 13mo | $85,000 | $50 | 50 |
| 2910 Robinson | 0.30mi | 4/2.0 (+1) | 1,743 (+11%) | 16mo | $104,999 | $60 | 49 |
| 3327 Casa Grande Cir | 0.58mi | 3/1.5 | 1,384 (-12%) | 6mo | $68,080 | $49 | 46 |
| 3248 Mable St | 0.44mi | 4/2.0 (+1) | 1,453 (-8%) | 21mo | $35,000 | $24 | 45 |
| 729 Primos Ave | 0.57mi | 3/2.0 | 1,423 (-9%) | 16mo | $39,900 | $28 | 45 |
| 1058 Alta Vista Blvd | 0.74mi | 3/1.5 | 1,405 (-10%) | 4mo | $50,000 | $36 | 43 |
| 957 Alta Vista Blvd | 0.69mi | 3/2.5 | 1,472 (-6%) | 17mo | $30,450 | $21 | 41 |
| 639 Brandon Ave | 0.75mi | 3/1.0 | 1,391 (-11%) | 23mo | $5,000 | $4 | 23 |
Match score weights: distance 35% · size 25% · config 20% · recency 20%. Top-matched comps best support the ARV.
Projected returns pro-forma
10.0% appreciation · 3.0% rent growth · sell at horizon
- IRR
- 34.1%
- Equity multiple
- 3.66×
- Total profit
- $40,988
- Equity at exit
- $49,548
- IRR
- 29.6%
- Equity multiple
- 8.33×
- Total profit
- $112,938
- Equity at exit
- $106,853
Cash invested: $15,400 (down + closing). Projections, not guarantees.
Landlord ↔ Tenant lean methodology
- Overall (STATE)
- 90 Strongly Landlord-Friendly
- State Mississippi
- 90 Strongly Landlord-Friendly · R+11
- County
- — inherits STATE
- City
- — inherits STATE
ZIP-level market 39209
- Home prices YoY
- 7.7%
- Active inventory
- 165
- Price-to-rent
- 3.4×
Monthly cashflow live
- Estimated rent
- $1,329 high interval (Pro) →
- Mortgage (P&I)
- −$288
- Tax from tax record
- −$144 /mo · $1,726/yr
- Insurance
- −$23
- Flood insurance flood zone
- −$427 /mo · $5,118/yr
- HOA
- −$0
- Vacancy / Maint / Mgmt
- −$279
- Net cashflow
- $168
Break-even live
UW: 25.0% down · 7.5% · 30yr · 1.5% tax · 5.0% vac · 8.0% maint · 8.0% mgmt
Financing live
Cash to close
- Down payment
- $13,750
- Closing costs
- $1,650
- Reserves months
- —
- Total cash needed
- —
Loan-product check · same deal, 3 products live
Conventional
25% down · 7.5% · 30yr
- Down + closing
- —
- Monthly P&I
- —
- Monthly cashflow
- —
- DSCR
- —
- Eligible?
- —
Personal DTI + credit; lowest rate.
DSCR
20% down · 8.5% · 30yr
- Down + closing
- —
- Monthly P&I
- —
- Monthly cashflow
- —
- DSCR
- —
- Eligible?
- —
No personal income docs; deal must DSCR.
Hard money
10% down · 12.0% · 12mo
- Down + closing
- —
- Monthly P&I
- —
- Monthly cashflow
- —
- DSCR
- —
- Eligible?
- —
Short-term bridge; refi at stabilization.
Rent comps 8 comps
| Address | Beds | Baths | Sqft | Rent | $/sqft | DOM | Units | Dist |
|---|---|---|---|---|---|---|---|---|
| 1645 Camellia Ln Jackson, MS | 3.0 | 2.0 | 1268 | $1,200 | $0.95 | 13d | 1 | 1.06mi |
| 309 S Denver St Jackson, MS | 4.0 | 3.5 | 1500 | $2,500 | $1.67 | 43d | 1 | 1.16mi |
| 3856 Noble St Jackson, MS | 3.0 | 2.0 | 1357 | $1,231 | $0.91 | 23d | 1 | 1.31mi |
| 3856 Noble St Jackson, MS | 3.0 | 2.0 | 1357 | $1,231 | $0.91 | 43d | 1 | 1.31mi |
| 1848 Willaneel Dr Jackson, MS | 4.0 | 2.0 | 1623 | $1,100 | $0.68 | 13d | 1 | 1.44mi |
| 137 Sivley Ave Jackson, MS | 3.0 | 1.0 | 1288 | $1,000 | $0.78 | 21d | 1 | 1.45mi |
| 264 Sewanee Dr Jackson, MS | 3.0 | 1.0 | 1217 | $995 | $0.82 | 23d | 1 | 1.46mi |
| 4539 Ritchey Dr Jackson, MS | 3.0 | 2.0 | 1144 | $1,250 | $1.09 | 43d | 1 | 1.49mi |
Listing history 11 events
-
2026-05-30statusdays on market $55,000 Pending 212 DOM
-
2026-03-17price $60,000 244-char remark
Show marketing remark (244 chars)
This is a great property, fixer upper perfect for the handyman or investor that looking to produce a steady income. Less than a mile from Jackson State, grocery store across the street. This is a solid investment or home for the right person.
-
2026-03-11price $61,500 244-char remark
Show marketing remark (244 chars)
This is a great property, fixer upper perfect for the handyman or investor that looking to produce a steady income. Less than a mile from Jackson State, grocery store across the street. This is a solid investment or home for the right person.
-
2026-03-02price $63,000 244-char remark
Show marketing remark (244 chars)
This is a great property, fixer upper perfect for the handyman or investor that looking to produce a steady income. Less than a mile from Jackson State, grocery store across the street. This is a solid investment or home for the right person.
-
2026-03-02status Active 244-char remark
Show marketing remark (244 chars)
This is a great property, fixer upper perfect for the handyman or investor that looking to produce a steady income. Less than a mile from Jackson State, grocery store across the street. This is a solid investment or home for the right person.
-
2026-02-28historical 244-char remark
Show marketing remark (244 chars)
This is a great property, fixer upper perfect for the handyman or investor that looking to produce a steady income. Less than a mile from Jackson State, grocery store across the street. This is a solid investment or home for the right person.
-
2026-01-14price $65,000 244-char remark
Show marketing remark (244 chars)
This is a great property, fixer upper perfect for the handyman or investor that looking to produce a steady income. Less than a mile from Jackson State, grocery store across the street. This is a solid investment or home for the right person.
-
2025-10-28$71,000 Active 244-char remark
Show marketing remark (244 chars)
This is a great property, fixer upper perfect for the handyman or investor that looking to produce a steady income. Less than a mile from Jackson State, grocery store across the street. This is a solid investment or home for the right person.
-
2024-06-06soldstatus
-
2024-06-06soldstatus
-
1978-11-17soldstatus
ⓘ Source: listings_history table (triggers on properties + properties_extension) + one-shot
backfill from property_details.listing_events for pre-trigger history.
Tax reassessment forecast MS · Resets to sale price
- Current annual tax
- $1,726 · $144/mo
- Projected year-2 tax
- $1,726 · $144/mo
- Expected delta
- $0/yr ($0/mo · 0.0%)
ⓘ Screening estimate from a state-policy table — verify with the county assessor before closing.
Climate risk First Street
- Flood 6/10 Major FEMA zone AE · 70% chance over 30 yrs
- Wildfire 1/10 Low
- Heat 7/10 Severe 7 d/yr ≥108°F today · 19 d/yr by 30 yrs out
- Wind 8/10 Severe 80% chance of damaging wind over 30 yrs
- Air quality 1/10 Low 0 unhealthy d/yr today · 0 by 30 yrs out
Nearby sold comps map
Loading sold comps map…
Walkable amenities ~0.75 mi
Loading nearby amenities…
Taxation est. · year 1
- Rental income
- $15,947
- − Mortgage interest
- −$3,081
- − Property taxes
- −$1,726
- − Insurance
- −$5,394
- − Repairs & maintenance
- −$1,276
- − Management
- −$1,276
- − Depreciation
- −$1,600
- Taxable income
- $1,595
- Est. tax owed @ 24.0%
- −$383
- After-tax cash flow
- $1,634/yr
For passive investors: Depreciation is non-cash, so a rental often shows a tax loss while cash-flowing — sheltering income. Rental losses are passive: they offset passive income freely, and up to $25,000/yr can offset ordinary (W-2) income if you actively participate and your MAGI is under $100k (phasing out to $0 by $150k); unused losses carry forward. On sale, claimed depreciation is recaptured at up to 25%, and gains may owe capital-gains tax (a 1031 exchange can defer both). Figures are a year-1 estimate at your 24.0% rate — not tax advice; consult a CPA.
Schools (NCES district)
- District
- Jackson Public School District
- NCES district ID
- 2802190
- Math proficiency
- 9% ▼ -14.00%
- Reading proficiency
- 18% ▼ -7.00%
- Median HH income
- $33,234
- Composite
- 10.89/100
- National rank
- #9755
- State rank
- #112 of 130 in MS
Livability — Jackson
- Score
- 68/100
- State rank
- #66
- US rank
- #9695
Category grades
Schools grade is shown separately in the Schools card above.
Census & demographics
- Census place
- Jackson, MS
- County
- Hinds County · 167,040 people
- City population
- 140,204
- Metro
- Jackson, MS
- Population (ZIP)
- 25,776
- Household income
- $36,344
- Rent vs Own
- Severe rent burden
- 1627.0
Population outlook (Hinds County) Hauer SSP2
- Today (2025)
- 242,528 people
- By 2030
- 241,113 · -0.6%
- By 2040
- 235,557 · -2.9%
- By 2050
- 226,946 · -6.4%
- By 2075
- 199,995 · -17.5%
- By 2100
- 164,165 · -32.3%
Race, ethnicity, and origin ACS 2023
- Neighborhood character
- Predominantly Black (90%)
- Race & ethnicity
- Black 90% White 7% Two or more races 2% Hispanic / Latino 1%
- Foreign-born
- 1% · Canada
- Languages at home
- 98% English-only · Spanish 2%
Political lean MEDSL · Hinds
- 2024 margin
- Solid D (+46.1) · D 72.4% · R 26.3% · Other 1.4%
- 2008→2024 swing
- +7.1pp toward D · 2008: 39.0pp · 2024: 46.1pp
- All cycles
- 2024: D+46.1 2020: D+48.3 2016: D+43.7 2012: D+45.1 2008: D+39.0
Not yet ingested
- Civics
- —
Market trends
- HPI YoY
- ▲ 22.28%
- Current HPI
- 312.6754
- Rent YoY
- —
- Metro
- Jackson, MS
- State GDP YoY
- —
- F500 in state
- 0
Price history
-15.5% since first listed10 events — show timeline
- 2026-03-17 Price Changed $60,000 MLSU
- 2026-03-11 Price Changed $61,500 MLSU
- 2026-03-02 Price Changed $63,000 MLSU
- 2026-03-02 Relisted — MLSU
- 2026-02-28 Listing Removed — MLSU
- 2026-01-14 Price Changed $65,000 MLSU
- 2025-10-28 Listed $71,000 MLSU
- 2024-06-06 Sold (Public Records) — Public Records
- 2024-06-06 Sold (Public Records) — Public Records
- 1978-11-17 Sold (Public Records) — Public Records
Property tax history
+1.9%/yrLatest (2025): $1,726 · +3.3% YoY. Source: county tax records.
Cash-flow waterfall
monthlySold comps — $/sqft
last 12 mo · ≤1 miLoading sold comps…