 Multi-family
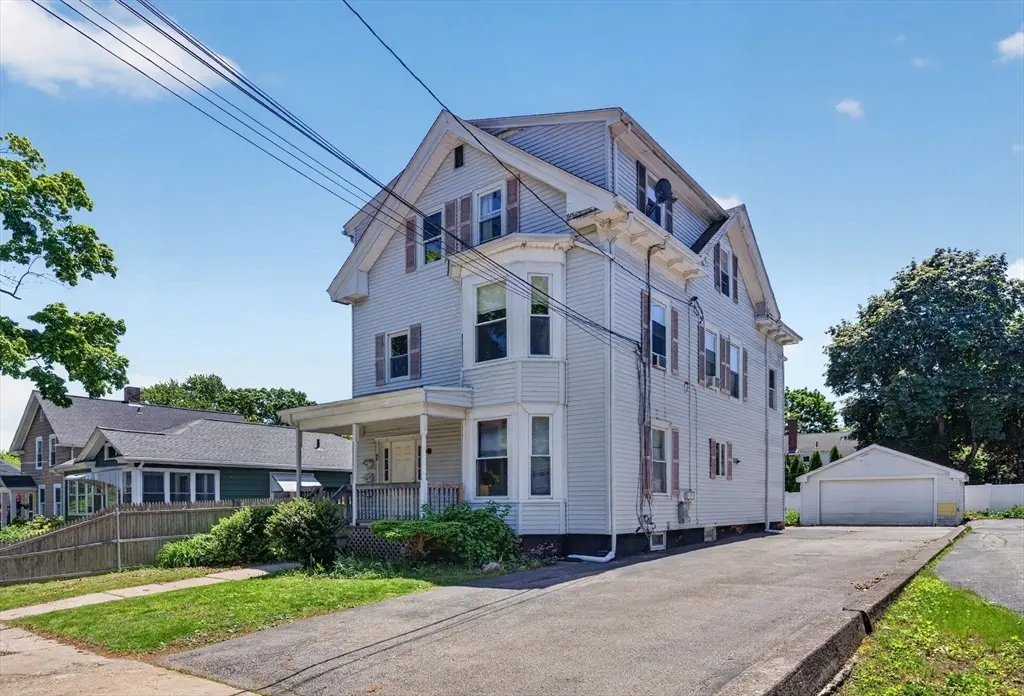
62 Ash St · North Attleborough Town, MA
Flood risk 1/10 · Minimal
- FEMA flood zone
- X (unshaded)
- Chance of flooding over 30 yrs
- 0.0%
- Est. flood insurance / yr
- $473 – $860
Fire risk 1/10 · Minimal
- Est. fire insurance / yr
- $915 – $1,699
Heat risk 5/10 · Moderate
- Hot days now (above 97°F)
- 7 days/yr
- Hot days in 30 yrs
- 15 days/yr
Wind risk 6/10 · Moderate
- Chance of severe wind over 30 yrs
- 64.0%
Air-quality risk 2/10 · Minimal
- Unhealthy air days now
- 1 days/yr
- Unhealthy air days in 30 yrs
- 2 days/yr
Risk factors via First Street. Map © Google.
Why this score? — see what drove the C grade
The composite is a weighted blend of 9 inputs, each scored 0–100. Each bar is that input's sub-score; the figure is the points it added to the 100-point composite (weight × sub-score).
- Cash flow +22.5/30.0
- ARV discount +10.2/15.0
- DSCR +7.2/10.0
- 1% rule +5.4/10.0
- Schools +4.8/10.0
- Rent growth +3.2/5.0
- Livability +2.5/5.0
- Condition / age +2.5/5.0
- Appreciation +0.0/10.0
$679,900
🖨 Deal sheet (PDF) 📄 Offer letter ✓ Due diligence
Multi-family units
County records classify this as Multi-Family (2-4 Unit). Listing-text estimate: 1 unit. estimate disagrees with records
Listing remarks MLS
North Attleboro 3 family property in desirable location of town on town water/sewer with in walking distance to downtown and schools. Property has 14 rooms, 8 bedrooms, 3 baths and 1.5 car garage with maintenance free siding, new roof in November 2018, windows are mostly replacement and coin operated washer/ dryer in basement included. Fully rented at $5,050 per month, all units have letter of full de-leading compliance.
Key facts
- Lead-certified
- Natural light
- Off-street parking
Tags
Property features AI
Finance
- Financial info: Listing is active
- HOA & community: Not a senior community
Exterior
- Parking: Two-car garage; Two covered parking spaces; Four open parking spaces; Six total parking spaces
- Utilities: Public water; Public sewer
- Home design: 3-family property; Three stories total
- Construction: Built (year per public records); Granite foundation; Lead paint certified treated
- Exterior features: Paved driveway; Lot approximately 0.14 acres
Interior
- Bathrooms: Three full bathrooms
- Interior features: Total of 14 rooms; Three separate units in the building
Neighborhood map
What this means for you Summary
Snapshot
- This is a 8-bed/3.0-bath multifamily listed at $680k.
Deal economics
- At list price, monthly cash flow is $1k ($14k/yr) — positive.
- The deal already cash-flows at list — no discount required.
- Meets the 1% rule at list price ($7k rent vs $680k).
- Cap rate 8.3% vs local median 2.8% in North Attleborough Town — top-decile yield for the area; either an underpriced asset or a hidden risk that comps aren't pricing in. Stress-test before assuming the spread holds.
Location & tenants
- Location reads: area grade C — affects rentability + tenant quality, not the cash-flow math above.
- North Attleborough (suburban): math 46% / reading 60% proficiency, ranked #98 of 302 in MA (top 32%) — acceptable for families but not a draw, mixed tenant base, ~2y average lease; only 15% free/reduced lunch — higher-income household profile.
- Market conditions: Rents rising (+2.9%/yr); 37 active listings in the ZIP; high-income renter base; 760 units permitted in Bristol County in 2024 (142 in 5+ unit buildings).
- At $7,061/mo this rent would consume 76% of the median local household income ($112k/yr) (locally 681% of renters already pay >50% of income on rent) — very limited rent-growth headroom before tenants either downsize or default.
Forward outlook
- Local home prices are declining (-3.0%/yr); year-one equity from $5k of loan paydown is wiped out by about $20k of value loss. Plan a longer hold.
- Bristol County population projected to shrink 3% by 2050 — rents likely to lag national; underwrite the cash flow, not the appreciation.
Negotiation context
- Only 10 days on market — expect competitive offers; lowballing is unlikely to land.
- 7 sale attempts since 27y ago with the ask held roughly flat each time — persistent listings suggest the price (not the market) is what's stuck; bring a comps-based counter.
- Current owner paid $575k; 18% above their basis — modest negotiation headroom, anchor on the comps not their cost.
Risks & watch-outs
- Watch-outs: built in 1920 — expect roof / HVAC / electrical / plumbing capex.
- Climate carrying-cost: major wind risk, 64% chance of damaging wind over 30y; extreme-heat days projected 7→15/yr by 2055 (HVAC capex compounding) — expect insurance premiums to compound above CPI over the hold.
Questions for the listing agent
- Built in 1920 — when were the roof, HVAC, electrical panel, plumbing, and water heater last replaced?
- Is there a deadline driving the sale (1031 exchange, divorce, estate, relocation)? That informs how much negotiation room exists.
- What's the average days-on-market for RENTAL listings here right now (not sales)? A rising rental-DOM trend means longer vacancies and softer asking-rent achievability than the comps imply.
- What's the recent tenant-quality profile in this submarket — average credit score on applications, eviction rate, late-payment / NSF rate, and stable-employment percentage? A property-management company in the area should have these aggregated.
- How much new apartment / multifamily construction is in the pipeline within 1–3 miles? Heavy new supply (>2% of stock underway) typically softens rents 12–24 months out; light construction supports rent growth.
Investment metrics
- 1% rule
- 1.04% ✓
- Cap rate
- 8.32%
- Cash-on-cash
- 7.25%
- DSCR
- 1.32
- GRM
- 8.0
CMA / ARV
- ARV (on-the-fly)
- $723,330
- Comps found
- 2
Show comp detail 2 sales within ~0.75 mi
| Address | Dist | Beds/Ba | Sqft | Sold | Price | $/sf | Match |
|---|---|---|---|---|---|---|---|
| 54-56 Avery St | 0.16mi | 9/3.0 (+1) | 3,060 (-1%) | 17mo | $650,000 | $212 | 72 |
| 101 East St | 0.63mi | 8/5.0 | 2,978 (-3%) | 21mo | $700,000 | $235 | 40 |
Match score weights: distance 35% · size 25% · config 20% · recency 20%. Top-matched comps best support the ARV.
Projected returns pro-forma
-3.0% appreciation · 2.88% rent growth · sell at horizon
- IRR
- -5.3%
- Equity multiple
- 0.80×
- Total profit
- $-37,850
- Equity at exit
- $101,375
- IRR
- 4.2%
- Equity multiple
- 1.30×
- Total profit
- $57,614
- Equity at exit
- $58,785
Cash invested: $190,372 (down + closing). Projections, not guarantees.
Landlord ↔ Tenant lean methodology
- Overall (STATE)
- 20 Strongly Tenant-Friendly
- State Massachusetts
- 20 Strongly Tenant-Friendly · D+15
- County
- — inherits STATE
- City
- — inherits STATE
ZIP-level market 02760
- Rents YoY
- 2.9%
- Active inventory
- 37
- Price-to-rent
- 24.1×
Monthly cashflow live
- Estimated rent
- $7,061 high interval (Pro) →
- Mortgage (P&I)
- −$3,565
- Tax from tax record
- −$580 /mo · $6,955/yr
- Insurance
- −$283
- HOA
- −$0
- Vacancy / Maint / Mgmt
- −$1,483
- Net cashflow
- $1,150
Break-even live
Sensitivity live
| Price | -10% $1,535 | -5% $1,342 | +0% $1,150 | +5% $957 | +10% $765 |
|---|---|---|---|---|---|
| Rent | -10% $592 | -5% $871 | +0% $1,150 | +5% $1,429 | +10% $1,708 |
| Rate | -1.0pp $1,492 | -0.5pp $1,323 | base $1,150 | +0.5pp $974 | +1.0pp $794 |
3-unit breakdown (identical units grouped — click to expand)
| Units | Beds | Baths | Est. rent |
|---|---|---|---|
| 3× units | 2 | 1 | $7,062 |
| #1 | 2 | 1 | $2,354 |
| #2 | 2 | 1 | $2,354 |
| #3 | 2 | 1 | $2,354 |
| Total (3 units) | $7,061 | ||
UW: 25.0% down · 7.5% · 30yr · 1.5% tax · 5.0% vac · 8.0% maint · 8.0% mgmt
Financing live
Cash to close
- Down payment
- $169,975
- Closing costs
- $20,397
- Reserves months
- —
- Total cash needed
- —
Loan-product check · same deal, 3 products live
Conventional
25% down · 7.5% · 30yr
- Down + closing
- —
- Monthly P&I
- —
- Monthly cashflow
- —
- DSCR
- —
- Eligible?
- —
Personal DTI + credit; lowest rate.
DSCR
20% down · 8.5% · 30yr
- Down + closing
- —
- Monthly P&I
- —
- Monthly cashflow
- —
- DSCR
- —
- Eligible?
- —
No personal income docs; deal must DSCR.
Hard money
10% down · 12.0% · 12mo
- Down + closing
- —
- Monthly P&I
- —
- Monthly cashflow
- —
- DSCR
- —
- Eligible?
- —
Short-term bridge; refi at stabilization.
Listing history 8 events
-
2026-06-18days on market $679,900 Active 10 DOM
-
2026-06-17days on market $679,900 Active 9 DOM
-
2026-06-16days on market $679,900 Active 8 DOM
-
2026-06-15days on market $679,900 Active 7 DOM
-
2026-06-13days on market $679,900 Active 5 DOM
-
2026-06-13statusdays on market $679,900 Active 4 DOM
-
2026-06-08remarks 699-char remark
-
2026-06-08$679,900 New 1 DOM
ⓘ Source: listings_history table (triggers on properties + properties_extension) + one-shot
backfill from property_details.listing_events for pre-trigger history.
Tax reassessment forecast MA · Partial reset (capped growth)
- Current annual tax
- $6,955 · $580/mo
- Projected year-2 tax
- $7,659 · $638/mo
- Expected delta
- +$704/yr (+$59/mo · 10.1%)
ⓘ Screening estimate from a state-policy table — verify with the county assessor before closing.
Climate risk First Street
- Flood 1/10 Low FEMA zone X (unshaded) · 0% chance over 30 yrs
- Wildfire 1/10 Low
- Heat 5/10 Major 7 d/yr ≥97°F today · 15 d/yr by 30 yrs out
- Wind 6/10 Major 64% chance of damaging wind over 30 yrs
- Air quality 2/10 Low 1 unhealthy d/yr today · 2 by 30 yrs out
Nearby sold comps map
Loading sold comps map…
Walkable amenities ~0.75 mi
Loading nearby amenities…
Taxation est. · year 1
- Rental income
- $84,732
- − Mortgage interest
- −$38,085
- − Property taxes
- −$6,955
- − Insurance
- −$3,400
- − Repairs & maintenance
- −$6,779
- − Management
- −$6,779
- − Depreciation
- −$19,779
- Taxable income
- $2,957
- Est. tax owed @ 24.0%
- −$710
- After-tax cash flow
- $13,089/yr
For passive investors: Depreciation is non-cash, so a rental often shows a tax loss while cash-flowing — sheltering income. Rental losses are passive: they offset passive income freely, and up to $25,000/yr can offset ordinary (W-2) income if you actively participate and your MAGI is under $100k (phasing out to $0 by $150k); unused losses carry forward. On sale, claimed depreciation is recaptured at up to 25%, and gains may owe capital-gains tax (a 1031 exchange can defer both). Figures are a year-1 estimate at your 24.0% rate — not tax advice; consult a CPA.
Schools (NCES district)
- District
- North Attleborough
- NCES district ID
- 2508730
- Math proficiency
- 46% ▼ -12.00%
- Reading proficiency
- 60% ▼ -1.00%
- Median HH income
- $80,560
- Composite
- 48.14/100
- National rank
- #2180
- State rank
- #98 of 302 in MA
Livability — North Attleborough Town
No livability data for this city. (Only ~50 U.S. cities are tracked.)
Census & demographics
- Census place
- North Attleborough Town, MA
- County
- Bristol County · 342,083 people
- City population
- 30,842
- Metro
- Providence-Warwick, RI-MA
- Population (ZIP)
- 29,177
- Household income
- $112,027
- Rent vs Own
- Severe rent burden
- 681.0
Population outlook (Bristol County) Hauer SSP2
- Today (2025)
- 570,212 people
- By 2030
- 571,181 · +0.2%
- By 2040
- 565,389 · -0.8%
- By 2050
- 552,141 · -3.2%
- By 2075
- 520,923 · -8.6%
- By 2100
- 474,363 · -16.8%
Race, ethnicity, and origin ACS 2023
- Neighborhood character
- Predominantly White (84%)
- Race & ethnicity
- White 84% Asian 6% Two or more races 5% Hispanic / Latino 4% Black 2%
- Common ancestry
- Lithuanian 9% Romanian 6% Russian 5%
- Foreign-born
- 9% · Canada, China
- Languages at home
- 89% English-only · Other Indo-European 4% Spanish 3% Other Asian/Pacific 2%
Political lean MEDSL · Bristol
- 2024 margin
- Toss-up / Even · D 49.8% · R 48.5% · Other 1.8%
- 2008→2024 swing
- -21.9pp toward R · 2008: 23.2pp · 2024: 1.3pp
- All cycles
- 2024: D+1.3 2020: D+12.0 2016: D+9.3 2012: D+20.5 2008: D+23.2
Not yet ingested
- Civics
- —
Market trends
- HPI YoY
- ▼ -575.93%
- Current HPI
- 302.0435
- Rent YoY
- ▲ 2.88%
- Metro
- Providence-Warwick, RI-MA
- State GDP YoY
- ▲ 2.28%
- F500 in state
- 38
Industry mix (Fortune 500 HQ in MA)
| Industry | F500 HQs | Revenue |
|---|---|---|
| Technology | 3 | $17B |
|
||
| Insurance | 2 | $84B |
|
||
| Retail | 2 | $76B |
|
||
| Life Sciences | 1 | $43B |
|
||
| Energy Technology | 1 | $31B |
|
||
| Aerospace / Defense | 1 | $18B |
|
||
Price history
+203.7% since first listed23 events — show timeline
- 2026-06-08 Listed $679,900 MLS PIN
- 2021-10-26 Sold (MLS) $574,900 MLS PIN
- 2021-09-21 Pending — MLS PIN
- 2021-09-15 Listed $574,900 MLS PIN
- 2013-12-19 Price Changed $329,000 RIS
- 2009-02-26 Sold (Public Records) $255,000 Public Records
- 2009-02-25 Listing Removed — MLS PIN
- 2009-02-25 Sold (MLS) $255,000 MLS PIN
- 2009-02-12 Contingent — MLS PIN
- 2009-02-10 Listing Removed — RIS
- 2008-11-17 Price Changed $329,000 MLS PIN
- 2008-08-11 Listed $455,000 RIS
- 2008-08-10 Listed $339,000 MLS PIN
- 2006-12-29 Listing Removed — RIS
- 2006-09-17 Listed $485,000 RIS
- 2005-08-01 Sold (Public Records) $455,000 Public Records
- 2005-07-29 Sold (MLS) $455,000 MLS PIN
- 2005-06-20 Listing Removed — MLS PIN
- 2005-06-14 Listed $459,900 MLS PIN
- 1999-09-28 Sold (Public Records) $210,000 Public Records
- 1999-09-28 Sold (MLS) $210,000 MLS PIN
- 1999-07-28 Listing Removed — MLS PIN
- 1999-07-08 Listed $223,900 MLS PIN
Property tax history
+5.3%/yrLatest (2023): $6,955 · +7.9% YoY. Source: county tax records.
Cash-flow waterfall
monthlySold comps — $/sqft
last 12 mo · ≤1 miLoading sold comps…