 Duplex
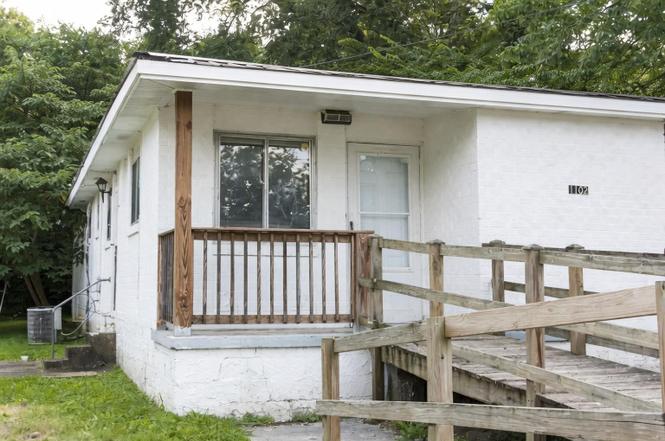
1102 N Hawthorne St · Chattanooga, TN
Flood risk 9/10 · Severe
- FEMA flood zone
- X (shaded)
- Chance of flooding over 30 yrs
- 0.99%
- Est. flood insurance / yr
- $507 – $1,088
Fire risk 1/10 · Minimal
- Est. fire insurance / yr
- $949 – $1,763
Heat risk 6/10 · Moderate
- Hot days now (above 104°F)
- 7 days/yr
- Hot days in 30 yrs
- 19 days/yr
Wind risk 4/10 · Minor
- Chance of severe wind over 30 yrs
- 10.0%
Air-quality risk 4/10 · Minor
- Unhealthy air days now
- 3 days/yr
- Unhealthy air days in 30 yrs
- 4 days/yr
Risk factors via First Street. Map © Google.
Why this score? — see what drove the B- grade
The composite is a weighted blend of 9 inputs, each scored 0–100. Each bar is that input's sub-score; the figure is the points it added to the 100-point composite (weight × sub-score).
- Cash flow +30.0/30.0
- DSCR +10.0/10.0
- ARV discount +9.1/15.0
- 1% rule +7.6/10.0
- Livability +3.9/5.0
- Rent growth +3.8/5.0
- Schools +2.7/10.0
- Condition / age +2.5/5.0
- Appreciation +0.0/10.0
$200,000
🖨 Deal sheet 📄 Offer letter ✓ Due diligence
Multi-family units
County records classify this as Multi-Family (2-4 Unit). Listing-text estimate: 2 units. confirmed
Listing remarks MLS
Excellent investment opportunity! This fully occupied duplex features two units, each offering 2 bedrooms and 1 full bath with washer and dryer hookups in place. Well maintained and priced to move, this property delivers immediate cash flow from day one. Ideal for investors looking to build or expand their rental portfolio with a solid, income producing asset. Turn key and ready for its next owner!
Key facts
- 6,027 sq ft lot
- Built 1960
- Listed 154 days
Property features AI
Finance
- Other: Residential income property
- Financial info: Tenant pays some utilities (specified as other)
Exterior
- Parking: Detached parking
- Utilities: Public water; Public sewer; Water available
- Home design: Duplex; Attached property; Three or more levels
- Construction: Brick and other construction materials; Other roof type
- Exterior features: Lot approximately 49' x 123'
Interior
- Bedrooms: Two 2-bedroom units
- Flooring: Vinyl
- Bathrooms: Each unit has 1 bathroom
- Heating & cooling: Central heating; Central air
- Interior features: Vinyl flooring; Central heating; Central air conditioning
- Laundry & utility: Washer hookup; Electric dryer hookup
Neighborhood map
What this means for you Summary
Snapshot
- This is a 2 × 2-bed/1.0-bath units multifamily listed at $200k.
Deal economics
- At list price, monthly cash flow is $678 ($8k/yr) — positive. Per door: $339/mo.
- The deal already cash-flows at list — no discount required.
- Meets the 1% rule at list price ($3k rent vs $200k).
- Recommended offer: $176k (12.0% below list) — sets the bar for market timing.
- Cap rate 10.8% vs local median 3.4% in Chattanooga — top-decile yield for the area; either an underpriced asset or a hidden risk that comps aren't pricing in. Stress-test before assuming the spread holds.
Location & tenants
- Location reads 78/100 on livability (#3 in TN, #2,582 nationally) — a middle-class / working-renter tenant base. Strengths: amenities A+, commute A+, cost of living A+; Watch: employment D+, crime F.
- Hamilton County (urban): math 31% / reading 31% proficiency, ranked #42 of 139 in TN (top 30%) — families likely to look elsewhere, expect single-tenant / working-renter base with shorter leases.
- Zoned schools: Orchard Knob Elementary (math 12% / reading 2%, grade F, #863 of 952 statewide, top 92%, 477 students, 0% FRL); Brainerd High School (math 2% / reading 12%, grade F, #294 of 332 statewide, top 91%, 635 students, 0% FRL) — zoned schools average 0% FRL vs 52% district-wide (52 pts lower); this property's tenant base skews higher-income than the district average.
- Zoned-school proficiency averages 7% at this address vs 31% district-wide (-24 pts) — the specific schools serving this property underperform the Hamilton County average; the district grade overstates school quality for this exact location.
- Market conditions: Rents rising fast (+5.1%/yr); 127 active listings in the ZIP; 21 comparable units currently listed for rent nearby; rentals at typical pace (median 24d on market — plan ~3-4 weeks tenant-placement turnaround); lower-income renter base — watch delinquency; 2,133 units permitted in Hamilton County in 2024 (405 in 5+ unit buildings).
Forward outlook
- Local home prices are declining (-3.0%/yr); year-one equity from $1k of loan paydown is wiped out by about $6k of value loss. Plan a longer hold.
- Hamilton County population projected at +23% by 2050 — long-run rental-demand tailwind backs the buy-and-hold thesis.
- At projected returns (-3.0% appreciation + 5.1% rent growth), your $56k cash investment doubles in ~7 years — after that, you're playing with house money.
Negotiation context
- It's been on market 154 days — a 12% lower offer ($176k) is reasonable based on typical stale-listing flexibility.
- 4 sale attempts since 5y ago with the ask held roughly flat each time — persistent listings suggest the price (not the market) is what's stuck; bring a comps-based counter.
Risks & watch-outs
- Watch-outs: flood insurance adds $66/mo.
- Climate carrying-cost: severe flood risk; extreme-heat days projected 7→19/yr by 2055 (HVAC capex compounding) — expect insurance premiums to compound above CPI over the hold.
Questions for the listing agent
- It's been on market 154 days. Have you received any prior offers? Is the seller open to a 12% concession, seller financing, or rate buy-down credit?
- Can we see the unit-by-unit rent roll, current vacancy, and any below-market leases? What's the average tenancy length?
- What capital expenditures (roof, boiler, parking lot, exteriors) have been made in the last 5 years, and what's planned in the next 2?
- Built in 1960 — when were the roof, HVAC, electrical panel, plumbing, and water heater last replaced?
- What's the actual annual flood-insurance premium (NFIP or private), and is the property in a SFHA with mandatory coverage?
- Why hasn't it sold? Are there any deal-killer items the seller is aware of (foundation, flood, title, zoning, code violations)?
- Is there a deadline driving the sale (1031 exchange, divorce, estate, relocation)? That informs how much negotiation room exists.
- Schools are F-rated, which usually means shorter tenancies and higher turnover. Who's the typical renter profile here, and what's been the actual vacancy rate?
- Crime grade is F in this area — have there been break-ins, vandalism, or insurance claims at this property in the last 3 years? What carrier currently insures it and at what premium?
- What's the average days-on-market for RENTAL listings here right now (not sales)? A rising rental-DOM trend means longer vacancies and softer asking-rent achievability than the comps imply.
- What's the recent tenant-quality profile in this submarket — average credit score on applications, eviction rate, late-payment / NSF rate, and stable-employment percentage? A property-management company in the area should have these aggregated.
- How much new apartment / multifamily construction is in the pipeline within 1–3 miles? Heavy new supply (>2% of stock underway) typically softens rents 12–24 months out; light construction supports rent growth.
Investment metrics
- 1% rule
- 1.26% ✓
- Cap rate
- 10.76%
- Cash-on-cash
- 15.96%
- DSCR
- 1.71
- GRM
- 6.6
CMA / ARV
- ARV (on-the-fly)
- $207,504
- Comps found
- 4
Show comp detail 4 sales within ~0.75 mi
| Address | Dist | Beds/Ba | Sqft | Sold | Price | $/sf | Match |
|---|---|---|---|---|---|---|---|
| 15131511 Wheeler Ave | 0.58mi | 4/2.0 | 1,623 (+3%) | 18mo | $390,000 | $240 | 52 |
| 2116 Citico Ave | 0.49mi | 4/2.0 | 1,464 (-7%) | 18mo | $135,000 | $92 | 51 |
| 2368 Milne St | 0.48mi | 4/2.0 | 1,760 (+12%) | 10mo | $202,117 | $115 | 49 |
| 2106 Blackford St | 0.70mi | 5/2.0 (+1) | 1,747 (+11%) | 17mo | $231,000 | $132 | 29 |
Match score weights: distance 35% · size 25% · config 20% · recency 20%. Top-matched comps best support the ARV.
Projected returns pro-forma
-3.0% appreciation · 5.13% rent growth · sell at horizon
- IRR
- 7.3%
- Equity multiple
- 1.29×
- Total profit
- $16,288
- Equity at exit
- $29,821
- IRR
- 18.3%
- Equity multiple
- 2.67×
- Total profit
- $93,366
- Equity at exit
- $17,292
Cash invested: $56,000 (down + closing). Projections, not guarantees.
Landlord ↔ Tenant lean methodology
- Overall (STATE)
- 87 Strongly Landlord-Friendly
- State Tennessee
- 87 Strongly Landlord-Friendly · R+13
- County
- — inherits STATE
- City
- — inherits STATE
ZIP-level market 37406
- Home prices YoY
- -23.8%
- Rents YoY
- 5.1%
- Active inventory
- 127
- Price-to-rent
- 13.3×
Monthly cashflow live
- Estimated rent
- $2,514 high interval (Pro) →
- Mortgage (P&I)
- −$1,049
- Tax from tax record
- −$109 /mo · $1,310/yr
- Insurance
- −$83
- Flood insurance flood zone
- −$66 /mo · $798/yr
- HOA
- −$0
- Vacancy / Maint / Mgmt
- −$528
- Net cashflow
- $678
Break-even live
2-unit breakdown (identical units grouped — click to expand)
| Units | Beds | Baths | Est. rent |
|---|---|---|---|
| 2× units | 2 | 1 | $2,514 |
| #1 | 2 | 1 | $1,257 |
| #2 | 2 | 1 | $1,257 |
| Total (2 units) | $2,514 | ||
UW: 25.0% down · 7.5% · 30yr · 1.5% tax · 5.0% vac · 8.0% maint · 8.0% mgmt
Financing live
Cash to close
- Down payment
- $50,000
- Closing costs
- $6,000
- Reserves months
- —
- Total cash needed
- —
Loan-product check · same deal, 3 products live
Conventional
25% down · 7.5% · 30yr
- Down + closing
- —
- Monthly P&I
- —
- Monthly cashflow
- —
- DSCR
- —
- Eligible?
- —
Personal DTI + credit; lowest rate.
DSCR
20% down · 8.5% · 30yr
- Down + closing
- —
- Monthly P&I
- —
- Monthly cashflow
- —
- DSCR
- —
- Eligible?
- —
No personal income docs; deal must DSCR.
Hard money
10% down · 12.0% · 12mo
- Down + closing
- —
- Monthly P&I
- —
- Monthly cashflow
- —
- DSCR
- —
- Eligible?
- —
Short-term bridge; refi at stabilization.
Rent comps 21 comps
| Address | Beds | Baths | Sqft | Rent | $/sqft | DOM | Units | Dist |
|---|---|---|---|---|---|---|---|---|
| 2105 Rawlings St Chattanooga, TN | 3.0 | 1.0 | 1064 | $1,300 | $1.22 | 13d | 1 | 0.32mi |
| 1908 Robbins St Chattanooga, TN | 3.0 | 2.0 | 1783 | $1,750 | $0.98 | 13d | 1 | 0.33mi |
| 2009 Camden St Chattanooga, TN | 3.0 | 1.5 | 1148 | $1,450 | $1.26 | 23d | 1 | 0.41mi |
| 1754 Ocoee St Chattanooga, TN | 3.0 | 1.5 | 1050 | $1,250 | $1.19 | 13d | 1 | 0.48mi |
| 1601 Arlington Ave Chattanooga, TN | 3.0 | 1.0 | 1416 | $1,650 | $1.17 | 13d | 1 | 0.55mi |
| 709 N Holly St Chattanooga, TN | 3.0 | 2.0 | 1092 | $1,850 | $1.69 | 13d | 1 | 0.55mi |
| 1706 Wheeler Ave Chattanooga, TN | 3.0 | 1.0 | 1317 | $1,625 | $1.23 | 23d | 1 | 0.68mi |
| 2001 Garfield St Chattanooga, TN | 4.0 | 2.0 | 1413 | $1,700 | $1.20 | 23d | 1 | 0.69mi |
| 2709 Citico Ave Chattanooga, TN | 2.0–3.0 | 1.0 | 1038 | $1,400 | $1.35 | 23d | 1 | 0.87mi |
| 2009 Taylor St Chattanooga, TN | 3.0 | 1.5 | 1800 | $1,950 | $1.08 | 23d | 1 | 0.87mi |
| 226 N Hickory St Chattanooga, TN | 3.0 | 2.0 | 1350 | $1,895 | $1.40 | 21d | 1 | 0.92mi |
| 1905 Ivy St Chattanooga, TN | 4.0 | 3.0 | 1860 | $2,495 | $1.34 | 23d | 1 | 0.93mi |
| 1906 Vine St Chattanooga, TN | 3.0 | 2.5 | 1881 | $2,200 | $1.17 | 23d | 1 | 1.02mi |
| 2420 Vine St Chattanooga, TN | 3.0 | 1.0 | 1260 | $1,800 | $1.43 | 23d | 1 | 1.17mi |
| 1814 Duncan Ave Chattanooga, TN | 3.0 | 2.0 | 2056 | $2,500 | $1.22 | 21d | 1 | 1.20mi |
| 2106 Duncan Ave Unit 102 Chattanooga, TN | 3.0 | 2.5 | 1600 | $2,295 | $1.43 | 23d | 1 | 1.23mi |
| 1705 Bailey Ave Chattanooga, TN | 3.0 | 2.0 | 1632 | $1,850 | $1.13 | 23d | 1 | 1.31mi |
| 2425 Chamberlain Ave Chattanooga, TN | 3.0 | 2.0 | 1422 | $1,795 | $1.26 | 23d | 1 | 1.35mi |
| 2603 Dodson Ave Chattanooga, TN | 4.0 | 1.0 | 1104 | $1,250 | $1.13 | 21d | 1 | 1.40mi |
| 659 Bespoke WAY Chattanooga, TN | 3.0 | 3.0 | 1564 | $2,750 | $1.76 | 23d | 1 | 1.44mi |
| 756 Bespoke Way Chattanooga, TN | 3.0 | 3.0 | 1510 | $4,000 | $2.65 | 13d | 1 | 1.45mi |
Listing history 31 events
-
2026-06-18days on market $200,000 Active 154 DOM
-
2026-06-17days on market $200,000 Active 153 DOM
-
2026-06-16days on market $200,000 Active 152 DOM
-
2026-06-15days on market $200,000 Active 151 DOM
-
2026-06-14days on market $200,000 Active 149 DOM
-
2026-06-10days on market $200,000 Active 146 DOM
-
2026-06-09days on market $200,000 Active 145 DOM
-
2026-06-08days on market $200,000 Active 144 DOM
-
2026-06-07days on market $200,000 Active 143 DOM
-
2026-06-05days on market $200,000 Active 140 DOM
-
2026-06-03days on market $200,000 Active 139 DOM
-
2026-06-02days on market $200,000 Active 138 DOM
-
2026-06-01days on market $200,000 Active 137 DOM
-
2026-05-31days on market $200,000 Active 136 DOM
-
2026-05-30days on market $200,000 Active 135 DOM
-
2026-02-04price $200,000 401-char remark
Show marketing remark (401 chars)
Excellent investment opportunity! This fully occupied duplex features two units, each offering 2 bedrooms and 1 full bath with washer and dryer hookups in place. Well maintained and priced to move, this property delivers immediate cash flow from day one. Ideal for investors looking to build or expand their rental portfolio with a solid, income producing asset. Turn key and ready for its next owner!
-
2026-02-04price $200,000
Show marketing remark (401 chars)
Excellent investment opportunity! This fully occupied duplex features two units, each offering 2 bedrooms and 1 full bath with washer and dryer hookups in place. Well maintained and priced to move, this property delivers immediate cash flow from day one. Ideal for investors looking to build or expand their rental portfolio with a solid, income producing asset. Turn key and ready for its next owner!
-
2026-01-15$210,000 Active 401-char remark
Show marketing remark (401 chars)
Excellent investment opportunity! This fully occupied duplex features two units, each offering 2 bedrooms and 1 full bath with washer and dryer hookups in place. Well maintained and priced to move, this property delivers immediate cash flow from day one. Ideal for investors looking to build or expand their rental portfolio with a solid, income producing asset. Turn key and ready for its next owner!
-
2026-01-15$210,000 Active
Show marketing remark (401 chars)
Excellent investment opportunity! This fully occupied duplex features two units, each offering 2 bedrooms and 1 full bath with washer and dryer hookups in place. Well maintained and priced to move, this property delivers immediate cash flow from day one. Ideal for investors looking to build or expand their rental portfolio with a solid, income producing asset. Turn key and ready for its next owner!
-
2024-03-14historical $900
-
2024-01-18price $900
-
2023-12-01price $975
-
2023-11-28$1,260
-
2022-07-04price $850
-
2022-01-18soldstatus $175,000
-
2021-12-15soldstatus $175,000 Closed 533-char remark
Show marketing remark (533 chars)
Check out this all brick duplex investment property! Each side has 2 bedrooms and 1 bathroom. Both sides are currently occupied. Right side is on a year lease renting for $835/month and has newly painted cabinets and LVP flooring. Left side is on a month to month lease renting for $650/month. Recent updates to HVAC and exterior paint. Some recent improvements include updated exterior lighting and porch improvements. * Do not disturb tenants. * * No showings until property is under contract and earnest money has been received.
-
2021-11-08historical Contingent 533-char remark
Show marketing remark (533 chars)
Check out this all brick duplex investment property! Each side has 2 bedrooms and 1 bathroom. Both sides are currently occupied. Right side is on a year lease renting for $835/month and has newly painted cabinets and LVP flooring. Left side is on a month to month lease renting for $650/month. Recent updates to HVAC and exterior paint. Some recent improvements include updated exterior lighting and porch improvements. * Do not disturb tenants. * * No showings until property is under contract and earnest money has been received.
-
2021-11-04$175,000 Active 533-char remark
Show marketing remark (533 chars)
Check out this all brick duplex investment property! Each side has 2 bedrooms and 1 bathroom. Both sides are currently occupied. Right side is on a year lease renting for $835/month and has newly painted cabinets and LVP flooring. Left side is on a month to month lease renting for $650/month. Recent updates to HVAC and exterior paint. Some recent improvements include updated exterior lighting and porch improvements. * Do not disturb tenants. * * No showings until property is under contract and earnest money has been received.
-
2021-03-31soldstatus $95,000
-
2015-12-03soldstatus $45,000
-
2002-11-27soldstatus $45,000
ⓘ Source: listings_history table (triggers on properties + properties_extension) + one-shot
backfill from property_details.listing_events for pre-trigger history.
Tax reassessment forecast TN · Resets to sale price
- Current annual tax
- $1,310 · $109/mo
- Projected year-2 tax
- $1,420 · $118/mo
- Expected delta
- +$110/yr (+$9/mo · 8.4%)
ⓘ Screening estimate from a state-policy table — verify with the county assessor before closing.
Climate risk First Street
- Flood 9/10 Extreme FEMA zone X (shaded) · 99% chance over 30 yrs
- Wildfire 1/10 Low
- Heat 6/10 Major 7 d/yr ≥104°F today · 19 d/yr by 30 yrs out
- Wind 4/10 Moderate 10% chance of damaging wind over 30 yrs
- Air quality 4/10 Moderate 3 unhealthy d/yr today · 4 by 30 yrs out
Nearby sold comps map
Loading sold comps map…
Walkable amenities ~0.75 mi
Loading nearby amenities…
Taxation est. · year 1
- Rental income
- $30,168
- − Mortgage interest
- −$11,203
- − Property taxes
- −$1,310
- − Insurance
- −$1,798
- − Repairs & maintenance
- −$2,413
- − Management
- −$2,413
- − Depreciation
- −$5,818
- Taxable income
- $5,213
- Est. tax owed @ 24.0%
- −$1,251
- After-tax cash flow
- $6,889/yr
For passive investors: Depreciation is non-cash, so a rental often shows a tax loss while cash-flowing — sheltering income. Rental losses are passive: they offset passive income freely, and up to $25,000/yr can offset ordinary (W-2) income if you actively participate and your MAGI is under $100k (phasing out to $0 by $150k); unused losses carry forward. On sale, claimed depreciation is recaptured at up to 25%, and gains may owe capital-gains tax (a 1031 exchange can defer both). Figures are a year-1 estimate at your 24.0% rate — not tax advice; consult a CPA.
Schools (NCES district)
- District
- Hamilton County
- NCES district ID
- 4701590
- Math proficiency
- 31% ▼ -10.00%
- Reading proficiency
- 31% ▼ -3.00%
- Median HH income
- $47,456
- Composite
- 26.8/100
- National rank
- #7122
- State rank
- #42 of 139 in TN
Livability — Chattanooga
- Score
- 78/100
- State rank
- #3
- US rank
- #2582
Category grades
Schools grade is shown separately in the Schools card above.
Census & demographics
- Census place
- Chattanooga, TN
- County
- Hamilton County · 312,777 people
- City population
- 131,999
- Metro
- Chattanooga, TN-GA
- Population (ZIP)
- 13,364
- Household income
- $44,850
- Rent vs Own
- Severe rent burden
- 759.0
Population outlook (Hamilton County) Hauer SSP2
- Today (2025)
- 393,784 people
- By 2030
- 412,983 · +4.9%
- By 2040
- 449,502 · +14.1%
- By 2050
- 484,341 · +23.0%
- By 2075
- 565,746 · +43.7%
- By 2100
- 618,394 · +57.0%
Race, ethnicity, and origin ACS 2023
- Neighborhood character
- Predominantly Black (70%)
- Race & ethnicity
- Black 70% White 21% Hispanic / Latino 6% Two or more races 5%
- Hispanic origin (detail)
- Puerto Rican 1%
- Common ancestry
- Italian 1% Slovak 1%
- Foreign-born
- 5% · Canada
- Languages at home
- 92% English-only · Spanish 6% Other Indo-European 1%
Political lean MEDSL · Hamilton
- 2024 margin
- R (+13.1) · D 42.7% · R 55.7% · Other 1.6%
- 2008→2024 swing
- -1.2pp toward R · 2008: -11.8pp · 2024: -13.1pp
- All cycles
- 2024: R+13.1 2020: R+9.7 2016: R+16.6 2012: R+14.8 2008: R+11.8
Not yet ingested
- Civics
- —
Market trends
- HPI YoY
- ▼ -63.73%
- Current HPI
- 203.5858
- Rent YoY
- ▲ 5.13%
- Metro
- Chattanooga, TN-GA
- State GDP YoY
- ▲ 2.78%
- F500 in state
- 22
Industry mix (Fortune 500 HQ in TN)
| Industry | F500 HQs | Revenue |
|---|---|---|
| Healthcare | 3 | $91B |
|
||
| Retail | 3 | $72B |
|
||
| Transportation / Logistics | 1 | $88B |
|
||
| Paper / Packaging | 1 | $19B |
|
||
| Insurance | 1 | $13B |
|
||
| Energy | 1 | $12B |
|
||
Price history
+344.4% since first listed16 events — show timeline
- 2026-02-04 Price Changed $200,000 GCAR
- 2026-02-04 Price Changed $200,000 REALTRACS as Distributed by MLS Grid
- 2026-01-15 Listed $210,000 GCAR
- 2026-01-15 Listed $210,000 REALTRACS as Distributed by MLS Grid
- 2024-03-14 Rental Removed $900 APPFOLIO
- 2024-01-18 Price Changed $900 APPFOLIO
- 2023-12-01 Price Changed $975 APPFOLIO
- 2023-11-28 Listed for Rent $1,260 APPFOLIO
- 2022-07-04 Price Changed $850 APPFOLIO
- 2022-01-18 Sold (Public Records) $175,000 Public Records
- 2021-12-15 Sold (MLS) $175,000 GCAR
- 2021-11-08 Contingent — GCAR
- 2021-11-04 Listed $175,000 GCAR
- 2021-03-31 Sold (Public Records) $95,000 Public Records
- 2015-12-03 Sold (Public Records) $45,000 Public Records
- 2002-11-27 Sold (Public Records) $45,000 Public Records
Property tax history
+8.6%/yrLatest (2025): $1,310 · +165.1% YoY. Source: county tax records.
Cash-flow waterfall
monthlySold comps — $/sqft
last 12 mo · ≤1 miLoading sold comps…