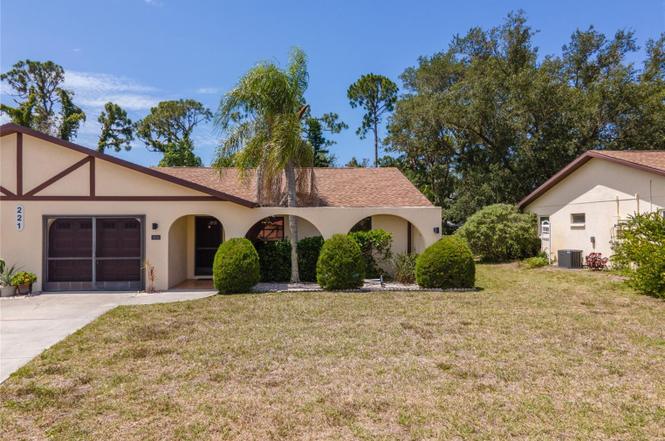
221 High Point Dr Unit 221A · Englewood, FL
Flood risk 7/10 · Major
- FEMA flood zone
- AE
- Chance of flooding over 30 yrs
- 0.87%
- Est. flood insurance / yr
- $1,737 – $8,500
Fire risk 1/10 · Minimal
- Est. fire insurance / yr
- $947 – $1,759
Heat risk 10/10 · Severe
- Hot days now (above 107°F)
- 7 days/yr
- Hot days in 30 yrs
- 28 days/yr
Wind risk 10/10 · Severe
- Chance of severe wind over 30 yrs
- 99.0%
Air-quality risk 2/10 · Minimal
- Unhealthy air days now
- 1 days/yr
- Unhealthy air days in 30 yrs
- 1 days/yr
Risk factors via First Street. Map © Google.
Why this score? — see what drove the B grade
The composite is a weighted blend of 9 inputs, each scored 0–100. Each bar is that input's sub-score; the figure is the points it added to the 100-point composite (weight × sub-score).
- Cash flow +27.4/30.0
- 1% rule +10.0/10.0
- DSCR +9.6/10.0
- ARV discount +7.5/15.0
- Schools +5.4/10.0
- Rent growth +4.8/5.0
- Livability +3.7/5.0
- Condition / age +2.5/5.0
- Appreciation +0.0/10.0
$175,000
🖨 Deal sheet 📄 Offer letter ✓ Due diligence
Listing remarks
Welcome to High Point Estates! This spacious villa-style residence offers one of the community's larger floor plans and is ready for its next owner to make it their own. Being sold FULLY FURNISHED, this MOVE-IN-READY home features a desirable split-bedroom layout, providing privacy for both owners and guests. * * * The GENEROUS LIVING ROOM offers plenty of space for entertaining, while THE AIR-CONDITIONED FLORIDA ROOM creates additional year-round living space overlooking the private backyard. Both bedrooms feature WALK-IN CLOSETS, and the home includes a convenient one-car garage with laundry area. Tile flooring is found in the kitchen and dining areas, while the remaining spaces offer
Key facts
- Split bedroom layout
- Walk in closets
- Move in ready
Tags
Property features AI
Finance
- Other: Furnished; Total annual fees listed as $8,892.60
- Financial info: Lease restrictions apply
- HOA & community: HOA required (High Point Condominium Association, Inc.); Monthly HOA approximately $741.05 (quarterly fee noted $2,223.15); HOA amenities: clubhouse, pool, recreation facilities, shuffleboard court, cable TV, maintenance, private road; Community features: buyer approval required, community mailbox, deed restrictions, pool; Pets allowed (cats and dogs) with limits; max pet weight 40 lbs
Exterior
- Parking: Attached garage (1 car) with garage door opener; Driveway parking; Ground-level garage — approx. 23 x 13
- Security: Smoke detector(s)
- Utilities: Public water; Public sewer; Electricity connected; Cable connected; Water and sewer connected
- Home design: Residential villa (attached); One story; Faces north; Entry on first floor
- Construction: Block, concrete and stucco construction; Shingle roof; Slab foundation; Completed condition; Built as part of building/unit 221A
- Exterior features: Covered front porch; Exterior lighting; Rain gutters; Cleared, landscaped lot; Located on a cul-de-sac; Level, paved lot; Private maintained road
Interior
- Kitchen: Cooktop; Dishwasher; Microwave; Refrigerator
- Bedrooms: 2 bedrooms
- Flooring: Carpet; Tile
- Bathrooms: 2 full bathrooms
- Heating & cooling: Electric heating; Central air conditioning
- Interior features: Ceiling fans; High ceilings; Thermostat; Smoke detector(s)
- Laundry & utility: Washer hookup; Dryer hookup (electric); Laundry located in garage
Neighborhood map
What this means for you Summary
Snapshot
- This is a 2-bed/2.0-bath condo listed at $175k.
Deal economics
- At list price, monthly cash flow is $86 ($1k/yr) — positive.
- The deal already cash-flows at list — no discount required.
- Meets the 1% rule at list price ($3k rent vs $175k).
- Cap rate 9.8% vs local median 3.8% in Englewood — top-decile yield for the area; either an underpriced asset or a hidden risk that comps aren't pricing in. Stress-test before assuming the spread holds.
Location & tenants
- Location reads 73/100 on livability (#321 in FL) — a middle-class / working-renter tenant base. Strengths: housing A+, cost of living A, health & safety A; Watch: employment C-, amenities F, commute F.
- Sarasota (urban): math 63% / reading 63% proficiency, ranked #7 of 73 in FL (top 10%) — acceptable for families but not a draw, mixed tenant base, ~2y average lease.
- Zoned schools: Englewood Elementary School (math 65% / reading 66%, grade B+, #500 of 2,144 statewide, top 24%, 587 students, 52% FRL).
- Market conditions: Rents rising fast (+9.0%/yr); 717 active listings in the ZIP; 9 comparable units currently listed for rent nearby; rentals at typical pace (median 21d on market — plan ~3-4 weeks tenant-placement turnaround); solid renter incomes; 7,466 units permitted in Sarasota County in 2024 (2,138 in 5+ unit buildings).
- At $3,122/mo this rent would consume 49% of the median local household income ($76k/yr) (locally 290% of renters already pay >50% of income on rent) — very limited rent-growth headroom before tenants either downsize or default.
Forward outlook
- Local home prices are declining (-3.0%/yr); year-one equity from $1k of loan paydown is wiped out by about $5k of value loss. Plan a longer hold.
- Sarasota County population projected at +20% by 2050 — long-run rental-demand tailwind backs the buy-and-hold thesis.
- At projected returns (-3.0% appreciation + 8.0% rent growth), your $49k cash investment doubles in ~9 years — after that, you're playing with house money.
Negotiation context
- Only 2 days on market — expect competitive offers; lowballing is unlikely to land.
- 2 sale attempts since 19y ago with the ask held roughly flat each time — persistent listings suggest the price (not the market) is what's stuck; bring a comps-based counter.
- Current owner paid $111k; list at $175k implies a 58% gain — meaningful room to come down on a strong offer.
Risks & watch-outs
- Watch-outs: flood insurance adds $427/mo; HOA is 24% of rent.
- Climate carrying-cost: in FEMA flood zone AE (mandatory federal flood insurance); severe wind risk, 99% chance of damaging wind over 30y; extreme-heat days projected 7→28/yr by 2055 (HVAC capex compounding) — expect insurance premiums to compound above CPI over the hold.
Questions for the listing agent
- What's the actual annual flood-insurance premium (NFIP or private), and is the property in a SFHA with mandatory coverage?
- What does the HOA fee cover, when was the last increase, and are there any pending special assessments or reserve-fund shortfalls?
- Any open or pending special assessments — roof, HVAC, plumbing, elevator, façade? What's the per-unit balance and payoff schedule, and is the seller paying it off at close or rolling it to the buyer?
- Is there a deadline driving the sale (1031 exchange, divorce, estate, relocation)? That informs how much negotiation room exists.
- Schools are A-rated — typically a magnet for longer-tenancy family renters. What's the average tenant stay here, and is there a school-zone premium baked into asking?
- What's the average days-on-market for RENTAL listings here right now (not sales)? A rising rental-DOM trend means longer vacancies and softer asking-rent achievability than the comps imply.
- What's the recent tenant-quality profile in this submarket — average credit score on applications, eviction rate, late-payment / NSF rate, and stable-employment percentage? A property-management company in the area should have these aggregated.
- How much new apartment / multifamily construction is in the pipeline within 1–3 miles? Heavy new supply (>2% of stock underway) typically softens rents 12–24 months out; light construction supports rent growth.
Investment metrics
- 1% rule
- 1.78% ✓
- Cap rate
- 9.81%
- Cash-on-cash
- 12.56%
- DSCR
- 1.56
- GRM
- 4.7
CMA / ARV
No comps found within radius.
Projected returns pro-forma
-3.0% appreciation · 8.0% rent growth · sell at horizon
- IRR
- -2.8%
- Equity multiple
- 0.89×
- Total profit
- $-5,595
- Equity at exit
- $26,093
- IRR
- 14.6%
- Equity multiple
- 2.64×
- Total profit
- $80,423
- Equity at exit
- $15,131
Cash invested: $49,000 (down + closing). Projections, not guarantees.
Landlord ↔ Tenant lean methodology
- Overall (STATE)
- 87 Strongly Landlord-Friendly
- State Florida
- 87 Strongly Landlord-Friendly · R+3
- County
- — inherits STATE
- City
- — inherits STATE
ZIP-level market 34223
- Home prices YoY
- -34.2%
- Rents YoY
- 9.0%
- Active inventory
- 717
- Price-to-rent
- 4.7×
Monthly cashflow live
- Estimated rent
- $3,122 high interval (Pro) →
- Mortgage (P&I)
- −$918
- Tax from tax record
- −$222 /mo · $2,667/yr
- Insurance
- −$73
- Flood insurance flood zone
- −$427 /mo · $5,118/yr
- HOA
- −$741
- Vacancy / Maint / Mgmt
- −$656
- Net cashflow
- $86
Break-even live
UW: 25.0% down · 7.5% · 30yr · 1.5% tax · 5.0% vac · 8.0% maint · 8.0% mgmt
Financing live
Cash to close
- Down payment
- $43,750
- Closing costs
- $5,250
- Reserves months
- —
- Total cash needed
- —
Loan-product check · same deal, 3 products live
Conventional
25% down · 7.5% · 30yr
- Down + closing
- —
- Monthly P&I
- —
- Monthly cashflow
- —
- DSCR
- —
- Eligible?
- —
Personal DTI + credit; lowest rate.
DSCR
20% down · 8.5% · 30yr
- Down + closing
- —
- Monthly P&I
- —
- Monthly cashflow
- —
- DSCR
- —
- Eligible?
- —
No personal income docs; deal must DSCR.
Hard money
10% down · 12.0% · 12mo
- Down + closing
- —
- Monthly P&I
- —
- Monthly cashflow
- —
- DSCR
- —
- Eligible?
- —
Short-term bridge; refi at stabilization.
Rent comps 9 comps
| Address | Beds | Baths | Sqft | Rent | $/sqft | DOM | Units | Dist |
|---|---|---|---|---|---|---|---|---|
| 1210 S Maryknoll Rd Englewood, FL | 2.0 | 2.0 | 1063 | $2,600 | $2.45 | 21d | 1 | 0.71mi |
| 1575 Loralin Dr Englewood, FL | 3.0 | 2.0 | 1322 | $5,000 | $3.78 | 21d | 1 | 0.82mi |
| 1401 S McCall Rd Unit 301A Englewood, FL | 2.0 | 2.0 | 1093 | $3,300 | $3.02 | 21d | 1 | 0.82mi |
| 1501 Helene Ave Englewood, FL | 3.0 | 2.0 | 1608 | $3,200 | $1.99 | 13d | 1 | 0.85mi |
| 858 E 7th St Englewood, FL | 3.0 | 2.0 | 1244 | $1,995 | $1.60 | 21d | 1 | 0.94mi |
| 1375 Beach Rd #311 Englewood, FL | 3.0 | 2.0 | 1686 | $4,950 | $2.94 | 21d | 1 | 1.16mi |
| 1120 Lampp Dr Englewood, FL | 3.0 | 2.0 | 1212 | $4,000 | $3.30 | 21d | 1 | 1.19mi |
| 1531 Placida Rd #204 Englewood, FL | 2.0 | 2.0 | 1056 | $3,500 | $3.31 | 21d | 1 | 1.29mi |
| 1531 Placida Rd #203 Englewood, FL | 2.0 | 2.0 | 1056 | $3,900 | $3.69 | 21d | 1 | 1.29mi |
HOA detail condo
- Monthly dues
- $741 · $8,892/yr
- Assessments
- None detected in remarks — confirm with the listing agent.
Listing history 3 events
-
2026-06-18days on market $175,000 Active 2 DOM
-
2026-06-16remarks 699-char remark
-
2026-06-16$175,000 Active 1 DOM
ⓘ Source: listings_history table (triggers on properties + properties_extension) + one-shot
backfill from property_details.listing_events for pre-trigger history.
Tax reassessment forecast FL · Resets to sale price
- Current annual tax
- $2,667 · $222/mo
- Projected year-2 tax
- $2,667 · $222/mo
- Expected delta
- $0/yr ($0/mo · 0.0%)
ⓘ Screening estimate from a state-policy table — verify with the county assessor before closing.
Climate risk First Street
- Flood 7/10 Severe FEMA zone AE · 87% chance over 30 yrs
- Wildfire 1/10 Low
- Heat 10/10 Extreme 7 d/yr ≥107°F today · 28 d/yr by 30 yrs out
- Wind 10/10 Extreme 99% chance of damaging wind over 30 yrs
- Air quality 2/10 Low 1 unhealthy d/yr today · 1 by 30 yrs out
Nearby sold comps map
Loading sold comps map…
Walkable amenities ~0.75 mi
Loading nearby amenities…
Taxation est. · year 1
- Rental income
- $37,469
- − Mortgage interest
- −$9,803
- − Property taxes
- −$2,667
- − Insurance
- −$5,994
- − Repairs & maintenance
- −$2,998
- − Management
- −$2,998
- − HOA
- −$8,892
- − Depreciation
- −$5,091
- Taxable loss
- −$972
- Est. tax savings @ 24.0%
- +$233
- After-tax cash flow
- $1,269/yr
For passive investors: Depreciation is non-cash, so a rental often shows a tax loss while cash-flowing — sheltering income. Rental losses are passive: they offset passive income freely, and up to $25,000/yr can offset ordinary (W-2) income if you actively participate and your MAGI is under $100k (phasing out to $0 by $150k); unused losses carry forward. On sale, claimed depreciation is recaptured at up to 25%, and gains may owe capital-gains tax (a 1031 exchange can defer both). Figures are a year-1 estimate at your 24.0% rate — not tax advice; consult a CPA.
Schools (NCES district)
- District
- Sarasota
- NCES district ID
- 1201680
- Math proficiency
- 63% ▼ -8.00%
- Reading proficiency
- 63% ▼ -3.00%
- Median HH income
- $51,167
- Composite
- 53.68/100
- National rank
- #1428
- State rank
- #7 of 73 in FL
Livability — Englewood
- Score
- 73/100
- State rank
- #321
- US rank
- #5655
Category grades
Schools grade is shown separately in the Schools card above.
Census & demographics
- Census place
- Englewood, FL
- County
- Sarasota County · 448,376 people
- City population
- 35,420
- Metro
- North Port-Sarasota-Bradenton, FL
- Population (ZIP)
- 19,884
- Household income
- $76,016
- Rent vs Own
- Severe rent burden
- 290.0
Population outlook (Sarasota County) Hauer SSP2
- Today (2025)
- 452,380 people
- By 2030
- 474,175 · +4.8%
- By 2040
- 511,577 · +13.1%
- By 2050
- 541,467 · +19.7%
- By 2075
- 604,947 · +33.7%
- By 2100
- 621,965 · +37.5%
Race, ethnicity, and origin ACS 2023
- Neighborhood character
- Predominantly White (94%)
- Race & ethnicity
- White 94% Two or more races 3% Hispanic / Latino 3% Asian 1%
- Common ancestry
- Romanian 7% Lithuanian 4% Iranian 2%
- Foreign-born
- 9% · Canada
- Languages at home
- 94% English-only · German/W. Germanic 2% Spanish 1% Other Indo-European 1%
Political lean MEDSL · Sarasota
- 2024 margin
- R (+18.2) · D 40.5% · R 58.7%
- 2008→2024 swing
- -18.1pp toward R · 2008: -0.1pp · 2024: -18.2pp
- All cycles
- 2024: R+18.2 2020: R+10.4 2016: R+11.6 2012: R+7.4 2008: R+0.1
Not yet ingested
- Civics
- —
Market trends
- HPI YoY
- ▼ -146.26%
- Current HPI
- 281.0529
- Rent YoY
- ▲ 9.02%
- Metro
- North Port-Sarasota-Bradenton, FL
- State GDP YoY
- ▲ 3.28%
- F500 in state
- 36
Industry mix (Fortune 500 HQ in FL)
| Industry | F500 HQs | Revenue |
|---|---|---|
| Industrial Technology | 2 | $29B |
|
||
| Insurance | 2 | $17B |
|
||
| Retail | 1 | $60B |
|
||
| Technology Distribution | 1 | $58B |
|
||
| Homebuilding | 1 | $35B |
|
||
| Technology Manufacturing | 1 | $35B |
|
||
Price history
+354.5% since first listed6 events — show timeline
- 2026-06-16 Listed $175,000 Stellar MLS as Distributed by MLS Grid
- 2008-11-03 Sold (Public Records) $111,000 Public Records
- 2008-09-18 Listing Removed — Stellar MLS as Distributed by MLS Grid
- 2007-09-05 Listed $115,000 Stellar MLS as Distributed by MLS Grid
- 2002-08-22 Sold (Public Records) $85,000 Public Records
- 1993-12-23 Sold (Public Records) $38,500 Public Records
Property tax history
+5.6%/yrLatest (2025): $2,667 · -7.8% YoY. Source: county tax records.
Cash-flow waterfall
monthlySold comps — $/sqft
last 12 mo · ≤1 miLoading sold comps…