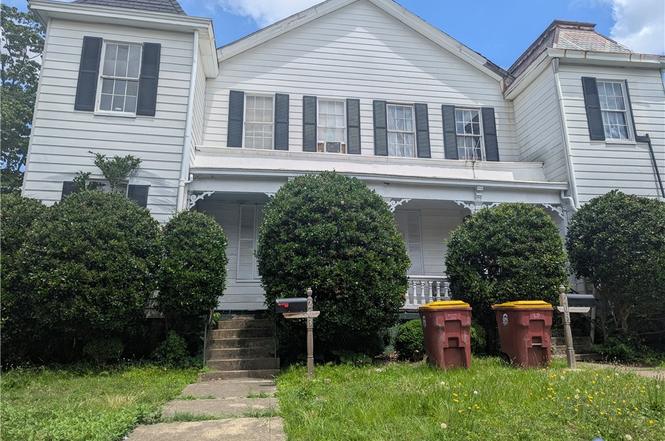
203 S Jefferson St · Petersburg, VA
Flood risk 1/10 · Minimal
- FEMA flood zone
- X (unshaded)
- Chance of flooding over 30 yrs
- 0.0%
- Est. flood insurance / yr
- $473 – $860
Fire risk 2/10 · Minimal
- Est. fire insurance / yr
- $666 – $1,236
Heat risk 8/10 · Major
- Hot days now (above 109°F)
- 7 days/yr
- Hot days in 30 yrs
- 16 days/yr
Wind risk 6/10 · Moderate
- Chance of severe wind over 30 yrs
- 42.0%
Air-quality risk 2/10 · Minimal
- Unhealthy air days now
- 0 days/yr
- Unhealthy air days in 30 yrs
- 1 days/yr
Risk factors via First Street. Map © Google.
Why this score? — see what drove the C+ grade
The composite is a weighted blend of 9 inputs, each scored 0–100. Each bar is that input's sub-score; the figure is the points it added to the 100-point composite (weight × sub-score).
- Cash flow +17.5/30.0
- ARV discount +15.0/15.0
- Appreciation +5.7/10.0
- DSCR +5.5/10.0
- 1% rule +4.2/10.0
- Rent growth +4.0/5.0
- Livability +3.1/5.0
- Schools +2.9/10.0
- Condition / age +2.5/5.0
$170,000
🖨 Deal sheet 📄 Offer letter ✓ Due diligence
Listing remarks MLS
Price reduced $15000.00 9/25/2013 on this claasic 1860's, possibly earlier, Victorian historic home located in the Poplar Lawn Historic District. Completely renovated and move in ready. Located on a corner lot with a culdesac side street. Nice backyard. This is a double house and the other side is also for sale. That side is a total rehab. Live in this side and renovate the other side. Home is located a short walk to Poplar Lawn City Park and the side street is the historic Marshall Street with many restored historic homes. A great friendly neighborhood. Must see to fully appreciate.
Key facts
- 5,519 sq ft lot
- 2 garage spots
- Built 1860
Neighborhood map
What this means for you Summary
Snapshot
- This is a 3-bed/2.0-bath single-family listed at $170k.
Deal economics
- At list price, monthly cash flow is $132 ($2k/yr) — positive.
- The deal already cash-flows at list — no discount required.
- To meet the 1% rule (rent ≥ 1% of price), the offer needs to be $157k (7.6% below list).
- Recommended offer: $157k (7.6% below list) — sets the bar for 1% rule.
- Cap rate 7.2% vs local median 4.5% in Petersburg — top-decile yield for the area; either an underpriced asset or a hidden risk that comps aren't pricing in. Stress-test before assuming the spread holds.
Location & tenants
- Location reads 61/100 on livability (#413 in VA) — a middle-class / working-renter tenant base. Strengths: cost of living A+, housing A; Watch: schools D+, crime F, amenities F.
- Petersburg City Public School District (suburban): math 26% / reading 44% proficiency, ranked #131 of 131 in VA (top 100%) — families likely to look elsewhere, expect single-tenant / working-renter base with shorter leases; 79% free/reduced lunch — lower-income household profile, screen leases tightly.
- Market conditions: Rents rising fast (+5.9%/yr); 290 active listings in the ZIP; 9 comparable units currently listed for rent nearby; rentals at typical pace (median 24d on market — plan ~3-4 weeks tenant-placement turnaround); 118 units permitted in Petersburg city in 2024 (84 in 5+ unit buildings).
Forward outlook
- In year one you build about $4k of equity ($1k loan paydown + $2k appreciation (1.4% local appreciation)).
- Petersburg County population projected at -10% by 2050 — secular population decline; favor cash flow + early exit over multi-decade hold.
- At projected returns (1.4% appreciation + 5.9% rent growth), your $48k cash investment doubles in ~7 years — after that, you're playing with house money.
- By year 9, paydown + projected appreciation supports a ~$32k cash-out refi (75% LTV) — recoverable capital for the next deal without selling this one.
Negotiation context
- It's been on market 22 days — a 2% lower offer ($167k) is reasonable based on typical stale-listing flexibility.
- 17 sale attempts since 23y ago with the ask held roughly flat each time — persistent listings suggest the price (not the market) is what's stuck; bring a comps-based counter.
- Current owner paid $87k; list at $170k implies a 95% gain — meaningful room to come down on a strong offer.
Risks & watch-outs
- Watch-outs: built in 1860 — expect roof / HVAC / electrical / plumbing capex.
- Climate carrying-cost: major wind risk, 42% chance of damaging wind over 30y; extreme-heat days projected 7→16/yr by 2055 (HVAC capex compounding) — expect insurance premiums to compound above CPI over the hold.
Questions for the listing agent
- Built in 1860 — when were the roof, HVAC, electrical panel, plumbing, and water heater last replaced?
- Is there a deadline driving the sale (1031 exchange, divorce, estate, relocation)? That informs how much negotiation room exists.
- Schools are D-rated, which usually means shorter tenancies and higher turnover. Who's the typical renter profile here, and what's been the actual vacancy rate?
- Crime grade is F in this area — have there been break-ins, vandalism, or insurance claims at this property in the last 3 years? What carrier currently insures it and at what premium?
- What's the average days-on-market for RENTAL listings here right now (not sales)? A rising rental-DOM trend means longer vacancies and softer asking-rent achievability than the comps imply.
- What's the recent tenant-quality profile in this submarket — average credit score on applications, eviction rate, late-payment / NSF rate, and stable-employment percentage? A property-management company in the area should have these aggregated.
- How much new for-sale + rental construction is in the pipeline within 1–3 miles? Heavy new supply typically softens prices + rents 12–24 months out; constrained supply supports both.
Investment metrics
- 1% rule
- 0.92% ✗
- Cap rate
- 7.22%
- Cash-on-cash
- 3.33%
- DSCR
- 1.15
- GRM
- 9.0
CMA / ARV
- ARV (on-the-fly)
- $332,940
- Comps found
- 12
Show comp detail 12 sales within ~0.75 mi
| Address | Dist | Beds/Ba | Sqft | Sold | Price | $/sf | Match |
|---|---|---|---|---|---|---|---|
| 328 Saint Andrew St | 0.19mi | 4/2.5 (+1) | 2,260 (+5%) | 2mo | $180,000 | $80 | 74 |
| 6 S Old Church St | 0.58mi | 3/2.5 | 2,100 (-2%) | 4mo | $280,000 | $133 | 64 |
| 510 Byrne St | 0.55mi | 4/2.5 (+1) | 2,296 (+7%) | 3mo | $275,000 | $120 | 54 |
| 131 Franklin St | 0.29mi | 4/4.5 (+1) | 2,360 (+10%) | 5mo | $425,000 | $180 | 51 |
| 243 High St | 0.67mi | 3/1.5 | 1,968 (-8%) | 2mo | $262,000 | $133 | 51 |
| 104 Center St | 0.74mi | 4/3.0 (+1) | 2,200 (+2%) | 4mo | $339,900 | $155 | 49 |
| 724 E Wythe St | 0.56mi | 4/3.0 (+1) | 1,904 (-11%) | 0mo | $300,000 | $158 | 46 |
| 731 Harding St | 0.73mi | 4/3.5 (+1) | 2,000 (-7%) | 3mo | $315,000 | $158 | 41 |
| 104 St Matthew St | 0.72mi | 4/1.0 (+1) | 2,328 (+8%) | 3mo | $75,000 | $32 | 41 |
| 710 Harding St | 0.71mi | 4/3.5 (+1) | 2,000 (-7%) | 6mo | $314,900 | $157 | 40 |
| 123 S Old Church St | 0.63mi | 4/3.5 (+1) | 1,840 (-14%) | 5mo | $300,000 | $163 | 31 |
| 307 Mistletoe St | 0.69mi | 4/3.5 (+1) | 1,860 (-13%) | 4mo | $285,000 | $153 | 31 |
Match score weights: distance 35% · size 25% · config 20% · recency 20%. Top-matched comps best support the ARV.
Projected returns pro-forma
1.45% appreciation · 5.89% rent growth · sell at horizon
- IRR
- 7.9%
- Equity multiple
- 1.42×
- Total profit
- $20,028
- Equity at exit
- $62,040
- IRR
- 13.2%
- Equity multiple
- 2.79×
- Total profit
- $85,305
- Equity at exit
- $85,635
Cash invested: $47,600 (down + closing). Projections, not guarantees.
Landlord ↔ Tenant lean methodology
- Overall (STATE)
- 55 Moderately Landlord-Leaning
- State Virginia
- 55 Moderately Landlord-Leaning · D+2
- County
- — inherits STATE
- City
- — inherits STATE
ZIP-level market 23803
- Home prices YoY
- 0.3%
- Rents YoY
- 5.9%
- Active inventory
- 290
- Price-to-rent
- 9.0×
Monthly cashflow live
- Estimated rent
- $1,571 high interval (Pro) →
- Mortgage (P&I)
- −$891
- Tax from tax record
- −$147 /mo · $1,763/yr
- Insurance
- −$71
- HOA
- −$0
- Vacancy / Maint / Mgmt
- −$330
- Net cashflow
- $132
Break-even live
UW: 25.0% down · 7.5% · 30yr · 1.5% tax · 5.0% vac · 8.0% maint · 8.0% mgmt
Financing live
Cash to close
- Down payment
- $42,500
- Closing costs
- $5,100
- Reserves months
- —
- Total cash needed
- —
Loan-product check · same deal, 3 products live
Conventional
25% down · 7.5% · 30yr
- Down + closing
- —
- Monthly P&I
- —
- Monthly cashflow
- —
- DSCR
- —
- Eligible?
- —
Personal DTI + credit; lowest rate.
DSCR
20% down · 8.5% · 30yr
- Down + closing
- —
- Monthly P&I
- —
- Monthly cashflow
- —
- DSCR
- —
- Eligible?
- —
No personal income docs; deal must DSCR.
Hard money
10% down · 12.0% · 12mo
- Down + closing
- —
- Monthly P&I
- —
- Monthly cashflow
- —
- DSCR
- —
- Eligible?
- —
Short-term bridge; refi at stabilization.
Rent comps 9 comps
| Address | Beds | Baths | Sqft | Rent | $/sqft | DOM | Units | Dist |
|---|---|---|---|---|---|---|---|---|
| 212 E Wythe St Unit 1 Petersburg, VA | 4.0 | 1.5 | 1400 | $1,295 | $0.93 | 23d | 1 | 0.07mi |
| 212 E Wythe St Unit 1 Petersburg, VA | 4.0 | 1.5 | 1400 | $1,295 | $0.93 | 43d | 1 | 0.07mi |
| 616 S Jefferson St Petersburg, VA | 3.0 | 2.0 | 2400 | $1,957 | $0.82 | 3d | 1 | 0.50mi |
| 462 Reservoir Hts Petersburg, VA | 4.0 | 2.0 | 1640 | $1,895 | $1.16 | 23d | 1 | 0.64mi |
| 115 Pine St Unit 115 Petersburg, VA | 3.0 | 1.5 | 1400 | $1,462 | $1.04 | 43d | 1 | 0.78mi |
| 531 N Azalea Rd Petersburg, VA | 3.0 | 2.0 | 1600 | $1,595 | $1.00 | 23d | 1 | 0.95mi |
| 211 Jefferson Ave Colonial Heights, VA | 4.0 | 2.0 | 1507 | $1,900 | $1.26 | 1d | 1 | 1.04mi |
| 1137 Willcox St Petersburg, VA | 4.0 | 3.0 | 1872 | $2,600 | $1.39 | 43d | 1 | 1.25mi |
| 335 Claremont St Petersburg, VA | 4.0 | 2.0 | 2157 | $2,500 | $1.16 | 11d | 1 | 1.33mi |
Listing history 38 events
-
2025-10-22status Pending
-
2025-10-01$170,000 Active
-
2015-03-31soldstatus $87,000
-
2015-03-30soldstatus $87,000 Closed 591-char remark
Show marketing remark (591 chars)
Price reduced $15000.00 9/25/2013 on this claasic 1860's, possibly earlier, Victorian historic home located in the Poplar Lawn Historic District. Completely renovated and move in ready. Located on a corner lot with a culdesac side street. Nice backyard. This is a double house and the other side is also for sale. That side is a total rehab. Live in this side and renovate the other side. Home is located a short walk to Poplar Lawn City Park and the side street is the historic Marshall Street with many restored historic homes. A great friendly neighborhood. Must see to fully appreciate.
-
2015-03-06status Pending 591-char remark
Show marketing remark (591 chars)
Price reduced $15000.00 9/25/2013 on this claasic 1860's, possibly earlier, Victorian historic home located in the Poplar Lawn Historic District. Completely renovated and move in ready. Located on a corner lot with a culdesac side street. Nice backyard. This is a double house and the other side is also for sale. That side is a total rehab. Live in this side and renovate the other side. Home is located a short walk to Poplar Lawn City Park and the side street is the historic Marshall Street with many restored historic homes. A great friendly neighborhood. Must see to fully appreciate.
-
2014-12-30price $89,900 591-char remark
Show marketing remark (591 chars)
Price reduced $15000.00 9/25/2013 on this claasic 1860's, possibly earlier, Victorian historic home located in the Poplar Lawn Historic District. Completely renovated and move in ready. Located on a corner lot with a culdesac side street. Nice backyard. This is a double house and the other side is also for sale. That side is a total rehab. Live in this side and renovate the other side. Home is located a short walk to Poplar Lawn City Park and the side street is the historic Marshall Street with many restored historic homes. A great friendly neighborhood. Must see to fully appreciate.
-
2013-03-18$97,900 Active 591-char remark
Show marketing remark (591 chars)
Price reduced $15000.00 9/25/2013 on this claasic 1860's, possibly earlier, Victorian historic home located in the Poplar Lawn Historic District. Completely renovated and move in ready. Located on a corner lot with a culdesac side street. Nice backyard. This is a double house and the other side is also for sale. That side is a total rehab. Live in this side and renovate the other side. Home is located a short walk to Poplar Lawn City Park and the side street is the historic Marshall Street with many restored historic homes. A great friendly neighborhood. Must see to fully appreciate.
-
2009-09-22historical
-
2009-09-22historical
-
2008-08-31historical
-
2008-05-12historical
-
2008-05-12historical
-
2008-05-05$179,500
-
2008-05-05$179,500
-
2008-03-25$205,000
-
2008-03-25$205,000
-
2007-08-31historical
-
2007-06-29historical
-
2007-06-29$185,000
-
2007-04-02$185,000
-
2007-04-02$185,000
-
2004-01-15soldstatus $70,000
-
2004-01-15soldstatus $70,000
-
2004-01-15soldstatus $70,000
-
2003-12-11$79,500
-
2003-12-11$79,500
-
2003-12-10historical
-
2003-09-11historical
-
2003-09-10$79,500
-
2003-09-10historical
-
2003-09-10$79,500
-
2003-09-10historical
-
2003-08-22$79,500
-
2003-08-22$79,500
-
2003-07-20historical
-
2003-06-09historical
-
2003-03-20$79,500
-
2003-03-20$79,500
ⓘ Source: listings_history table (triggers on properties + properties_extension) + one-shot
backfill from property_details.listing_events for pre-trigger history.
Tax reassessment forecast VA · Resets to sale price
- Current annual tax
- $1,763 · $147/mo
- Projected year-2 tax
- $1,763 · $147/mo
- Expected delta
- $0/yr ($0/mo · 0.0%)
ⓘ Screening estimate from a state-policy table — verify with the county assessor before closing.
Climate risk First Street
- Flood 1/10 Low FEMA zone X (unshaded) · 0% chance over 30 yrs
- Wildfire 2/10 Low
- Heat 8/10 Severe 7 d/yr ≥109°F today · 16 d/yr by 30 yrs out
- Wind 6/10 Major 42% chance of damaging wind over 30 yrs
- Air quality 2/10 Low 0 unhealthy d/yr today · 1 by 30 yrs out
Nearby sold comps map
Loading sold comps map…
Walkable amenities ~0.75 mi
Loading nearby amenities…
Taxation est. · year 1
- Rental income
- $18,853
- − Mortgage interest
- −$9,523
- − Property taxes
- −$1,763
- − Insurance
- −$850
- − Repairs & maintenance
- −$1,508
- − Management
- −$1,508
- − Depreciation
- −$4,945
- Taxable loss
- −$1,245
- Est. tax savings @ 24.0%
- +$299
- After-tax cash flow
- $1,882/yr
For passive investors: Depreciation is non-cash, so a rental often shows a tax loss while cash-flowing — sheltering income. Rental losses are passive: they offset passive income freely, and up to $25,000/yr can offset ordinary (W-2) income if you actively participate and your MAGI is under $100k (phasing out to $0 by $150k); unused losses carry forward. On sale, claimed depreciation is recaptured at up to 25%, and gains may owe capital-gains tax (a 1031 exchange can defer both). Figures are a year-1 estimate at your 24.0% rate — not tax advice; consult a CPA.
Schools (NCES district)
- District
- Petersburg City Public School District
- NCES district ID
- 5102910
- Math proficiency
- 26% ▼ -27.00%
- Reading proficiency
- 44% ▼ -8.00%
- Median HH income
- $34,362
- Composite
- 28.78/100
- National rank
- #6670
- State rank
- #131 of 131 in VA
Livability — Petersburg
- Score
- 61/100
- State rank
- #413
- US rank
- #17309
Category grades
Schools grade is shown separately in the Schools card above.
Census & demographics
- Census place
- Petersburg, VA
- County
- Chesterfield County · 406,988 people
- City population
- 63,420
- Metro
- Richmond, VA
- Population (ZIP)
- 42,012
- Household income
- $57,813
- Rent vs Own
- Severe rent burden
- 2485.0
Population outlook (Petersburg County) Hauer SSP2
- Today (2025)
- 30,488 people
- By 2030
- 29,771 · -2.4%
- By 2040
- 28,401 · -6.8%
- By 2050
- 27,279 · -10.5%
- By 2075
- 25,877 · -15.1%
- By 2100
- 24,288 · -20.3%
Race, ethnicity, and origin ACS 2023
- Neighborhood character
- Diverse neighborhood (Simpson 0.57)
- Race & ethnicity
- Black 58% White 31% Hispanic / Latino 6% Two or more races 5%
- Hispanic origin (detail)
- Mexican 1% Puerto Rican 2%
- Common ancestry
- Italian 1% Romanian 1% Slovak 1%
- Foreign-born
- 4% · Canada
- Languages at home
- 93% English-only · Spanish 5%
Political lean MEDSL · Petersburg
- 2024 margin
- Solid D (+72.8) · D 85.8% · R 13.0% · Other 1.2%
- 2008→2024 swing
- -5.7pp toward R · 2008: 78.5pp · 2024: 72.8pp
- All cycles
- 2024: D+72.8 2020: D+76.5 2016: D+77.0 2012: D+80.4 2008: D+78.5
Not yet ingested
- Civics
- —
Market trends
- HPI YoY
- ▲ 1.45%
- Current HPI
- 480.5365
- Rent YoY
- ▲ 5.89%
- Metro
- Richmond, VA
- State GDP YoY
- ▲ 2.40%
- F500 in state
- 50
Industry mix (Fortune 500 HQ in VA)
| Industry | F500 HQs | Revenue |
|---|---|---|
| Aerospace / Defense | 4 | $236B |
|
||
| Technology / Defense | 3 | $32B |
|
||
| Financial Services | 2 | $176B |
|
||
| Utilities | 2 | $27B |
|
||
| Insurance | 2 | $25B |
|
||
| Technology | 2 | $15B |
|
||
Price history
+113.8% since first listed38 events — show timeline
- 2025-10-22 Pending — CVRMLS
- 2025-10-01 Listed $170,000 CVRMLS
- 2015-03-31 Sold (Public Records) $87,000 Public Records
- 2015-03-30 Sold (MLS) $87,000 CVRMLS
- 2015-03-06 Pending — CVRMLS
- 2014-12-30 Price Changed $89,900 CVRMLS
- 2013-03-18 Listed $97,900 CVRMLS
- 2009-09-22 Listing Removed — CVRMLS
- 2009-09-22 Listing Removed — CVRMLS
- 2008-08-31 Listing Removed — CVRMLS
- 2008-05-12 Listing Removed — CVRMLS
- 2008-05-12 Listing Removed — CVRMLS
- 2008-05-05 Listed $179,500 CVRMLS
- 2008-05-05 Listed $179,500 CVRMLS
- 2008-03-25 Listed $205,000 CVRMLS
- 2008-03-25 Listed $205,000 CVRMLS
- 2007-08-31 Listing Removed — CVRMLS
- 2007-06-29 Listed $185,000 CVRMLS
- 2007-06-29 Listing Removed — CVRMLS
- 2007-04-02 Listed $185,000 CVRMLS
- 2007-04-02 Listed $185,000 CVRMLS
- 2004-01-15 Sold (Public Records) $70,000 Public Records
- 2004-01-15 Sold (MLS) $70,000 CVRMLS
- 2004-01-15 Sold (MLS) $70,000 CVRMLS
- 2003-12-11 Listed $79,500 CVRMLS
- 2003-12-11 Listed $79,500 CVRMLS
- 2003-12-10 Listing Removed — CVRMLS
- 2003-09-11 Listing Removed — CVRMLS
- 2003-09-10 Listing Removed — CVRMLS
- 2003-09-10 Listed $79,500 CVRMLS
- 2003-09-10 Listing Removed — CVRMLS
- 2003-09-10 Listed $79,500 CVRMLS
- 2003-08-22 Listed $79,500 CVRMLS
- 2003-08-22 Listed $79,500 CVRMLS
- 2003-07-20 Listing Removed — CVRMLS
- 2003-06-09 Listing Removed — CVRMLS
- 2003-03-20 Listed $79,500 CVRMLS
- 2003-03-20 Listed $79,500 CVRMLS
Property tax history
-1.4%/yrLatest (2025): $1,763 · +0.0% YoY. Source: county tax records.
Cash-flow waterfall
monthlySold comps — $/sqft
last 12 mo · ≤1 miLoading sold comps…