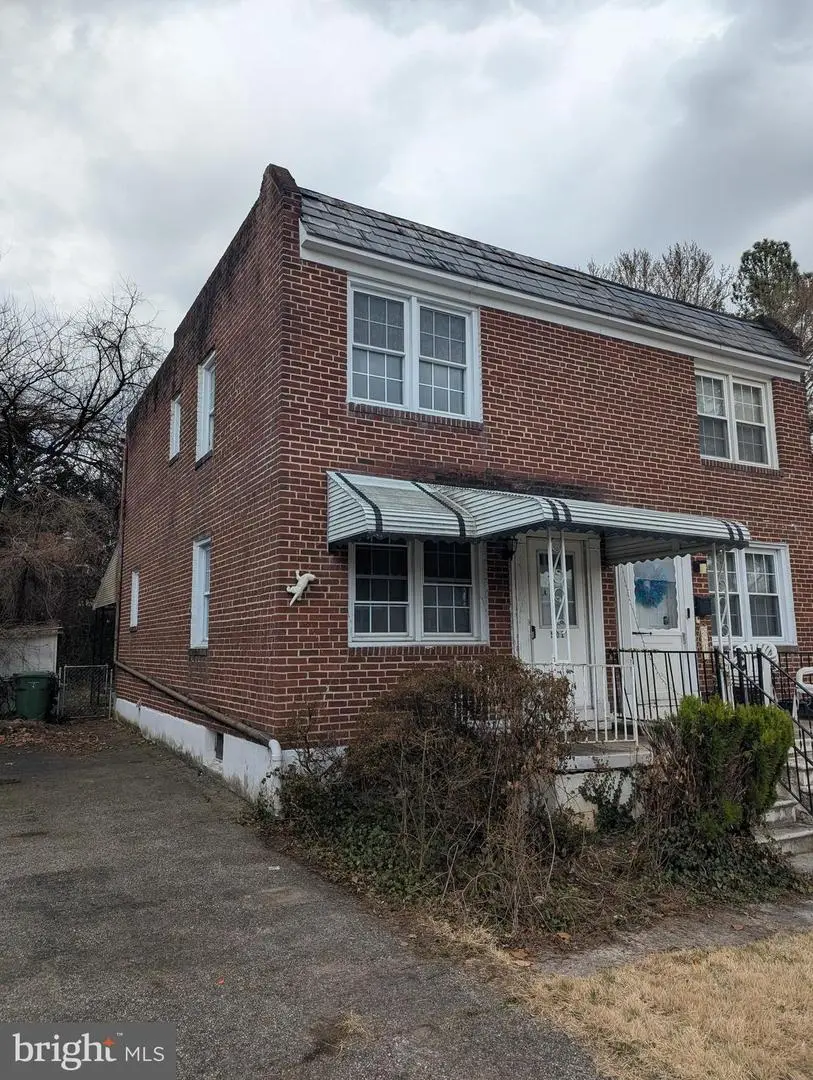
5619 Pioneer Dr · Baltimore, MD
Flood risk 1/10 · Minimal
- FEMA flood zone
- X (unshaded)
- Chance of flooding over 30 yrs
- 0.0%
- Est. flood insurance / yr
- $473 – $860
Fire risk 1/10 · Minimal
- Est. fire insurance / yr
- $755 – $1,403
Heat risk 7/10 · Major
- Hot days now (above 103°F)
- 7 days/yr
- Hot days in 30 yrs
- 15 days/yr
Wind risk 6/10 · Moderate
- Chance of severe wind over 30 yrs
- 27.0%
Air-quality risk 4/10 · Minor
- Unhealthy air days now
- 3 days/yr
- Unhealthy air days in 30 yrs
- 6 days/yr
Risk factors via First Street. Map © Google.
Why this score? — see what drove the B grade
The composite is a weighted blend of 9 inputs, each scored 0–100. Each bar is that input's sub-score; the figure is the points it added to the 100-point composite (weight × sub-score).
- Cash flow +30.0/30.0
- ARV discount +15.0/15.0
- 1% rule +10.0/10.0
- DSCR +10.0/10.0
- Livability +3.8/5.0
- Rent growth +2.5/5.0
- Condition / age +2.5/5.0
- Schools +1.0/10.0
- Appreciation +0.0/10.0
$105,000
🖨 Deal sheet (PDF) 📄 Offer letter ✓ Due diligence
Listing remarks MLS
$50,000. LIST PRICE SUGGESTED OPENING BID AT AUCTION. * * * * NO PRE BID * * * * AUCTION FRI, April 10th, 2026 @ 11:00 AM ON PREMISES. Broker/agent registration form is available upon request and must be in the hands of Jay Edwards Auctioneers 48 hours prior to the auction. Enter from front entrance to living room. Kitchen w/ dining area, gas stove, & exit to covered back porch. Coat closet. Upper level has bedroom’s #1 & 2 w/ ceiling fans closets, full bathroom, & hall closet. Attic access. Lower level has club room, washer, dryer, & exit to rear yard. Additional features include gas hot water, gas furnace, central air, & private fenced back yard. Public water & sewer. The property is subject to annual ground rent of $96.00 payable semi- annually on the 15th days of April and October.
Key facts
- Gas stove
- Central air
- Covered back porch
Tags
Neighborhood map
What this means for you Summary
Snapshot
- This is a 2-bed/1.0-bath townhouse listed at $105k.
Deal economics
- At list price, monthly cash flow is $488 ($6k/yr) — positive.
- The deal already cash-flows at list — no discount required.
- Meets the 1% rule at list price ($2k rent vs $105k).
- Recommended offer: $99k (6.0% below list) — sets the bar for market timing.
- Cap rate 11.9% vs local median 6.0% in Baltimore — top-decile yield for the area; either an underpriced asset or a hidden risk that comps aren't pricing in. Stress-test before assuming the spread holds.
Location & tenants
- Location reads 76/100 on livability (#90 in MD, #3,396 nationally) — a middle-class / working-renter tenant base. Strengths: amenities A+, commute A+, housing A+; Watch: schools D, crime F.
- Baltimore City Public Schools (urban): math 7% / reading 16% proficiency, ranked #24 of 24 in MD (top 100%) — low school quality limits family demand, transient renter base, plan for 1-2y turnover; 79% free/reduced lunch — lower-income household profile, screen leases tightly.
- Market conditions: 98 active listings in the ZIP; 40 comparable units currently listed for rent nearby; rentals at typical pace (median 25d on market — plan ~3-4 weeks tenant-placement turnaround); 48% of comp listings sitting > 30 days — soft ceiling on asking rent; solid renter incomes; 1,273 units permitted in Baltimore city in 2024 (1,104 in 5+ unit buildings).
Forward outlook
- Local home prices are declining (-3.0%/yr); year-one equity from $726 of loan paydown is wiped out by about $3k of value loss. Plan a longer hold.
- Baltimore County population projected to shrink 4% by 2050 — rents likely to lag national; underwrite the cash flow, not the appreciation.
- At projected returns (-3.0% appreciation + 3.0% rent growth), your $29k cash investment doubles in ~7 years — after that, you're playing with house money.
Negotiation context
- It's been on market 69 days — a 6% lower offer ($99k) is reasonable based on typical stale-listing flexibility.
- 2 sale attempts since 6y ago; this cycle's ask is 110% above the opening price — seller raised mid-cycle; expect resistance to lowballs.
- Current owner paid $75k; 40% above their basis — modest negotiation headroom, anchor on the comps not their cost.
Risks & watch-outs
- Watch-outs: built in 1953 — expect roof / HVAC / electrical / plumbing capex.
- Climate carrying-cost: major wind risk, 27% chance of damaging wind over 30y; extreme-heat days projected 7→15/yr by 2055 (HVAC capex compounding) — expect insurance premiums to compound above CPI over the hold.
Questions for the listing agent
- It's been on market 69 days. Have you received any prior offers? Is the seller open to a 6% concession, seller financing, or rate buy-down credit?
- Built in 1953 — when were the roof, HVAC, electrical panel, plumbing, and water heater last replaced?
- Why hasn't it sold? Are there any deal-killer items the seller is aware of (foundation, flood, title, zoning, code violations)?
- Is there a deadline driving the sale (1031 exchange, divorce, estate, relocation)? That informs how much negotiation room exists.
- Schools are D-rated, which usually means shorter tenancies and higher turnover. Who's the typical renter profile here, and what's been the actual vacancy rate?
- Crime grade is F in this area — have there been break-ins, vandalism, or insurance claims at this property in the last 3 years? What carrier currently insures it and at what premium?
- What's the average days-on-market for RENTAL listings here right now (not sales)? A rising rental-DOM trend means longer vacancies and softer asking-rent achievability than the comps imply.
- What's the recent tenant-quality profile in this submarket — average credit score on applications, eviction rate, late-payment / NSF rate, and stable-employment percentage? A property-management company in the area should have these aggregated.
- How much new for-sale + rental construction is in the pipeline within 1–3 miles? Heavy new supply typically softens prices + rents 12–24 months out; constrained supply supports both.
Investment metrics
- 1% rule
- 1.57% ✓
- Cap rate
- 11.87%
- Cash-on-cash
- 19.93%
- DSCR
- 1.89
- GRM
- 5.3
CMA / ARV
- ARV (median comp)
- $196,613
- List price
- $105,000
- Delta
- -46.60%
- Verdict
- UNDERPRICED
- Comps
- 20 within 1.0 mi
Show comp detail 12 sales within ~0.75 mi
| Address | Dist | Beds/Ba | Sqft | Sold | Price | $/sf | Match |
|---|---|---|---|---|---|---|---|
| 2210 Cloville Ave NE | 0.17mi | 3/1.5 (+1) | 1,024 (-9%) | 3mo | $226,650 | $221 | 68 |
| 5749 Edgepark Rd | 0.25mi | 3/1.5 (+1) | 1,140 (+2%) | 15mo | $190,000 | $167 | 66 |
| 5644 Pioneer Dr | 0.06mi | 2/2.0 | 1,232 (+10%) | 16mo | $205,000 | $166 | 63 |
| 6331 Pioneer Dr | 0.36mi | 3/1.5 (+1) | 1,050 (-6%) | 6mo | $185,000 | $176 | 61 |
| 1720 Wadsworth Way | 0.42mi | 3/1.0 (+1) | 1,064 (-5%) | 11mo | $160,100 | $150 | 58 |
| 6210 Pilgrim Rd | 0.22mi | 3/1.5 (+1) | 1,280 (+14%) | 2mo | $213,000 | $166 | 57 |
| 1930 Swansea Rd | 0.45mi | 3/2.0 (+1) | 1,178 (+5%) | 10mo | $285,000 | $242 | 53 |
| 2221 Walshire Ave | 0.33mi | 3/1.0 (+1) | 1,280 (+14%) | 6mo | $181,000 | $141 | 51 |
| 1649 Gleneagle Rd | 0.62mi | 3/1.0 (+1) | 1,064 (-5%) | 9mo | $200,000 | $188 | 50 |
| 1703 Swansea Rd | 0.56mi | 2/2.0 | 1,190 (+6%) | 12mo | $170,000 | $143 | 50 |
| 2403 Hermosa Ave | 0.68mi | 3/2.0 (+1) | 1,248 (+11%) | 0mo | $250,000 | $200 | 40 |
| 1700 Woodbourne Ave | 0.58mi | 2/2.0 | 1,277 (+14%) | 16mo | $210,000 | $164 | 32 |
Match score weights: distance 35% · size 25% · config 20% · recency 20%. Top-matched comps best support the ARV.
Projected returns pro-forma
-3.0% appreciation · 3.0% rent growth · sell at horizon
- IRR
- 12.1%
- Equity multiple
- 1.48×
- Total profit
- $14,159
- Equity at exit
- $15,656
- IRR
- 21.1%
- Equity multiple
- 2.79×
- Total profit
- $52,688
- Equity at exit
- $9,078
Cash invested: $29,400 (down + closing). Projections, not guarantees.
Landlord ↔ Tenant lean methodology
- Overall (CITY)
- 12 Strongly Tenant-Friendly
- State Maryland
- 27 Tenant-Leaning · D+14
- County
- — inherits STATE
- City Baltimore
- 12 Strongly Tenant-Friendly · D+58
ZIP-level market 21214
- Active inventory
- 98
- Price-to-rent
- 5.3×
Monthly cashflow live
- Estimated rent
- $1,647 high interval (Pro) →
- Mortgage (P&I)
- −$551
- Tax from tax record
- −$218 /mo · $2,619/yr
- Insurance
- −$44
- HOA
- −$0
- Vacancy / Maint / Mgmt
- −$346
- Net cashflow
- $488
Break-even live
Sensitivity live
| Price | -10% $548 | -5% $518 | +0% $488 | +5% $459 | +10% $429 |
|---|---|---|---|---|---|
| Rent | -10% $358 | -5% $423 | +0% $488 | +5% $553 | +10% $618 |
| Rate | -1.0pp $541 | -0.5pp $515 | base $488 | +0.5pp $461 | +1.0pp $433 |
UW: 25.0% down · 7.5% · 30yr · 1.5% tax · 5.0% vac · 8.0% maint · 8.0% mgmt
Financing live
Cash to close
- Down payment
- $26,250
- Closing costs
- $3,150
- Reserves months
- —
- Total cash needed
- —
Loan-product check · same deal, 3 products live
Conventional
25% down · 7.5% · 30yr
- Down + closing
- —
- Monthly P&I
- —
- Monthly cashflow
- —
- DSCR
- —
- Eligible?
- —
Personal DTI + credit; lowest rate.
DSCR
20% down · 8.5% · 30yr
- Down + closing
- —
- Monthly P&I
- —
- Monthly cashflow
- —
- DSCR
- —
- Eligible?
- —
No personal income docs; deal must DSCR.
Hard money
10% down · 12.0% · 12mo
- Down + closing
- —
- Monthly P&I
- —
- Monthly cashflow
- —
- DSCR
- —
- Eligible?
- —
Short-term bridge; refi at stabilization.
Rent comps 40 comps
| Address | Beds | Baths | Sqft | Rent | $/sqft | DOM | Units | Dist |
|---|---|---|---|---|---|---|---|---|
| 2106 Cloville Ave Baltimore, MD | 3.0 | 1.5 | 1080 | $1,700 | $1.57 | 44d | 1 | 0.18mi |
| 1806 Ramblewood Rd Apt A Baltimore, MD | 2.0 | 2.0 | 903 | $1,847 | $2.05 | 44d | 1 | 0.25mi |
| 6212 Laurelton Ave Baltimore, MD | 2.0 | 1.0 | 960 | $1,325 | $1.38 | 44d | 1 | 0.39mi |
| 1900 Ramblewood Rd Apt A Baltimore, MD | 2.0 | 2.0 | 903 | $1,847 | $2.05 | 44d | 1 | 0.39mi |
| 5600 Birchwood Ave Unit 2 Baltimore, MD | 2.0 | 1.0 | 850 | $1,600 | $1.88 | 44d | 1 | 0.39mi |
| 2077 Woodbourne Ave Baltimore, MD | 1.0–2.0 | 1.0 | 830 | $1,419 | $1.71 | 2d | 5 | 0.44mi |
| 2604 Hamilton Ave Apt 2 Baltimore, MD | 2.0 | 1.0 | 850 | $1,195 | $1.41 | 44d | 1 | 0.46mi |
| 1726 E Belvedere Ave Baltimore, MD | 3.0 | 2.0 | 1140 | $1,895 | $1.66 | 22d | 1 | 0.50mi |
| 6502 McClean Blvd Baltimore, MD | 2.0 | 1.0 | 925 | $1,537 | $1.66 | 44d | 1 | 0.56mi |
| 6502 McClean Blvd Unit 2207-A3 Baltimore, MD | 1.0 | 1.0 | 800 | $1,212 | $1.51 | 44d | 1 | 0.57mi |
| 6502 McClean Blvd Unit 2211-B3 Baltimore, MD | 2.0 | 1.0 | 925 | $1,495 | $1.62 | 22d | 1 | 0.57mi |
| 6624 Pioneer Dr Baltimore, MD | 1.0–3.0 | 1.0 | 706 | $1,266 | $1.79 | 44d | 1 | 0.58mi |
| 2804 Christopher Ave Baltimore, MD | 3.0 | 2.5 | 1280 | $2,200 | $1.72 | 24d | 1 | 0.60mi |
| 4902 Gilray Dr Baltimore, MD | 3.0 | 2.0 | 776 | $2,400 | $3.09 | 24d | 1 | 0.62mi |
| 6612 Birchwood Ave Baltimore, MD | 3.0 | 2.0 | 1122 | $2,300 | $2.05 | 20d | 1 | 0.71mi |
| 1712 Waverly Way Baltimore, MD | 1.0–2.0 | 1.0 | 675 | $1,520 | $2.25 | 2d | 5 | 0.72mi |
| 2423 Wellbridge Dr Baltimore, MD | 1.0–2.0 | 1.0 | 675 | $1,325 | $1.96 | 21d | 1 | 0.75mi |
| 2900 Ailsa Ave Apt 2 Baltimore, MD | 3.0 | 1.0 | 1300 | $1,750 | $1.35 | 5d | 1 | 0.81mi |
| 3014 Hamilton Ave Unit 1 Baltimore, MD | 2.0 | 1.0 | 850 | $1,575 | $1.85 | 24d | 1 | 0.82mi |
| 3033 Hamilton Ave Unit 1R Baltimore, MD | 2.0 | 1.0 | 720 | $1,195 | $1.66 | 5d | 1 | 0.83mi |
| 3021 Echodale Ave Unit 2 Baltimore, MD | 2.0 | 1.0 | 750 | $999 | $1.33 | 44d | 1 | 0.86mi |
| 6101 Loch Raven Blvd Baltimore, MD | 1.0–2.0 | 1.0–2.0 | 1138 | $2,318 | $2.04 | 3d | 8 | 0.90mi |
| 5664 Woodmont Ave Baltimore, MD | 1.0–2.0 | 1.0 | 710 | $1,175 | $1.65 | 4d | 10 | 1.04mi |
| 1408 Cedarcroft Rd Baltimore, MD | 3.0 | 2.0 | 912 | $1,957 | $2.15 | 44d | 1 | 1.05mi |
| 5307 Leith Rd Baltimore, MD | 2.0 | 1.0 | 630 | $1,350 | $2.14 | 13d | 1 | 1.06mi |
| 7202 Sindall Rd Unit 7202 Parkville, MD | 3.0 | 1.0 | 1350 | $1,850 | $1.37 | 44d | 1 | 1.07mi |
| 6405 Loch Crest Rd Idlewylde, MD | 3.0 | 2.5 | 1440 | $2,257 | $1.57 | 44d | 1 | 1.14mi |
| 5683 Purdue Ave Unit 5687-C5 Baltimore, MD | 1.0 | 1.0 | 917 | $1,000 | $1.09 | 4d | 1 | 1.15mi |
| 1629 Wentworth Ave Parkville, MD | 3.0 | 1.5 | 1152 | $1,895 | $1.64 | 44d | 1 | 1.18mi |
| 1652 E Cold Spring Ln Unit 2 Baltimore, MD | 2.0 | 1.0 | 700 | $1,500 | $2.14 | 24d | 1 | 1.19mi |
| 1610 Wentworth Ave Parkville, MD | 3.0 | 1.0 | 1024 | $1,900 | $1.86 | 44d | 1 | 1.20mi |
| 3309 Southern Ave Unit 2 Baltimore, MD | 2.0 | 1.0 | 1200 | $1,600 | $1.33 | 13d | 1 | 1.21mi |
| 3010 Woodring Ave Unit 2 Baltimore, MD | 2.0 | 1.0 | 900 | $1,600 | $1.78 | 44d | 1 | 1.25mi |
| 1129 Gleneagle Rd Unit B Baltimore, MD | 2.0 | 1.0 | 700 | $1,200 | $1.71 | 44d | 1 | 1.27mi |
| 6612 Wycombe Way Parkville, MD | 1.0–2.0 | 1.0 | 664 | $1,325 | $2.00 | 5d | 1 | 1.30mi |
| 1116 Gleneagle Rd Unit 1 Baltimore, MD | 2.0 | 1.0 | 726 | $1,695 | $2.33 | 5d | 1 | 1.30mi |
| 1116 Gleneagle Rd Unit 2 Baltimore, MD | 2.0 | 1.0 | 726 | $1,750 | $2.41 | 24d | 1 | 1.30mi |
| 1116 Gleneagle Rd Unit 2 Baltimore, MD | 2.0 | 1.0 | 876 | $1,750 | $2.00 | 44d | 1 | 1.30mi |
| 1111 Gleneagle Rd Unit 2 Baltimore, MD | 2.0 | 1.0 | 1452 | $1,050 | $0.72 | 44d | 1 | 1.31mi |
| 3607 Bayonne Ave Unit 2 Baltimore, MD | 2.0 | 1.0 | 900 | $1,300 | $1.44 | 24d | 1 | 1.31mi |
Listing history 5 events
-
2026-03-12$50,000 Active 841-char remark
Show marketing remark (841 chars)
$50,000. LIST PRICE SUGGESTED OPENING BID AT AUCTION. * * * * NO PRE BID * * * * AUCTION FRI, April 10th, 2026 @ 11:00 AM ON PREMISES. Broker/agent registration form is available upon request and must be in the hands of Jay Edwards Auctioneers 48 hours prior to the auction. Enter from front entrance to living room. Kitchen w/ dining area, gas stove, & exit to covered back porch. Coat closet. Upper level has bedroom’s #1 & 2 w/ ceiling fans closets, full bathroom, & hall closet. Attic access. Lower level has club room, washer, dryer, & exit to rear yard. Additional features include gas hot water, gas furnace, central air, & private fenced back yard. Public water & sewer. The property is subject to annual ground rent of $96.00 payable semi- annually on the 15th days of April and October.
-
2021-04-16soldstatus $75,000
-
2021-01-21soldstatus $75,000 Closed 29-char remark
Show marketing remark (29 chars)
Listed and Sold Simutaneously
-
2020-11-01status Pending 29-char remark
Show marketing remark (29 chars)
Listed and Sold Simutaneously
-
2020-11-01$75,000 Active 29-char remark
Show marketing remark (29 chars)
Listed and Sold Simutaneously
ⓘ Source: listings_history table (triggers on properties + properties_extension) + one-shot
backfill from property_details.listing_events for pre-trigger history.
Tax reassessment forecast MD · Partial reset (capped growth)
- Current annual tax
- $2,619 · $218/mo
- Projected year-2 tax
- $2,619 · $218/mo
- Expected delta
- $0/yr ($0/mo · 0.0%)
ⓘ Screening estimate from a state-policy table — verify with the county assessor before closing.
Climate risk First Street
- Flood 1/10 Low FEMA zone X (unshaded) · 0% chance over 30 yrs
- Wildfire 1/10 Low
- Heat 7/10 Severe 7 d/yr ≥103°F today · 15 d/yr by 30 yrs out
- Wind 6/10 Major 27% chance of damaging wind over 30 yrs
- Air quality 4/10 Moderate 3 unhealthy d/yr today · 6 by 30 yrs out
Nearby sold comps map
Loading sold comps map…
Walkable amenities ~0.75 mi
Loading nearby amenities…
Taxation est. · year 1
- Rental income
- $19,760
- − Mortgage interest
- −$5,882
- − Property taxes
- −$2,619
- − Insurance
- −$525
- − Repairs & maintenance
- −$1,581
- − Management
- −$1,581
- − Depreciation
- −$3,055
- Taxable income
- $4,518
- Est. tax owed @ 24.0%
- −$1,084
- After-tax cash flow
- $4,774/yr
For passive investors: Depreciation is non-cash, so a rental often shows a tax loss while cash-flowing — sheltering income. Rental losses are passive: they offset passive income freely, and up to $25,000/yr can offset ordinary (W-2) income if you actively participate and your MAGI is under $100k (phasing out to $0 by $150k); unused losses carry forward. On sale, claimed depreciation is recaptured at up to 25%, and gains may owe capital-gains tax (a 1031 exchange can defer both). Figures are a year-1 estimate at your 24.0% rate — not tax advice; consult a CPA.
Schools (NCES district)
- District
- Baltimore City Public Schools
- NCES district ID
- 2400090
- Math proficiency
- 7% ▼ -9.00%
- Reading proficiency
- 16% ▼ -5.00%
- Median HH income
- $42,108
- Composite
- 10.08/100
- National rank
- #9805
- State rank
- #24 of 24 in MD
Livability — Baltimore
- Score
- 76/100
- State rank
- #90
- US rank
- #3396
Category grades
Schools grade is shown separately in the Schools card above.
Census & demographics
- Census place
- Baltimore, MD
- County
- Baltimore City · 558,601 people
- City population
- 588,727
- Metro
- Baltimore-Columbia-Towson, MD
- Population (ZIP)
- 21,092
- Household income
- $86,366
- Rent vs Own
- Severe rent burden
- 432.0
Population outlook (Baltimore County) Hauer SSP2
- Today (2025)
- 624,249 people
- By 2030
- 621,541 · -0.4%
- By 2040
- 609,756 · -2.3%
- By 2050
- 597,249 · -4.3%
- By 2075
- 552,236 · -11.5%
- By 2100
- 513,934 · -17.7%
Race, ethnicity, and origin ACS 2023
- Neighborhood character
- Diverse neighborhood (Simpson 0.56)
- Race & ethnicity
- Black 58% White 33% Two or more races 6% Hispanic / Latino 3%
- Common ancestry
- Romanian 3% Italian 1% Lithuanian 1%
- Foreign-born
- 7% · Canada
- Languages at home
- 93% English-only · Spanish 3% French/Haitian/Cajun 1%
Political lean MEDSL · Baltimore
- 2024 margin
- Solid D (+73.0) · D 85.2% · R 12.2% · Other 2.6%
- 2008→2024 swing
- -2.5pp toward R · 2008: 75.5pp · 2024: 73.0pp
- All cycles
- 2024: D+73.0 2020: D+76.6 2016: D+74.6 2012: D+76.4 2008: D+75.5
Not yet ingested
- Civics
- —
Market trends
- HPI YoY
- ▼ -211.52%
- Current HPI
- 310.5637
- Rent YoY
- —
- Metro
- Baltimore-Columbia-Towson, MD
- State GDP YoY
- ▲ 2.97%
- F500 in state
- 12
Industry mix (Fortune 500 HQ in MD)
| Industry | F500 HQs | Revenue |
|---|---|---|
| Aerospace / Defense | 1 | $71B |
|
||
| Utilities | 1 | $25B |
|
||
| Hotels | 1 | $24B |
|
||
| Consumer Goods | 1 | $7B |
|
||
| Real Estate | 1 | $6B |
|
||
| Chemicals | 1 | $2B |
|
||
Price history
-33.3% since first listed5 events — show timeline
- 2026-03-12 Listed $50,000 BRIGHT MLS
- 2021-04-16 Sold (Public Records) $75,000 Public Records
- 2021-01-21 Sold (MLS) $75,000 BRIGHT MLS
- 2020-11-01 Pending — BRIGHT MLS
- 2020-11-01 Listed $75,000 BRIGHT MLS
Property tax history
-0.5%/yrLatest (2025): $2,619 · +2.8% YoY. Source: county tax records.
Cash-flow waterfall
monthlySold comps — $/sqft
last 12 mo · ≤1 miLoading sold comps…