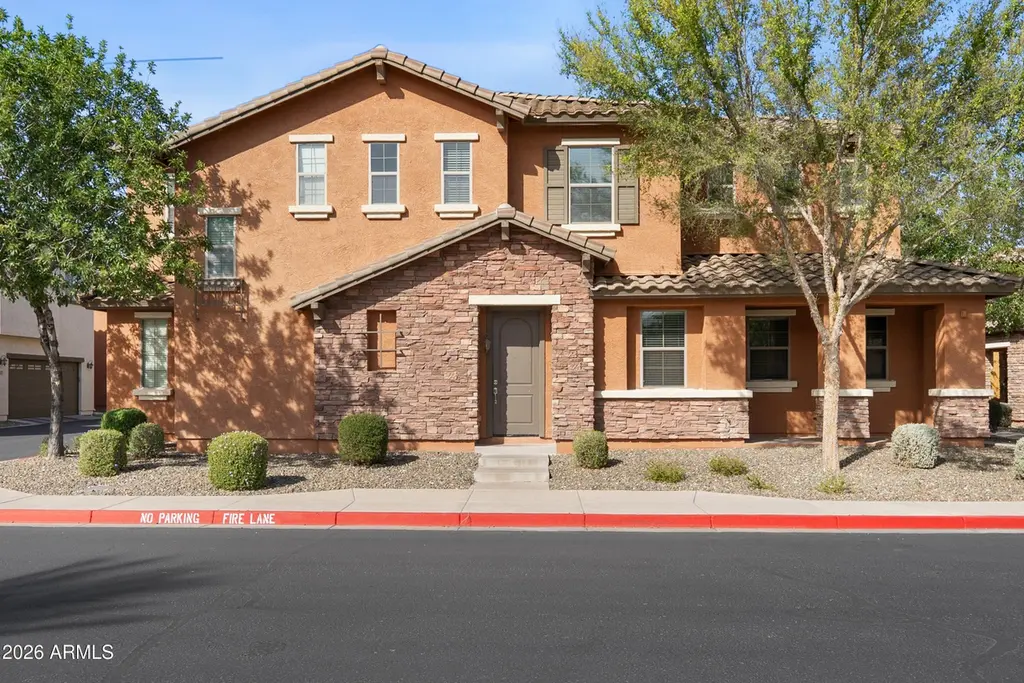
26007 N 53 Dr · Phoenix, AZ
Flood risk 1/10 · Minimal
- FEMA flood zone
- X (shaded)
- Chance of flooding over 30 yrs
- 0.0%
- Est. flood insurance / yr
- $507 – $1,088
Fire risk 5/10 · Moderate
- Est. fire insurance / yr
- $610 – $1,132
Heat risk 8/10 · Major
- Hot days now (above 111°F)
- 7 days/yr
- Hot days in 30 yrs
- 17 days/yr
Wind risk 1/10 · Minimal
- Chance of severe wind over 30 yrs
- —
Air-quality risk 2/10 · Minimal
- Unhealthy air days now
- 2 days/yr
- Unhealthy air days in 30 yrs
- 2 days/yr
Risk factors via First Street. Map © Google.
Why this score? — see what drove the D- grade
The composite is a weighted blend of 9 inputs, each scored 0–100. Each bar is that input's sub-score; the figure is the points it added to the 100-point composite (weight × sub-score).
- Appreciation +10.0/10.0
- ARV discount +7.5/15.0
- Cash flow +6.2/30.0
- Schools +4.7/10.0
- Livability +3.8/5.0
- Rent growth +3.1/5.0
- Condition / age +2.5/5.0
- 1% rule +1.4/10.0
- DSCR +0.5/10.0
$465,000
🖨 Deal sheet 📄 Offer letter ✓ Due diligence
Listing remarks MLS
Look at this Great price! only 169,000 for 2,297 sq ft.This home has Granite kitchen. Tile in all the right places. Mountain Views ! This home sits across from pool area. lots of parking end unit Water and trash included in Hoa.No yard work, Hoa maintains front yard and all common areas Just relax and enjoy
Key facts
- $418 HOA
- 2 garage spots
- Community pool
Property features AI
Finance
- Financial info: Conventional financing available
- HOA & community: Homeowner association with monthly and quarterly fees; HOA covers pest control, grounds maintenance, street maintenance, front yard maintenance, trash and water; Pool in the community
Exterior
- Parking: Covered parking for 2 vehicles; 2-car garage
- Utilities: City water; Public sewer
- Home design: Townhouse; Fee simple ownership
- Construction: Stucco, stone and block construction; Tile and concrete roof
- Exterior features: Desert front lot; Partial block fencing (see remarks); Block fencing
Interior
- Kitchen: Built-in microwave; Refrigerator; Dishwasher; Built-in electric oven; Reverse osmosis system; Kitchen island; Eat-in kitchen
- Bedrooms: Up to 5 possible bedrooms
- Bathrooms: 2 full bathrooms; 1 half bathroom
- Heating & cooling: Electric heating; Ceiling fans; ENERGY STAR qualified cooling equipment
- Interior features: Granite counters; Double vanity; Eat-in kitchen; Kitchen island; Separate shower and tub
- Laundry & utility: Washer/Dryer hookup only
Neighborhood map
What this means for you Summary
Snapshot
- This is a 4-bed/4.0-bath townhouse listed at $465k.
Deal economics
- At list price, monthly cash flow is $-841 ($-10k/yr) — negative.
- To cash-flow at today's rent, offer at most $316k (32.0% below list).
- To meet the 1% rule (rent ≥ 1% of price), the offer needs to be $299k (35.7% below list).
- Recommended offer: $299k (35.7% below list) — sets the bar for 1% rule.
- Cap rate 4.1% vs local median 3.3% in Phoenix — meaningfully above typical; check what's discounted (condition, days-on-market, listing class) to confirm the premium yield is real.
Location & tenants
- Location reads 75/100 on livability (#16 in AZ, #3,924 nationally) — a middle-class / working-renter tenant base. Strengths: amenities A+, commute A+, housing A+; Watch: health & safety C-, crime F.
- Deer Valley Unified District (4246) (urban): math 50% / reading 55% proficiency, ranked #33 of 249 in AZ (top 13%) — acceptable for families but not a draw, mixed tenant base, ~2y average lease.
- Zoned schools: Stetson Hills School (math 69% / reading 67%, grade B+, #65 of 1,109 statewide, top 6%, 912 students, 14% FRL); Deer Valley Middle School (math 20% / reading 30%, grade F, #105 of 218 statewide, top 49%, 537 students, 65% FRL); Sandra Day O'Connor High School (math 43% / reading 48%, grade D-, #58 of 381 statewide, top 15%, 2,567 students, 13% FRL).
- Market conditions: Rents rising (+2.3%/yr); 118 active listings in the ZIP; 28 comparable units currently listed for rent nearby; rentals at typical pace (median 18d on market — plan ~3-4 weeks tenant-placement turnaround); high-income renter base; 36,011 units permitted in Maricopa County in 2024 (12,801 in 5+ unit buildings).
Forward outlook
- In year one you build about $50k of equity ($3k loan paydown + $46k appreciation (10.0% local appreciation)).
- Maricopa County population projected at +38% by 2050 — long-run rental-demand tailwind backs the buy-and-hold thesis.
- By year 2, paydown + projected appreciation supports a ~$80k cash-out refi (75% LTV) — recoverable capital for the next deal without selling this one.
Negotiation context
- Only 13 days on market — expect competitive offers; lowballing is unlikely to land.
- 3 sale attempts since 17y ago with the ask held roughly flat each time — persistent listings suggest the price (not the market) is what's stuck; bring a comps-based counter.
- Current owner paid $169k; list at $465k implies a 175% gain — meaningful room to come down on a strong offer.
Risks & watch-outs
- Climate carrying-cost: moderate wildfire risk; extreme-heat days projected 7→17/yr by 2055 (HVAC capex compounding) — expect insurance premiums to compound above CPI over the hold.
Questions for the listing agent
- What do current leases actually rent for vs. the listed asking? Can we see a recent rent roll and the last 12 months of T-12 income?
- What does the HOA fee cover, when was the last increase, and are there any pending special assessments or reserve-fund shortfalls?
- Is there a deadline driving the sale (1031 exchange, divorce, estate, relocation)? That informs how much negotiation room exists.
- Crime grade is F in this area — have there been break-ins, vandalism, or insurance claims at this property in the last 3 years? What carrier currently insures it and at what premium?
- The area grade is low — what's the realistic commute time and amenity access for the typical tenant pool here? Any planned neighborhood developments (good or bad) we should know about?
- What's the average days-on-market for RENTAL listings here right now (not sales)? A rising rental-DOM trend means longer vacancies and softer asking-rent achievability than the comps imply.
- What's the recent tenant-quality profile in this submarket — average credit score on applications, eviction rate, late-payment / NSF rate, and stable-employment percentage? A property-management company in the area should have these aggregated.
- How much new for-sale + rental construction is in the pipeline within 1–3 miles? Heavy new supply typically softens prices + rents 12–24 months out; constrained supply supports both.
Investment metrics
- 1% rule
- 0.64% ✗
- Cap rate
- 4.12%
- Cash-on-cash
- -7.76%
- DSCR
- 0.65
- GRM
- 13.0
CMA / ARV
No comps found within radius.
Projected returns pro-forma
10.0% appreciation · 2.29% rent growth · sell at horizon
- IRR
- 18.6%
- Equity multiple
- 2.52×
- Total profit
- $197,576
- Equity at exit
- $418,909
- IRR
- 17.2%
- Equity multiple
- 5.76×
- Total profit
- $619,870
- Equity at exit
- $903,393
Cash invested: $130,200 (down + closing). Projections, not guarantees.
Landlord ↔ Tenant lean methodology
- Overall (STATE)
- 87 Strongly Landlord-Friendly
- State Arizona
- 87 Strongly Landlord-Friendly · R+3
- County
- — inherits STATE
- City
- — inherits STATE
ZIP-level market 85083
- Home prices YoY
- 5.4%
- Rents YoY
- 2.3%
- Active inventory
- 118
- Price-to-rent
- 13.0×
Monthly cashflow live
- Estimated rent
- $2,992 high interval (Pro) →
- Mortgage (P&I)
- −$2,439
- Tax from tax record
- −$155 /mo · $1,856/yr
- Insurance
- −$194
- HOA
- −$418
- Vacancy / Maint / Mgmt
- −$628
- Net cashflow
- $-841
Break-even live
UW: 25.0% down · 7.5% · 30yr · 1.5% tax · 5.0% vac · 8.0% maint · 8.0% mgmt
Financing live
Cash to close
- Down payment
- $116,250
- Closing costs
- $13,950
- Reserves months
- —
- Total cash needed
- —
Loan-product check · same deal, 3 products live
Conventional
25% down · 7.5% · 30yr
- Down + closing
- —
- Monthly P&I
- —
- Monthly cashflow
- —
- DSCR
- —
- Eligible?
- —
Personal DTI + credit; lowest rate.
DSCR
20% down · 8.5% · 30yr
- Down + closing
- —
- Monthly P&I
- —
- Monthly cashflow
- —
- DSCR
- —
- Eligible?
- —
No personal income docs; deal must DSCR.
Hard money
10% down · 12.0% · 12mo
- Down + closing
- —
- Monthly P&I
- —
- Monthly cashflow
- —
- DSCR
- —
- Eligible?
- —
Short-term bridge; refi at stabilization.
Rent comps 28 comps
| Address | Beds | Baths | Sqft | Rent | $/sqft | DOM | Units | Dist |
|---|---|---|---|---|---|---|---|---|
| 26681 N Babbling Brook Dr Phoenix, AZ | 3.0 | 2.5 | 1871 | $2,160 | $1.15 | 7d | 1 | 0.38mi |
| 5340 W Molly Ln Phoenix, AZ | 3.0 | 2.5 | 1871 | $2,400 | $1.28 | 24d | 1 | 0.44mi |
| 5388 W Molly Ln Phoenix, AZ | 3.0 | 2.5 | 1871 | $2,099 | $1.12 | 7d | 1 | 0.45mi |
| 5235 W Blaylock Dr Phoenix, AZ | 4.0 | 2.0 | 2128 | $2,850 | $1.34 | 24d | 1 | 0.45mi |
| 5433 W Red Bird Rd Phoenix, AZ | 4.0 | 3.0 | 2745 | $3,300 | $1.20 | 24d | 1 | 0.54mi |
| 5118 W Molly Ln Phoenix, AZ | 3.0 | 2.0 | 2128 | $2,450 | $1.15 | 7d | 1 | 0.60mi |
| 27015 N 52nd Gln Phoenix, AZ | 3.0 | 2.0 | 2314 | $2,795 | $1.21 | 18d | 1 | 0.61mi |
| 27105 N 52nd Ave Phoenix, AZ | 3.0 | 2.0 | 2314 | $2,499 | $1.08 | 16d | 1 | 0.67mi |
| 5412 W Fetlock Trl Phoenix, AZ | 4.0 | 2.0 | 1805 | $3,200 | $1.77 | 43d | 1 | 0.77mi |
| 5432 W Fetlock Trl Phoenix, AZ | 4.0 | 2.5 | 2103 | $2,900 | $1.38 | 12d | 1 | 0.80mi |
| 5414 W Straight Arrow Ln Phoenix, AZ | 4.0 | 2.0 | 1760 | $4,500 | $2.56 | 43d | 1 | 0.83mi |
| 27424 N 54th Ln Phoenix, AZ | 4.0 | 2.5 | 2104 | $2,885 | $1.37 | 1d | 1 | 0.86mi |
| 6102 W Fallen Leaf Ln Glendale, AZ | 4.0 | 3.0 | 2018 | $2,350 | $1.16 | 24d | 1 | 1.08mi |
| 4536 W Villa Linda Dr Glendale, AZ | 4.0 | 2.5 | 2752 | $3,500 | $1.27 | 43d | 1 | 1.19mi |
| 6326 W El Cortez Pl Phoenix, AZ | 4.0 | 2.5 | 2579 | $3,450 | $1.34 | 2d | 1 | 1.20mi |
| 25223 N 63rd Dr Phoenix, AZ | 3.0 | 2.5 | 2113 | $2,200 | $1.04 | 43d | 1 | 1.21mi |
| 6101 W Whispering Wind Dr Glendale, AZ | 4.0 | 2.5 | 1938 | $2,950 | $1.52 | 17d | 1 | 1.22mi |
| 6424 W Saddlehorn Rd Phoenix, AZ | 4.0 | 2.0 | 1647 | $2,195 | $1.33 | 7d | 1 | 1.35mi |
| 6425 W Desert Hollow Dr Phoenix, AZ | 3.0 | 2.5 | 2295 | $2,250 | $0.98 | 5d | 1 | 1.38mi |
| 4410 W Fallen Leaf Ln Glendale, AZ | 5.0 | 2.5 | 3315 | $3,750 | $1.13 | 7d | 1 | 1.38mi |
| 6017 W Running Deer Trl Phoenix, AZ | 5.0 | 3.0 | 2563 | $2,750 | $1.07 | 2d | 1 | 1.41mi |
| 6434 W Hackamore Dr Phoenix, AZ | 4.0 | 2.5 | 3175 | $3,400 | $1.07 | 24d | 1 | 1.42mi |
| 5925 W Cielo Grande Glendale, AZ | 4.0 | 2.0 | 1886 | $2,695 | $1.43 | 18d | 1 | 1.45mi |
| 5843 W Cielo Grande Glendale, AZ | 4.0 | 4.0 | 2457 | $4,100 | $1.67 | 7d | 1 | 1.45mi |
| 6506 W Molly Ln Phoenix, AZ | 5.0 | 3.0 | 2876 | $3,100 | $1.08 | 5d | 1 | 1.45mi |
| 6539 W Jomax Rd Phoenix, AZ | 3.0 | 3.0 | 2526 | $2,495 | $0.99 | 10d | 1 | 1.46mi |
| 6539 W Jomax Rd Phoenix, AZ | 3.0 | 3.0 | 2526 | $2,495 | $0.99 | 24d | 1 | 1.46mi |
| 6539 W Jomax Rd Phoenix, AZ | 3.0 | 3.0 | 2526 | $2,495 | $0.99 | 21d | 1 | 1.46mi |
HOA detail
- Monthly dues
- $418 · $5,016/yr
- Likely covers
- watertrashpool
Listing history 10 events
-
2026-06-18days on market $465,000 Active 13 DOM
-
2026-06-17days on market $465,000 Active 12 DOM
-
2026-06-16days on market $465,000 Active 11 DOM
-
2026-06-15days on market $465,000 Active 10 DOM
-
2026-06-13days on market $465,000 Active 8 DOM
-
2026-06-13days on market $465,000 Active 7 DOM
-
2026-06-09days on market $465,000 Active 4 DOM
-
2026-06-08days on market $465,000 Active 3 DOM
-
2026-06-07remarks 699-char remark
-
2026-06-07$465,000 Active 2 DOM
ⓘ Source: listings_history table (triggers on properties + properties_extension) + one-shot
backfill from property_details.listing_events for pre-trigger history.
Tax reassessment forecast AZ · Resets to sale price
- Current annual tax
- $1,856 · $155/mo
- Projected year-2 tax
- $3,069 · $256/mo
- Expected delta
- +$1,213/yr (+$101/mo · 65.4%)
ⓘ Screening estimate from a state-policy table — verify with the county assessor before closing.
Climate risk First Street
- Flood 1/10 Low FEMA zone X (shaded) · 0% chance over 30 yrs
- Wildfire 5/10 Major
- Heat 8/10 Severe 7 d/yr ≥111°F today · 17 d/yr by 30 yrs out
- Wind 1/10 Low
- Air quality 2/10 Low 2 unhealthy d/yr today · 2 by 30 yrs out
Nearby sold comps map
Loading sold comps map…
Walkable amenities ~0.75 mi
Loading nearby amenities…
Taxation est. · year 1
- Rental income
- $35,901
- − Mortgage interest
- −$26,047
- − Property taxes
- −$1,856
- − Insurance
- −$2,325
- − Repairs & maintenance
- −$2,872
- − Management
- −$2,872
- − HOA
- −$5,016
- − Depreciation
- −$13,527
- Taxable loss
- −$18,615
- Est. tax savings @ 24.0%
- +$4,468
- After-tax cash flow
- $-5,630/yr
For passive investors: Depreciation is non-cash, so a rental often shows a tax loss while cash-flowing — sheltering income. Rental losses are passive: they offset passive income freely, and up to $25,000/yr can offset ordinary (W-2) income if you actively participate and your MAGI is under $100k (phasing out to $0 by $150k); unused losses carry forward. On sale, claimed depreciation is recaptured at up to 25%, and gains may owe capital-gains tax (a 1031 exchange can defer both). Figures are a year-1 estimate at your 24.0% rate — not tax advice; consult a CPA.
Schools (NCES district)
- District
- Deer Valley Unified District (4246)
- NCES district ID
- 0407750
- Math proficiency
- 50% ▼ -9.00%
- Reading proficiency
- 55% ▼ -6.00%
- Median HH income
- $72,516
- Composite
- 47.0/100
- National rank
- #2346
- State rank
- #33 of 249 in AZ
Livability — Phoenix
- Score
- 75/100
- State rank
- #16
- US rank
- #3924
Category grades
Schools grade is shown separately in the Schools card above.
Census & demographics
- Census place
- Phoenix, AZ
- County
- Maricopa County · 4,537,380 people
- City population
- 1,500,198
- Metro
- Phoenix-Mesa-Chandler, AZ
- Population (ZIP)
- 21,022
- Household income
- $149,087
- Rent vs Own
- Severe rent burden
- 81.0
Population outlook (Maricopa County) Hauer SSP2
- Today (2025)
- 4,979,203 people
- By 2030
- 5,378,229 · +8.0%
- By 2040
- 6,156,598 · +23.6%
- By 2050
- 6,872,376 · +38.0%
- By 2075
- 8,401,270 · +68.7%
- By 2100
- 9,247,439 · +85.7%
Race, ethnicity, and origin ACS 2023
- Neighborhood character
- Predominantly White (74%)
- Race & ethnicity
- White 74% Asian 10% Hispanic / Latino 10% Two or more races 6% Black 2%
- Hispanic origin (detail)
- Mexican 8%
- Common ancestry
- Portuguese 3% Lithuanian 2% Scandinavian 2%
- Foreign-born
- 14% · Canada, China, Vietnam
- Languages at home
- 83% English-only · Other Indo-European 7% Other Asian/Pacific 3% Spanish 3%
Political lean MEDSL · Maricopa
- 2024 margin
- Toss-up / Even · D 47.7% · R 51.2% · Other 1.1%
- 2008→2024 swing
- +7.1pp toward D · 2008: -10.6pp · 2024: -3.5pp
- All cycles
- 2024: R+3.5 2020: D+2.2 2016: R+3.5 2012: R+12.0 2008: R+10.6
Not yet ingested
- Civics
- —
Market trends
- HPI YoY
- ▲ 14.78%
- Current HPI
- 289.2128
- Rent YoY
- ▲ 2.29%
- Metro
- Phoenix-Mesa-Chandler, AZ
- State GDP YoY
- ▲ 4.54%
- F500 in state
- 20
Industry mix (Fortune 500 HQ in AZ)
| Industry | F500 HQs | Revenue |
|---|---|---|
| Technology | 2 | $13B |
|
||
| Mining / Metals | 1 | $23B |
|
||
| Environmental Services | 1 | $16B |
|
||
| Metals / Steel | 1 | $14B |
|
||
| Technology Distribution | 1 | $9B |
|
||
| Homebuilding | 1 | $8B |
|
||
Price history
+173.7% since first listed7 events — show timeline
- 2026-06-05 Listed $465,000 ARMLS
- 2010-03-05 Sold (MLS) $169,000 ARMLS
- 2010-03-04 Sold (Public Records) $169,000 Public Records
- 2010-02-01 Listing Removed — ARMLS
- 2010-01-15 Listed $169,000 ARMLS
- 2010-01-14 Listing Removed — ARMLS
- 2009-11-19 Listed $169,900 ARMLS
Property tax history
+0.3%/yrLatest (2025): $1,856 · +1.3% YoY. Source: county tax records.
Cash-flow waterfall
monthlySold comps — $/sqft
last 12 mo · ≤1 miLoading sold comps…