5100 Caruso Rd · Bradenton, FL
Flood risk 3/10 · Minor
- FEMA flood zone
- X (unshaded)
- Chance of flooding over 30 yrs
- 0.12%
- Est. flood insurance / yr
- $507 – $1,088
Fire risk 1/10 · Minimal
- Est. fire insurance / yr
- $947 – $1,759
Heat risk 10/10 · Severe
- Hot days now (above 108°F)
- 7 days/yr
- Hot days in 30 yrs
- 28 days/yr
Wind risk 10/10 · Severe
- Chance of severe wind over 30 yrs
- 99.0%
Air-quality risk 3/10 · Minor
- Unhealthy air days now
- 3 days/yr
- Unhealthy air days in 30 yrs
- 3 days/yr
Risk factors via First Street. Map © Google.
Why this score? — see what drove the B grade
The composite is a weighted blend of 9 inputs, each scored 0–100. Each bar is that input's sub-score; the figure is the points it added to the 100-point composite (weight × sub-score).
- Cash flow +30.0/30.0
- 1% rule +10.0/10.0
- DSCR +10.0/10.0
- ARV discount +7.5/15.0
- Schools +4.4/10.0
- Livability +4.0/5.0
- Condition / age +3.8/5.0
- Rent growth +2.3/5.0
- Appreciation +0.0/10.0
$90,000
🖨 Deal sheet 📄 Offer letter ✓ Due diligence
Listing remarks
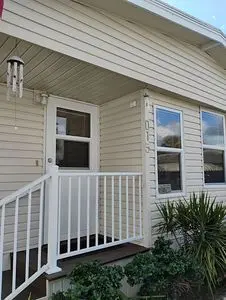
Here's your million-dollar view without paying for it. Situated on the Braden River in Horseshoe Cove RV Resort, you'll love the panoramic views from your living room as you watch wildlife evolve right in front of you. We are offering this beautiful 950 sq. ft. home which comes fully furnished and turnkey, including a 48v 2019 golf cart with new lithium battery and built in charger. Cemented patio area with table and chairs, and additional seating behind the house. Fully renovated. All you need are your personal possessions. Horseshoe Cove offers ample amenities and endless activities and events throughout the year. Please give us a call. We are willing to negotiate asap. All offers are con
Key facts
- Fishing dock
- Boat docks
- Private island
Tags
Property features AI
Exterior
- Home design: Single-family house; 950 square feet of living area
- Exterior features: Approximately 0.10-acre lot
Neighborhood map
What this means for you Summary
Snapshot
- This is a 1-bed/1.0-bath single-family listed at $90k. Condition is rated good.
Deal economics
- At list price, monthly cash flow is $1k ($16k/yr) — positive.
- The deal already cash-flows at list — no discount required.
- Meets the 1% rule at list price ($2k rent vs $90k).
- Cap rate 24.2% vs local median 3.6% in Bradenton — top-decile yield for the area; either an underpriced asset or a hidden risk that comps aren't pricing in. Stress-test before assuming the spread holds.
Location & tenants
- Location reads 81/100 on livability (#101 in FL, #1,528 nationally) — a professional / high-income tenant draw. Strengths: commute A+, cost of living A+, housing A+; Watch: employment D+, crime D, amenities F.
- Manatee (suburban): math 54% / reading 50% proficiency, ranked #26 of 73 in FL (top 36%) — acceptable for families but not a draw, mixed tenant base, ~2y average lease.
- Market conditions: Rents soft (-1.0%/yr); 384 active listings in the ZIP; 22 comparable units currently listed for rent nearby; rentals at typical pace (median 24d on market — plan ~3-4 weeks tenant-placement turnaround); 7,472 units permitted in Manatee County in 2024 (1,782 in 5+ unit buildings).
- This rent runs 42% of the median local income ($71k/yr) — at the standard rent-burdened threshold; future hikes will face affordability resistance.
Forward outlook
- Local home prices are declining (-3.0%/yr); year-one equity from $622 of loan paydown is wiped out by about $3k of value loss. Plan a longer hold.
- Manatee County population projected at +43% by 2050 — long-run rental-demand tailwind backs the buy-and-hold thesis.
- At projected returns (-3.0% appreciation + 0.0% rent growth), your $25k cash investment doubles in ~2 years — after that, you're playing with house money.
Negotiation context
- Only 9 days on market — expect competitive offers; lowballing is unlikely to land.
Risks & watch-outs
- Climate carrying-cost: severe wind risk, 99% chance of damaging wind over 30y; extreme-heat days projected 7→28/yr by 2055 (HVAC capex compounding) — expect insurance premiums to compound above CPI over the hold.
Questions for the listing agent
- Is there a deadline driving the sale (1031 exchange, divorce, estate, relocation)? That informs how much negotiation room exists.
- Crime grade is D in this area — have there been break-ins, vandalism, or insurance claims at this property in the last 3 years? What carrier currently insures it and at what premium?
- What's the average days-on-market for RENTAL listings here right now (not sales)? A rising rental-DOM trend means longer vacancies and softer asking-rent achievability than the comps imply.
- What's the recent tenant-quality profile in this submarket — average credit score on applications, eviction rate, late-payment / NSF rate, and stable-employment percentage? A property-management company in the area should have these aggregated.
- How much new for-sale + rental construction is in the pipeline within 1–3 miles? Heavy new supply typically softens prices + rents 12–24 months out; constrained supply supports both.
Investment metrics
- 1% rule
- 2.76% ✓
- Cap rate
- 24.17%
- Cash-on-cash
- 63.83%
- DSCR
- 3.84
- GRM
- 3.0
CMA / ARV
No comps found within radius.
Show comp detail 2 sales within ~0.75 mi
| Address | Dist | Beds/Ba | Sqft | Sold | Price | $/sf | Match |
|---|---|---|---|---|---|---|---|
| 5316 53rd Ave E Unit F23 | 0.55mi | 2/2.0 (+1) | 864 | 23mo | $165,000 | $191 | 34 |
| 5316 53rd Ave E Unit C19 | 0.67mi | 2/2.0 (+1) | 1,120 | 21mo | $145,000 | $129 | 29 |
Match score weights: distance 35% · size 25% · config 20% · recency 20%. Top-matched comps best support the ARV.
Projected returns pro-forma
-3.0% appreciation · 0.0% rent growth · sell at horizon
- IRR
- 59.5%
- Equity multiple
- 3.52×
- Total profit
- $63,545
- Equity at exit
- $13,419
- IRR
- 63.1%
- Equity multiple
- 6.45×
- Total profit
- $137,282
- Equity at exit
- $7,782
Cash invested: $25,200 (down + closing). Projections, not guarantees.
Landlord ↔ Tenant lean methodology
- Overall (STATE)
- 87 Strongly Landlord-Friendly
- State Florida
- 87 Strongly Landlord-Friendly · R+3
- County
- — inherits STATE
- City
- — inherits STATE
ZIP-level market 34203
- Home prices YoY
- -24.5%
- Rents YoY
- -1.0%
- Active inventory
- 384
- Price-to-rent
- 3.0×
Monthly cashflow live
- Estimated rent
- $2,484 high interval (Pro) →
- Mortgage (P&I)
- −$472
- Tax est. 1.5%
- −$112 /mo · $1,350/yr
- Insurance
- −$38
- HOA
- −$0
- Vacancy / Maint / Mgmt
- −$522
- Net cashflow
- $1,340
Break-even live
UW: 25.0% down · 7.5% · 30yr · 1.5% tax · 5.0% vac · 8.0% maint · 8.0% mgmt
Financing live
Cash to close
- Down payment
- $22,500
- Closing costs
- $2,700
- Reserves months
- —
- Total cash needed
- —
Loan-product check · same deal, 3 products live
Conventional
25% down · 7.5% · 30yr
- Down + closing
- —
- Monthly P&I
- —
- Monthly cashflow
- —
- DSCR
- —
- Eligible?
- —
Personal DTI + credit; lowest rate.
DSCR
20% down · 8.5% · 30yr
- Down + closing
- —
- Monthly P&I
- —
- Monthly cashflow
- —
- DSCR
- —
- Eligible?
- —
No personal income docs; deal must DSCR.
Hard money
10% down · 12.0% · 12mo
- Down + closing
- —
- Monthly P&I
- —
- Monthly cashflow
- —
- DSCR
- —
- Eligible?
- —
Short-term bridge; refi at stabilization.
Rent comps 22 comps
| Address | Beds | Baths | Sqft | Rent | $/sqft | DOM | Units | Dist |
|---|---|---|---|---|---|---|---|---|
| 5547 West Pl Unit C-1 Bradenton, FL | 2.0 | 2.0 | 1652 | $3,600 | $2.18 | 23d | 1 | 0.51mi |
| 6503 Fairway Gardens Dr Unit Available Bradenton, FL | 2.0 | 2.0 | 1346 | $2,200 | $1.63 | 23d | 1 | 0.57mi |
| 5414 Fair Oaks St Unit 10-D Bradenton, FL | 2.0 | 2.0 | 1004 | $1,995 | $1.99 | 3d | 1 | 0.62mi |
| 5316 53rd Ave E Unit Q111 Bradenton, FL | 2.0 | 2.0 | 1056 | $1,495 | $1.42 | 10d | 1 | 0.65mi |
| 5515 Fair Oaks St Unit 5515 Bradenton, FL | 2.0 | 2.0 | 1004 | $2,000 | $1.99 | 23d | 1 | 0.66mi |
| 5635 Whitehead St Bradenton, FL | 2.0 | 2.5 | 1496 | $2,300 | $1.54 | 23d | 1 | 0.67mi |
| 5650 Simonton St Bradenton, FL | 2.0 | 2.5 | 1496 | $2,095 | $1.40 | 3d | 1 | 0.74mi |
| 6501 Stone River Rd Bradenton, FL | 2.0 | 2.0 | 1080 | $2,820 | $2.61 | 16d | 2 | 0.74mi |
| 6501 Stone River Rd Unit Available Bradenton, FL | 2.0 | 2.0 | 1118 | $2,200 | $1.97 | 23d | 1 | 0.74mi |
| 6505 Stone River Rd Bradenton, FL | 2.0 | 2.0 | 1080 | $2,825 | $2.62 | 16d | 3 | 0.76mi |
| 5616 Gentle Breeze St Bradenton, FL | 2.0 | 2.0 | 1100 | $1,700 | $1.55 | 23d | 1 | 0.80mi |
| 6758 Fairview Ter Bradenton, FL | 2.0 | 2.0 | 1346 | $2,300 | $1.71 | 23d | 1 | 0.87mi |
| 6870 Fairview Ter #6870 Bradenton, FL | 2.0 | 2.0 | 1346 | $2,200 | $1.63 | 16d | 1 | 0.99mi |
| 6872 Fairview Ter #101 Bradenton, FL | 2.0 | 2.0 | 1352 | $2,000 | $1.48 | 23d | 1 | 0.99mi |
| 6713 Stone River Rd #202 Bradenton, FL | 2.0 | 2.0 | 1232 | $1,900 | $1.54 | 23d | 1 | 0.99mi |
| 6807 Stone River Rd #202 Bradenton, FL | 2.0 | 2.0 | 1292 | $3,500 | $2.71 | 16d | 1 | 1.00mi |
| 4540 Runabout Way Bradenton, FL | 2.0 | 2.5 | 1080 | $2,300 | $2.13 | 23d | 1 | 1.04mi |
| 5016 Misty Canal Pl Bradenton, FL | 2.0 | 2.5 | 1080 | $1,950 | $1.81 | 23d | 1 | 1.09mi |
| 5707 45th St E #19 Bradenton, FL | 2.0 | 2.0 | 972 | $1,700 | $1.75 | 23d | 1 | 1.19mi |
| 6815 Pleasant Hill Rd Bradenton, FL | 2.0 | 2.5 | 2100 | $4,500 | $2.14 | 23d | 1 | 1.24mi |
| 5811 White Oak Bayou Ct Bradenton, FL | 2.0 | 2.5 | 2147 | $6,500 | $3.03 | 23d | 1 | 1.31mi |
| 6738 Peach Tree Creek Rd Bradenton, FL | 2.0 | 2.0 | 1838 | $6,200 | $3.37 | 23d | 1 | 1.42mi |
Listing history 18 events
-
2026-06-18days on market $90,000 Active 9 DOM
-
2026-06-17days on market $90,000 Active 8 DOM
-
2026-06-16days on market $90,000 Active 7 DOM
-
2026-06-15days on market $90,000 Active 6 DOM
-
2026-06-13days on market $90,000 Active 4 DOM
-
2026-06-13days on market $90,000 Active 3 DOM
-
2026-06-10days on market $90,000 Active 1 DOM
-
2026-06-09days on market $90,000 Active 241 DOM
-
2026-06-08days on market $90,000 Active 240 DOM
-
2026-06-08days on market $90,000 Active 239 DOM
-
2026-06-03days on market $90,000 Active 235 DOM
-
2026-06-02days on market $90,000 Active 234 DOM
-
2026-06-01days on market $90,000 Active 233 DOM
-
2026-05-31days on market $90,000 Active 232 DOM
-
2026-03-05price $90,000
-
2026-02-20price $99,000
-
2025-10-29price $119,000
-
2025-10-11$129,000 Active
ⓘ Source: listings_history table (triggers on properties + properties_extension) + one-shot
backfill from property_details.listing_events for pre-trigger history.
Climate risk First Street
- Flood 3/10 Moderate FEMA zone X (unshaded) · 12% chance over 30 yrs
- Wildfire 1/10 Low
- Heat 10/10 Extreme 7 d/yr ≥108°F today · 28 d/yr by 30 yrs out
- Wind 10/10 Extreme 99% chance of damaging wind over 30 yrs
- Air quality 3/10 Moderate 3 unhealthy d/yr today · 3 by 30 yrs out
Nearby sold comps map
Loading sold comps map…
Walkable amenities ~0.75 mi
Loading nearby amenities…
Taxation est. · year 1
- Rental income
- $29,808
- − Mortgage interest
- −$5,041
- − Property taxes
- −$1,350
- − Insurance
- −$450
- − Repairs & maintenance
- −$2,385
- − Management
- −$2,385
- − Depreciation
- −$2,618
- Taxable income
- $15,579
- Est. tax owed @ 24.0%
- −$3,739
- After-tax cash flow
- $12,346/yr
For passive investors: Depreciation is non-cash, so a rental often shows a tax loss while cash-flowing — sheltering income. Rental losses are passive: they offset passive income freely, and up to $25,000/yr can offset ordinary (W-2) income if you actively participate and your MAGI is under $100k (phasing out to $0 by $150k); unused losses carry forward. On sale, claimed depreciation is recaptured at up to 25%, and gains may owe capital-gains tax (a 1031 exchange can defer both). Figures are a year-1 estimate at your 24.0% rate — not tax advice; consult a CPA.
Condition & rehab AI · 0 photos
This fully renovated home offers a turnkey experience with a golf cart and patio area, making it an excellent investment opportunity.
Value-add opportunities
- Both Upgrade the golf cart battery to a higher capacity lithium battery — This would extend the life of the golf cart and make it more appealing to potential buyers or renters.
- Both Add a small outdoor lighting system — This would enhance the curb appeal and make the property more inviting at night.
Renovation cost estimate screening
Value-add ROI direction
- Both Upgrade the golf cart battery to a higher capacity lithium battery — This would extend the life of the golf cart and make it more appealing to potential buyers or renters. ↑
- Both Add a small outdoor lighting system — This would enhance the curb appeal and make the property more inviting at night. ↑
ⓘ Cost ranges are severity-bucket heuristics (US national rule-of-thumb). Get contractor quotes + a written scope before underwriting a rehab budget.
Schools (NCES district)
- District
- Manatee
- NCES district ID
- 1201230
- Math proficiency
- 54% ▼ -6.00%
- Reading proficiency
- 50% ▼ -2.00%
- Median HH income
- $49,607
- Composite
- 44.43/100
- National rank
- #2806
- State rank
- #26 of 73 in FL
Livability — Bradenton
- Score
- 81/100
- State rank
- #101
- US rank
- #1528
Category grades
Schools grade is shown separately in the Schools card above.
Census & demographics
- County
- Manatee County · 416,364 people
- City population
- 227,091
- Metro
- North Port-Sarasota-Bradenton, FL
- Population (ZIP)
- 40,618
- Household income
- $70,761
- Rent vs Own
- Severe rent burden
- 1469.0
Population outlook (Manatee County) Hauer SSP2
- Today (2025)
- 447,342 people
- By 2030
- 488,911 · +9.3%
- By 2040
- 567,934 · +27.0%
- By 2050
- 637,995 · +42.6%
- By 2075
- 781,970 · +74.8%
- By 2100
- 848,272 · +89.6%
Race, ethnicity, and origin ACS 2023
- Neighborhood character
- Predominantly White (65%)
- Race & ethnicity
- White 65% Hispanic / Latino 19% Two or more races 12% Black 9% Asian 5%
- Hispanic origin (detail)
- Mexican 9% Puerto Rican 3% Cuban 2% Dominican 1%
- Common ancestry
- Lithuanian 3% Romanian 3% Slovak 2%
- Foreign-born
- 17% · Canada, Vietnam, Dominican Republic
- Languages at home
- 76% English-only · Spanish 16% Vietnamese 2% Other Indo-European 1%
Political lean MEDSL · Manatee
- 2024 margin
- Strong R (+23.5) · D 37.9% · R 61.4%
- 2008→2024 swing
- -16.5pp toward R · 2008: -7.0pp · 2024: -23.5pp
- All cycles
- 2024: R+23.5 2020: R+16.1 2016: R+17.1 2012: R+12.5 2008: R+7.0
Not yet ingested
- Civics
- —
Market trends
- HPI YoY
- ▼ -95.87%
- Current HPI
- 295.8871
- Rent YoY
- ▼ -0.97%
- Metro
- North Port-Sarasota-Bradenton, FL
- State GDP YoY
- ▲ 3.28%
- F500 in state
- 36
Industry mix (Fortune 500 HQ in FL)
| Industry | F500 HQs | Revenue |
|---|---|---|
| Industrial Technology | 2 | $29B |
|
||
| Insurance | 2 | $17B |
|
||
| Retail | 1 | $60B |
|
||
| Technology Distribution | 1 | $58B |
|
||
| Homebuilding | 1 | $35B |
|
||
| Technology Manufacturing | 1 | $35B |
|
||
Price history
-30.2% since first listed4 events — show timeline
- 2026-03-05 Price Changed $90,000 ForSaleByOwner.com
- 2026-02-20 Price Changed $99,000 ForSaleByOwner.com
- 2025-10-29 Price Changed $119,000 ForSaleByOwner.com
- 2025-10-11 Listed $129,000 ForSaleByOwner.com
Cash-flow waterfall
monthlySold comps — $/sqft
last 12 mo · ≤1 miLoading sold comps…