 🏗️ New Construction
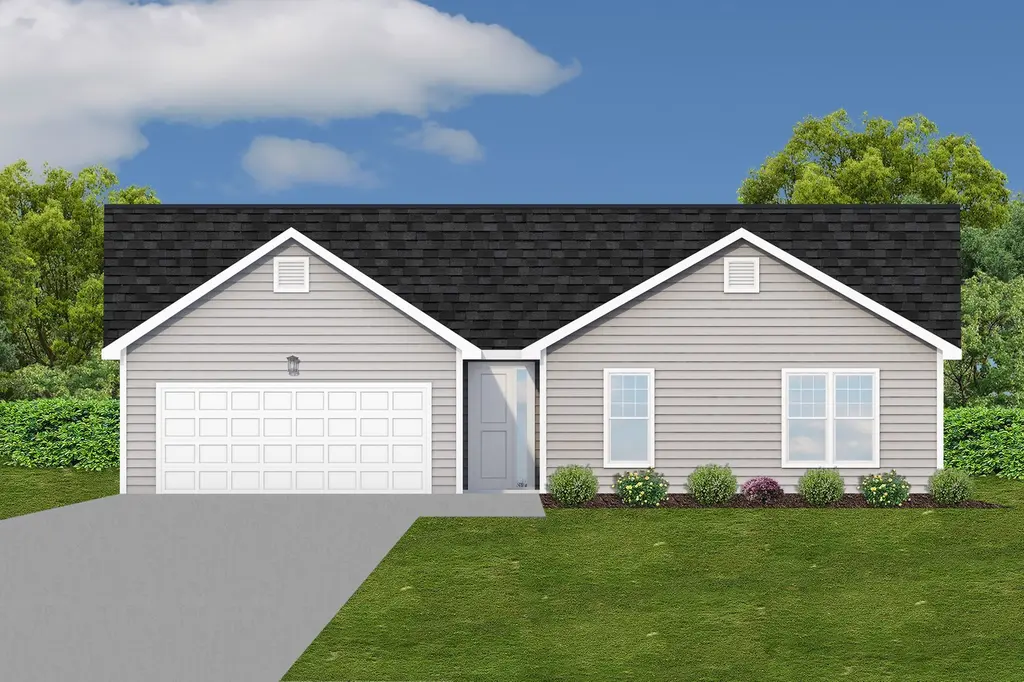
Cambridge II Plan · Herculaneum, MO
Flood risk No data
- FEMA flood zone
- —
- Chance of flooding over 30 yrs
- —
- Est. flood insurance / yr
- —
Fire risk No data
- Est. fire insurance / yr
- —
Heat risk No data
- Hot days now (above threshold)
- —
- Hot days in 30 yrs
- —
Wind risk No data
- Chance of severe wind over 30 yrs
- —
Air-quality risk No data
- Unhealthy air days now
- —
- Unhealthy air days in 30 yrs
- —
Risk factors via First Street. Map © Google.
Why this score? — see what drove the F grade
The composite is a weighted blend of 9 inputs, each scored 0–100. Each bar is that input's sub-score; the figure is the points it added to the 100-point composite (weight × sub-score).
- ARV discount +7.5/15.0
- Schools +5.1/10.0
- Livability +3.0/5.0
- Rent growth +2.5/5.0
- Condition / age +2.5/5.0
- Cash flow +2.4/30.0
- 1% rule +0.6/10.0
- DSCR +0.0/10.0
- Appreciation +0.0/10.0
$31,610
🖨 Deal sheet 📄 Offer letter ✓ Due diligence
Listing remarks MLS
Welcome to KAB Homes! Lots of quality standard features and many options to choose from. Price shown is base price. Photo is similar home and may show optional features.
Key facts
- 2 garage spots
- Listed 357 days
Neighborhood map
What this means for you Summary
Snapshot
- This is a 3-bed/2.0-bath single-family listed at $32k.
Deal economics
- At list price, monthly cash flow is $-1k ($-17k/yr) — negative.
- The deal already cash-flows at list — no discount required.
- Meets the 1% rule at list price ($2k rent vs $32k).
- Recommended offer: $28k (12.0% below list) — sets the bar for market timing.
- Cap rate 2.1% vs local median 3.9% in Herculaneum — below-typical yield; the buyer is paying a premium for something (appreciation thesis, condition, location) that the cap rate doesn't capture.
Location & tenants
- Location reads 59/100 on livability (#542 in MO) — a working-class tenant base; expect higher turnover. Strengths: housing A+, cost of living A, crime B+; Watch: schools C-, amenities F, commute F.
- Festus R-VI (suburban): math 55% / reading 64% proficiency, ranked #16 of 324 in MO (top 5%) — acceptable for families but not a draw, mixed tenant base, ~2y average lease.
- Market conditions: 58 active listings in the ZIP; 1 comparable units currently listed for rent nearby; 807 units permitted in Jefferson County in 2024 (104 in 5+ unit buildings).
Forward outlook
- Local home prices are declining (-3.0%/yr); year-one equity from $3k of loan paydown is wiped out by about $12k of value loss. Plan a longer hold.
Negotiation context
- It's been on market 357 days — a 12% lower offer ($28k) is reasonable based on typical stale-listing flexibility.
Risks & watch-outs
- Watch-outs: property tax is 18.8% of price.
Questions for the listing agent
- What do current leases actually rent for vs. the listed asking? Can we see a recent rent roll and the last 12 months of T-12 income?
- It's been on market 357 days. Have you received any prior offers? Is the seller open to a 12% concession, seller financing, or rate buy-down credit?
- Property tax is high relative to price — has the assessment been appealed recently, and will the sale trigger a re-assessment?
- What does the HOA fee cover, when was the last increase, and are there any pending special assessments or reserve-fund shortfalls?
- Why hasn't it sold? Are there any deal-killer items the seller is aware of (foundation, flood, title, zoning, code violations)?
- Is there a deadline driving the sale (1031 exchange, divorce, estate, relocation)? That informs how much negotiation room exists.
- The area grade is low — what's the realistic commute time and amenity access for the typical tenant pool here? Any planned neighborhood developments (good or bad) we should know about?
- What's the average days-on-market for RENTAL listings here right now (not sales)? A rising rental-DOM trend means longer vacancies and softer asking-rent achievability than the comps imply.
- What's the recent tenant-quality profile in this submarket — average credit score on applications, eviction rate, late-payment / NSF rate, and stable-employment percentage? A property-management company in the area should have these aggregated.
- How much new for-sale + rental construction is in the pipeline within 1–3 miles? Heavy new supply typically softens prices + rents 12–24 months out; constrained supply supports both.
Investment metrics
- 1% rule
- 0.56% ✗
- Cap rate
- 2.06%
- Cash-on-cash
- -15.12%
- DSCR
- 0.33
- GRM
- 15.0
CMA / ARV
- ARV (median comp)
- $395,183
- List price
- $31,610
- Delta
- -92.00%
- Verdict
- UNDERPRICED
- Comps
- 20 within 1.0 mi
Show comp detail 12 sales within ~0.75 mi
| Address | Dist | Beds/Ba | Sqft | Sold | Price | $/sf | Match |
|---|---|---|---|---|---|---|---|
| 2416 French Dr | 0.09mi | 3/2.0 | 1,498 (0%) | 4mo | $371,546 | $248 | 92 |
| 2420 French Dr | 0.10mi | 3/2.0 | 1,642 (+10%) | 4mo | $366,971 | $223 | 76 |
| 2441 French Dr | 0.12mi | 3/2.0 | 1,642 (+10%) | 4mo | $425,236 | $259 | 75 |
| 1069 Providence Way | 0.55mi | 3/2.0 | 1,480 (-1%) | 3mo | $317,900 | $215 | 70 |
| 1316 Wesford Way | 0.44mi | 3/2.0 | 1,582 (+6%) | 3mo | $334,900 | $212 | 67 |
| 1329 Farnman Dr | 0.34mi | 3/2.0 | 1,368 (-9%) | 5mo | $299,000 | $219 | 66 |
| 1030 Providence Way | 0.46mi | 3/2.5 | 1,597 (+7%) | 1mo | $299,900 | $188 | 65 |
| 1519 Burrwyck Ln | 0.60mi | 3/2.0 | 1,562 (+4%) | 2mo | $320,000 | $205 | 64 |
| 100 Regency Ct | 0.52mi | 3/2.0 | 1,590 (+6%) | 3mo | $389,999 | $245 | 63 |
| 1208 Laclede Dr | 0.65mi | 3/2.0 | 1,642 (+10%) | 4mo | $396,510 | $241 | 50 |
| 1213 Oakholt Ct | 0.73mi | 3/2.0 | 1,298 (-13%) | 2mo | $279,900 | $216 | 42 |
| 1178 Liberty Xing | 0.72mi | 3/3.5 | 1,677 (+12%) | 0mo | $300,000 | $179 | 40 |
Match score weights: distance 35% · size 25% · config 20% · recency 20%. Top-matched comps best support the ARV.
Projected returns pro-forma
-3.0% appreciation · 3.0% rent growth · sell at horizon
- IRR
- -45.2%
- Equity multiple
- -0.38×
- Total profit
- $-152,530
- Equity at exit
- $58,923
- IRR
- -81.7%
- Equity multiple
- -1.22×
- Total profit
- $-245,995
- Equity at exit
- $34,168
Cash invested: $110,651 (down + closing). Projections, not guarantees.
Landlord ↔ Tenant lean methodology
- Overall (STATE)
- 81 Strongly Landlord-Friendly
- State Missouri
- 81 Strongly Landlord-Friendly · R+10
- County
- — inherits STATE
- City
- — inherits STATE
ZIP-level market 63048
- Home prices YoY
- -8.6%
- Active inventory
- 58
- Price-to-rent
- 1.2×
Monthly cashflow live
- Estimated rent
- $2,199 medium interval (Pro) →
- Mortgage (P&I)
- −$2,072
- Tax est. 1.5%
- −$494 /mo · $5,928/yr
- Insurance
- −$165
- HOA
- −$400
- Vacancy / Maint / Mgmt
- −$462
- Net cashflow
- $-1,394
Break-even live
UW: 25.0% down · 7.5% · 30yr · 1.5% tax · 5.0% vac · 8.0% maint · 8.0% mgmt
Financing live
Cash to close
- Down payment
- $98,796
- Closing costs
- $11,855
- Reserves months
- —
- Total cash needed
- —
Loan-product check · same deal, 3 products live
Conventional
25% down · 7.5% · 30yr
- Down + closing
- —
- Monthly P&I
- —
- Monthly cashflow
- —
- DSCR
- —
- Eligible?
- —
Personal DTI + credit; lowest rate.
DSCR
20% down · 8.5% · 30yr
- Down + closing
- —
- Monthly P&I
- —
- Monthly cashflow
- —
- DSCR
- —
- Eligible?
- —
No personal income docs; deal must DSCR.
Hard money
10% down · 12.0% · 12mo
- Down + closing
- —
- Monthly P&I
- —
- Monthly cashflow
- —
- DSCR
- —
- Eligible?
- —
Short-term bridge; refi at stabilization.
Rent comps 1 comps
| Address | Beds | Baths | Sqft | Rent | $/sqft | DOM | Units | Dist |
|---|---|---|---|---|---|---|---|---|
| 102 Doctrine Dr Festus, MO | 3.0 | 2.0 | 1350 | $2,199 | $1.63 | 21d | 1 | 1.47mi |
HOA detail
- Monthly dues
- $400 · $4,800/yr
Listing history 15 events
-
2026-06-18days on market $31,610 Active 357 DOM
-
2026-06-17days on market $31,610 Active 356 DOM
-
2026-06-16days on market $31,610 Active 355 DOM
-
2026-06-15days on market $31,610 Active 354 DOM
-
2026-06-13days on market $31,610 Active 352 DOM
-
2026-06-12days on market $31,610 Active 351 DOM
-
2026-06-09days on market $31,610 Active 348 DOM
-
2026-06-08days on market $31,610 Active 347 DOM
-
2026-06-07days on market $31,610 Active 346 DOM
-
2026-06-07pricedays on market $31,610 Active 345 DOM
-
2026-06-04days on market $310,610 Active 342 DOM
-
2026-06-02days on market $310,610 Active 341 DOM
-
2026-06-01days on market $310,610 Active 340 DOM
-
2026-05-31days on market $310,610 Active 339 DOM
-
2025-06-26$310,610 Active 169-char remark
Show marketing remark (169 chars)
Welcome to KAB Homes! Lots of quality standard features and many options to choose from. Price shown is base price. Photo is similar home and may show optional features.
ⓘ Source: listings_history table (triggers on properties + properties_extension) + one-shot
backfill from property_details.listing_events for pre-trigger history.
Nearby sold comps map
Loading sold comps map…
Walkable amenities ~0.75 mi
Loading nearby amenities…
Taxation est. · year 1
- Rental income
- $26,388
- − Mortgage interest
- −$22,136
- − Property taxes
- −$5,928
- − Insurance
- −$1,976
- − Repairs & maintenance
- −$2,111
- − Management
- −$2,111
- − HOA
- −$4,800
- − Depreciation
- −$11,496
- Taxable loss
- −$24,170
- Est. tax savings @ 24.0%
- +$5,801
- After-tax cash flow
- $-10,925/yr
For passive investors: Depreciation is non-cash, so a rental often shows a tax loss while cash-flowing — sheltering income. Rental losses are passive: they offset passive income freely, and up to $25,000/yr can offset ordinary (W-2) income if you actively participate and your MAGI is under $100k (phasing out to $0 by $150k); unused losses carry forward. On sale, claimed depreciation is recaptured at up to 25%, and gains may owe capital-gains tax (a 1031 exchange can defer both). Figures are a year-1 estimate at your 24.0% rate — not tax advice; consult a CPA.
Schools (NCES district)
- District
- Festus R-VI
- NCES district ID
- 2912030
- Math proficiency
- 55% ▼ -7.00%
- Reading proficiency
- 64% ▼ -1.00%
- Median HH income
- $51,632
- Composite
- 50.79/100
- National rank
- #1808
- State rank
- #16 of 324 in MO
Livability — Herculaneum
- Score
- 59/100
- State rank
- #542
- US rank
- #20094
Category grades
Schools grade is shown separately in the Schools card above.
Census & demographics
- Census place
- Herculaneum, MO
- City population
- 4,143
- Population (ZIP)
- 4,143
Population outlook (Jefferson County) Hauer SSP2
- Today (2025)
- 235,088 people
- By 2030
- 238,365 · +1.4%
- By 2040
- 240,156 · +2.2%
- By 2050
- 234,651 · -0.2%
- By 2075
- 214,569 · -8.7%
- By 2100
- 179,697 · -23.6%
Race, ethnicity, and origin ACS 2023
- Neighborhood character
- Predominantly White (82%)
- Race & ethnicity
- White 82% Two or more races 14% Black 3%
- Common ancestry
- Lithuanian 6% Slovak 5% Iranian 4%
- Foreign-born
- 0%
Political lean MEDSL · Jefferson
- 2024 margin
- Solid R (+36.7) · D 31.0% · R 67.7% · Other 1.3%
- 2008→2024 swing
- -39.3pp toward R · 2008: 2.5pp · 2024: -36.7pp
- All cycles
- 2024: R+36.7 2020: R+33.9 2016: R+35.3 2012: R+12.7 2008: D+2.5
Not yet ingested
- Civics
- —
Market trends
- HPI YoY
- ▼ -22.70%
- Current HPI
- 240.2239
- Rent YoY
- —
- Metro
- —
- State GDP YoY
- ▲ 1.84%
- F500 in state
- 20
Industry mix (Fortune 500 HQ in MO)
| Industry | F500 HQs | Revenue |
|---|---|---|
| Healthcare | 1 | $163B |
|
||
| Insurance | 1 | $21B |
|
||
| Industrial Technology | 1 | $17B |
|
||
| Retail | 1 | $16B |
|
||
| Industrial Distribution | 1 | $10B |
|
||
| Utilities | 1 | $9B |
|
||
Price history
1 event — show timeline
- 2025-06-26 Listed $310,610 Zillow
Cash-flow waterfall
monthlySold comps — $/sqft
last 12 mo · ≤1 miLoading sold comps…