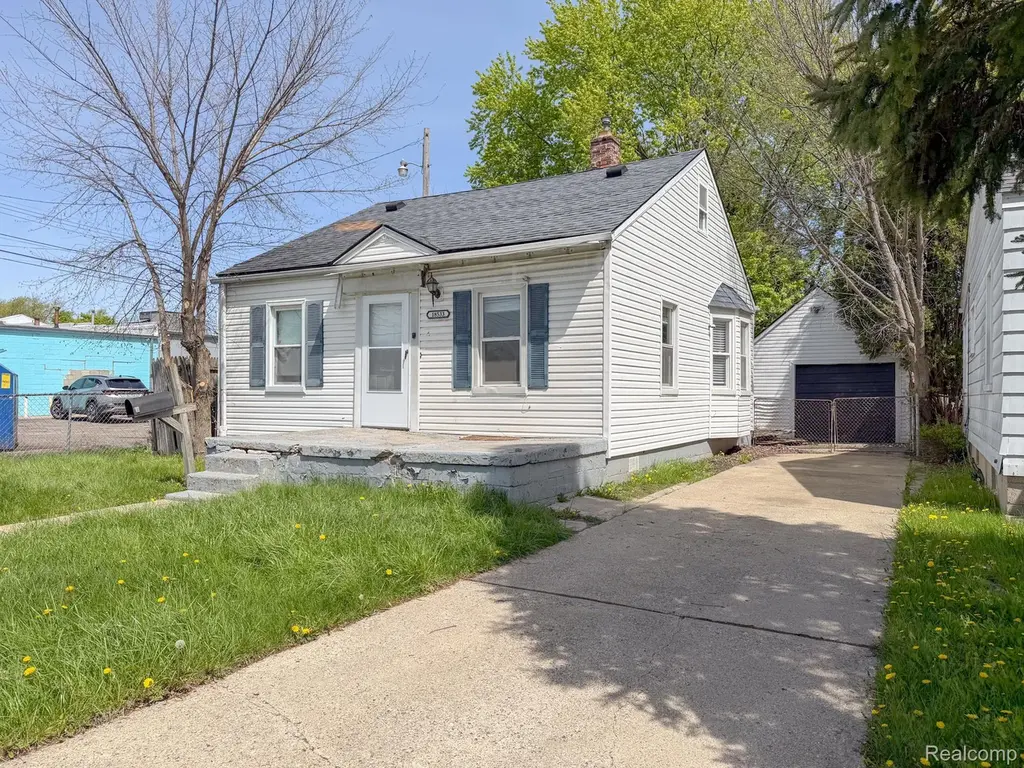
18533 Kenosha St · Harper Woods, MI
Flood risk 1/10 · Minimal
- FEMA flood zone
- X (unshaded)
- Chance of flooding over 30 yrs
- 0.0%
- Est. flood insurance / yr
- $507 – $1,088
Fire risk 1/10 · Minimal
- Est. fire insurance / yr
- $784 – $1,456
Heat risk 3/10 · Minor
- Hot days now (above 95°F)
- 7 days/yr
- Hot days in 30 yrs
- 15 days/yr
Wind risk 2/10 · Minimal
- Chance of severe wind over 30 yrs
- —
Air-quality risk 3/10 · Minor
- Unhealthy air days now
- 3 days/yr
- Unhealthy air days in 30 yrs
- 4 days/yr
Risk factors via First Street. Map © Google.
Why this score? — see what drove the B grade
The composite is a weighted blend of 9 inputs, each scored 0–100. Each bar is that input's sub-score; the figure is the points it added to the 100-point composite (weight × sub-score).
- Cash flow +30.0/30.0
- 1% rule +10.0/10.0
- DSCR +10.0/10.0
- ARV discount +9.9/15.0
- Rent growth +3.8/5.0
- Livability +3.7/5.0
- Condition / age +2.5/5.0
- Schools +0.9/10.0
- Appreciation +0.0/10.0
$62,000
🖨 Deal sheet 📄 Offer letter ✓ Due diligence
Listing remarks MLS
Welcome to 18533 Kenosha Street - an outstanding opportunity for both homeowners and savvy investors. This property offers a spacious layout with great natural light and a solid foundation, ready for your personal touch. The home features comfortable living areas and well-proportioned bedrooms, providing a functional flow throughout. With a little vision and updating, this property has the potential to truly shine. Situated on a nice lot, there is ample outdoor space for entertaining, relaxing, or future improvements. Conveniently located near schools, shopping, and major roadways, making daily living easy and accessible. Whether you're looking to renovate, add to your portfolio, or create your dream home, this property offers strong upside potential. Sold as-is. Buyer to verify all information.
Key facts
- Ample outdoor space
- Natural light
- Solid foundation
Tags
Property features AI
Exterior
- Parking: No garage
- Utilities: Public water; Public sewer
- Home design: Single-family residence; One and a half stories; Ground-level entry with steps
- Construction: Aluminum siding; Asphalt roof
- Exterior features: Paved road access; Lot approximately 0.11 acres (40 x 114)
Interior
- Bathrooms: One full bathroom
- Heating & cooling: Forced air heating (natural gas); No central cooling
- Interior features: Crawl space basement; Five total rooms
Neighborhood map
What this means for you Summary
Snapshot
- This is a 2-bed/1.0-bath single-family listed at $62k.
Deal economics
- At list price, monthly cash flow is $516 ($6k/yr) — positive.
- The deal already cash-flows at list — no discount required.
- Meets the 1% rule at list price ($1k rent vs $62k).
- Recommended offer: $60k (3.0% below list) — sets the bar for market timing.
- Cap rate 16.3% vs local median 7.7% in Harper Woods — top-decile yield for the area; either an underpriced asset or a hidden risk that comps aren't pricing in. Stress-test before assuming the spread holds.
Location & tenants
- Location reads 73/100 on livability (#199 in MI) — a middle-class / working-renter tenant base. Strengths: commute A+, cost of living A+, housing A+; Watch: employment D+, health & safety D+, schools D-.
- Harper Woods School District (suburban): math 4% / reading 15% proficiency, ranked #524 of 540 in MI (top 97%) — low school quality limits family demand, transient renter base, plan for 1-2y turnover; 69% free/reduced lunch — lower-income household profile, screen leases tightly.
- Market conditions: Rents rising fast (+5.1%/yr); 133 active listings in the ZIP; 34 comparable units currently listed for rent nearby; rentals at typical pace (median 18d on market — plan ~3-4 weeks tenant-placement turnaround); 41% of comp listings sitting > 30 days — soft ceiling on asking rent; 2,639 units permitted in Wayne County in 2024 (1,216 in 5+ unit buildings).
Forward outlook
- Local home prices are declining (-3.0%/yr); year-one equity from $429 of loan paydown is wiped out by about $2k of value loss. Plan a longer hold.
- Wayne County population projected at -17% by 2050 — secular population decline; favor cash flow + early exit over multi-decade hold.
- At projected returns (-3.0% appreciation + 5.1% rent growth), your $17k cash investment doubles in ~4 years — after that, you're playing with house money.
Negotiation context
- It's been on market 45 days — a 3% lower offer ($60k) is reasonable based on typical stale-listing flexibility.
- 11 sale attempts since 29y ago with the ask held roughly flat each time — persistent listings suggest the price (not the market) is what's stuck; bring a comps-based counter.
- Current owner paid $8k; list at $62k implies a 727% gain — meaningful room to come down on a strong offer.
Risks & watch-outs
- Watch-outs: built in 1940 — expect roof / HVAC / electrical / plumbing capex.
Questions for the listing agent
- It's been on market 45 days. Have you received any prior offers? Is the seller open to a 3% concession, seller financing, or rate buy-down credit?
- Built in 1940 — when were the roof, HVAC, electrical panel, plumbing, and water heater last replaced?
- Is there a deadline driving the sale (1031 exchange, divorce, estate, relocation)? That informs how much negotiation room exists.
- Schools are D-rated, which usually means shorter tenancies and higher turnover. Who's the typical renter profile here, and what's been the actual vacancy rate?
- Crime grade is F in this area — have there been break-ins, vandalism, or insurance claims at this property in the last 3 years? What carrier currently insures it and at what premium?
- What's the average days-on-market for RENTAL listings here right now (not sales)? A rising rental-DOM trend means longer vacancies and softer asking-rent achievability than the comps imply.
- What's the recent tenant-quality profile in this submarket — average credit score on applications, eviction rate, late-payment / NSF rate, and stable-employment percentage? A property-management company in the area should have these aggregated.
- How much new for-sale + rental construction is in the pipeline within 1–3 miles? Heavy new supply typically softens prices + rents 12–24 months out; constrained supply supports both.
Investment metrics
- 1% rule
- 1.96% ✓
- Cap rate
- 16.28%
- Cash-on-cash
- 35.68%
- DSCR
- 2.59
- GRM
- 4.2
CMA / ARV
- ARV (on-the-fly)
- $65,436
- Comps found
- 12
Show comp detail 12 sales within ~0.75 mi
| Address | Dist | Beds/Ba | Sqft | Sold | Price | $/sf | Match |
|---|---|---|---|---|---|---|---|
| 18591 Kingsville St | 0.12mi | 2/1.0 | 824 (-4%) | 1mo | $74,000 | $90 | 87 |
| 16301 Coram St | 0.12mi | 3/1.0 (+1) | 929 (+8%) | 1mo | $19,500 | $21 | 76 |
| 12897 Riad St | 0.30mi | 3/1.0 (+1) | 831 (-4%) | 1mo | $63,000 | $76 | 74 |
| 18746 Woodside St | 0.18mi | 3/1.0 (+1) | 921 (+7%) | 2mo | $110,000 | $119 | 74 |
| 18567 Woodside Rd | 0.17mi | 2/1.0 | 960 (+12%) | 3mo | $65,000 | $68 | 71 |
| 19381 Kenosha St | 0.52mi | 2/1.0 | 892 (+4%) | 2mo | $104,000 | $117 | 68 |
| 16277 Liberal St | 0.24mi | 3/1.0 (+1) | 945 (+10%) | 1mo | $25,000 | $26 | 67 |
| 16107 Manning St | 0.33mi | 3/1.0 (+1) | 925 (+7%) | 2mo | $61,000 | $66 | 66 |
| 16209 Tacoma St | 0.37mi | 3/1.0 (+1) | 968 (+12%) | 1mo | $62,900 | $65 | 56 |
| 19100 Kingsville St | 0.36mi | 3/1.0 (+1) | 972 (+13%) | 2mo | $110,000 | $113 | 55 |
| 12660 Duchess St | 0.41mi | 3/1.0 (+1) | 974 (+13%) | 2mo | $55,000 | $56 | 53 |
| 16291 Fairmount Dr | 0.54mi | 3/1.0 (+1) | 977 (+14%) | 2mo | $112,000 | $115 | 46 |
Match score weights: distance 35% · size 25% · config 20% · recency 20%. Top-matched comps best support the ARV.
Projected returns pro-forma
-3.0% appreciation · 5.1% rent growth · sell at horizon
- IRR
- 33.8%
- Equity multiple
- 2.47×
- Total profit
- $25,479
- Equity at exit
- $9,244
- IRR
- 41.8%
- Equity multiple
- 5.37×
- Total profit
- $75,879
- Equity at exit
- $5,361
Cash invested: $17,360 (down + closing). Projections, not guarantees.
Landlord ↔ Tenant lean methodology
- Overall (STATE)
- 62 Landlord-Friendly
- State Michigan
- 62 Landlord-Friendly · EVEN
- County
- — inherits STATE
- City
- — inherits STATE
ZIP-level market 48225
- Rents YoY
- 5.1%
- Active inventory
- 133
- Price-to-rent
- 4.2×
Monthly cashflow live
- Estimated rent
- $1,217 high interval (Pro) →
- Mortgage (P&I)
- −$325
- Tax from tax record
- −$95 /mo · $1,135/yr
- Insurance
- −$26
- HOA
- −$0
- Vacancy / Maint / Mgmt
- −$256
- Net cashflow
- $516
Break-even live
UW: 25.0% down · 7.5% · 30yr · 1.5% tax · 5.0% vac · 8.0% maint · 8.0% mgmt
Financing live
Cash to close
- Down payment
- $15,500
- Closing costs
- $1,860
- Reserves months
- —
- Total cash needed
- —
Loan-product check · same deal, 3 products live
Conventional
25% down · 7.5% · 30yr
- Down + closing
- —
- Monthly P&I
- —
- Monthly cashflow
- —
- DSCR
- —
- Eligible?
- —
Personal DTI + credit; lowest rate.
DSCR
20% down · 8.5% · 30yr
- Down + closing
- —
- Monthly P&I
- —
- Monthly cashflow
- —
- DSCR
- —
- Eligible?
- —
No personal income docs; deal must DSCR.
Hard money
10% down · 12.0% · 12mo
- Down + closing
- —
- Monthly P&I
- —
- Monthly cashflow
- —
- DSCR
- —
- Eligible?
- —
Short-term bridge; refi at stabilization.
Rent comps 34 comps
| Address | Beds | Baths | Sqft | Rent | $/sqft | DOM | Units | Dist |
|---|---|---|---|---|---|---|---|---|
| 16241 Seven Mile E Unit 4 Detroit, MI | 1.0 | 1.0 | 650 | $650 | $1.00 | 44d | 1 | 0.15mi |
| 16212 Maddelein St Detroit, MI | 2.0 | 1.0 | 800 | $1,200 | $1.50 | 12d | 1 | 0.16mi |
| 15909 Maddelein St Detroit, MI | 3.0 | 1.0 | 894 | $1,266 | $1.42 | 44d | 1 | 0.31mi |
| 19152 Woodside St Harper Woods, MI | 3.0 | 1.0 | 916 | $1,500 | $1.64 | 17d | 1 | 0.39mi |
| 12716 Riad St Detroit, MI | 3.0 | 1.0 | 974 | $1,275 | $1.31 | 17d | 1 | 0.41mi |
| 19144 Moross Rd Detroit, MI | 2.0 | 1.0 | 900 | $1,050 | $1.17 | 44d | 1 | 0.43mi |
| 12075 Rossiter St Detroit, MI | 3.0 | 1.0 | 1100 | $1,245 | $1.13 | 15d | 1 | 0.54mi |
| 12075 Rossiter St Detroit, MI | 3.0 | 1.0 | 1100 | $1,245 | $1.13 | 44d | 1 | 0.54mi |
| 19442 Kingsville St Harper Woods, MI | 3.0 | 1.0 | 1000 | $1,500 | $1.50 | 17d | 1 | 0.59mi |
| 16291 Eastburn St Detroit, MI | 3.0 | 1.0 | 1000 | $1,364 | $1.36 | 24d | 1 | 0.62mi |
| 19661 Kenosha St Harper Woods, MI | 3.0 | 2.0 | 1000 | $1,400 | $1.40 | 24d | 1 | 0.69mi |
| 19639 Moross Rd Unit 1 Detroit, MI | 2.0 | 1.0 | 900 | $1,100 | $1.22 | 44d | 1 | 0.69mi |
| 12201 Morang Ave Unit 8 Detroit, MI | 2.0 | 1.0 | 610 | $875 | $1.43 | 44d | 1 | 0.70mi |
| 16410 Edmore Dr Detroit, MI | 3.0 | 1.0 | 850 | $1,250 | $1.47 | 15d | 1 | 0.71mi |
| 11776 Rossiter St Detroit, MI | 3.0 | 1.0 | 964 | $1,150 | $1.19 | 11d | 1 | 0.72mi |
| 15494 Mapleridge St Detroit, MI | 3.0 | 1.0 | 937 | $1,275 | $1.36 | 44d | 1 | 0.79mi |
| 11611 Morang Ave Detroit, MI | 1.0–2.0 | 1.0 | 709 | $1,040 | $1.47 | 44d | 1 | 0.81mi |
| 11529 Roxbury St Detroit, MI | 2.0 | 1.0 | 720 | $1,200 | $1.67 | 12d | 1 | 0.82mi |
| 19982 McCormick St Detroit, MI | 3.0 | 1.0 | 866 | $1,200 | $1.39 | 3d | 1 | 0.90mi |
| 15030 Rossini Dr Unit 2 Detroit, MI | 1.0 | 1.0 | 720 | $800 | $1.11 | 44d | 1 | 0.95mi |
| 15663 Carlisle St Detroit, MI | 2.0 | 1.0 | 803 | $1,050 | $1.31 | 15d | 1 | 0.99mi |
| 10985 Peerless St Detroit, MI | 3.0 | 1.0 | 1000 | $1,364 | $1.36 | 5d | 1 | 1.02mi |
| 11235 Roxbury St Detroit, MI | 3.0 | 1.0 | 1062 | $1,325 | $1.25 | 17d | 1 | 1.02mi |
| 10692 Meuse St Detroit, MI | 3.0 | 1.0 | 955 | $1,250 | $1.31 | 12d | 1 | 1.15mi |
| 15010 Cedargrove St Detroit, MI | 3.0 | 1.5 | 1018 | $1,350 | $1.33 | 44d | 1 | 1.20mi |
| 20015 Lochmoor St Harper Woods, MI | 3.0 | 1.0 | 1006 | $1,500 | $1.49 | 17d | 1 | 1.21mi |
| 10400 Britain St Detroit, MI | 3.0 | 1.0 | 890 | $1,100 | $1.24 | 44d | 1 | 1.22mi |
| 14461 Lappin St Detroit, MI | 3.0 | 1.5 | 989 | $1,150 | $1.16 | 17d | 1 | 1.23mi |
| 10370 Britain St Detroit, MI | 3.0 | 1.0 | 1100 | $1,100 | $1.00 | 44d | 1 | 1.24mi |
| 10542 Lanark St Detroit, MI | 3.0 | 1.0 | 1023 | $1,250 | $1.22 | 44d | 1 | 1.27mi |
| 10177 Boleyn St Detroit, MI | 3.0 | 1.0 | 767 | $1,250 | $1.63 | 44d | 1 | 1.33mi |
| 20600 Balfour St Harper Woods, MI | 1.0–2.0 | 1.0–2.0 | 971 | $1,671 | $1.72 | 2d | 12 | 1.38mi |
| 10404 Somerset Ave Detroit, MI | 3.0 | 1.0 | 1108 | $1,475 | $1.33 | 3d | 1 | 1.39mi |
| 10037 Grayton St Detroit, MI | 3.0 | 1.0 | 1000 | $1,400 | $1.40 | 3d | 1 | 1.40mi |
Listing history 40 events
-
2026-06-18days on market $62,000 Active 45 DOM
-
2026-06-17days on market $62,000 Active 44 DOM
-
2026-06-16days on market $62,000 Active 43 DOM
-
2026-06-15days on market $62,000 Active 42 DOM
-
2026-06-13days on market $62,000 Active 40 DOM
-
2026-06-13days on market $62,000 Active 39 DOM
-
2026-06-09days on market $62,000 Active 36 DOM
-
2026-06-08days on market $62,000 Active 35 DOM
-
2026-06-07days on market $62,000 Active 34 DOM
-
2026-06-04days on market $62,000 Active 31 DOM
-
2026-06-03days on market $62,000 Active 30 DOM
-
2026-06-02days on market $62,000 Active 29 DOM
-
2026-06-01days on market $62,000 Active 28 DOM
-
2026-05-31days on market $62,000 Active 27 DOM
-
2026-05-04$62,000 Active 806-char remark
Show marketing remark (806 chars)
Welcome to 18533 Kenosha Street - an outstanding opportunity for both homeowners and savvy investors. This property offers a spacious layout with great natural light and a solid foundation, ready for your personal touch. The home features comfortable living areas and well-proportioned bedrooms, providing a functional flow throughout. With a little vision and updating, this property has the potential to truly shine. Situated on a nice lot, there is ample outdoor space for entertaining, relaxing, or future improvements. Conveniently located near schools, shopping, and major roadways, making daily living easy and accessible. Whether you're looking to renovate, add to your portfolio, or create your dream home, this property offers strong upside potential. Sold as-is. Buyer to verify all information.
-
2026-05-04$62,000 Active
Show marketing remark (806 chars)
Welcome to 18533 Kenosha Street - an outstanding opportunity for both homeowners and savvy investors. This property offers a spacious layout with great natural light and a solid foundation, ready for your personal touch. The home features comfortable living areas and well-proportioned bedrooms, providing a functional flow throughout. With a little vision and updating, this property has the potential to truly shine. Situated on a nice lot, there is ample outdoor space for entertaining, relaxing, or future improvements. Conveniently located near schools, shopping, and major roadways, making daily living easy and accessible. Whether you're looking to renovate, add to your portfolio, or create your dream home, this property offers strong upside potential. Sold as-is. Buyer to verify all information.
-
2012-06-29soldstatus $7,500 463-char remark
Show marketing remark (463 chars)
WOW what a price for this home!!This home is a 3 bed bungalow, 1 full bath and a 1 car garage. Show and sell!Bank of America or Merrill Lynch prequalification required on all offers. Cash sales must have POF. Please allow 2-3 business days for seller response. This prop is sold as is. The EMD is to be a cashiers check held by listing office. Click SHARED FORMS-VIEW DOCS for bank addendums prior to submitting. All docs must be filled out and presented properly
-
2012-06-29soldstatus $7,500
Show marketing remark (463 chars)
WOW what a price for this home!!This home is a 3 bed bungalow, 1 full bath and a 1 car garage. Show and sell!Bank of America or Merrill Lynch prequalification required on all offers. Cash sales must have POF. Please allow 2-3 business days for seller response. This prop is sold as is. The EMD is to be a cashiers check held by listing office. Click SHARED FORMS-VIEW DOCS for bank addendums prior to submitting. All docs must be filled out and presented properly
-
2012-05-08historical
-
2012-02-23$8,250 463-char remark
Show marketing remark (463 chars)
WOW what a price for this home!!This home is a 3 bed bungalow, 1 full bath and a 1 car garage. Show and sell!Bank of America or Merrill Lynch prequalification required on all offers. Cash sales must have POF. Please allow 2-3 business days for seller response. This prop is sold as is. The EMD is to be a cashiers check held by listing office. Click SHARED FORMS-VIEW DOCS for bank addendums prior to submitting. All docs must be filled out and presented properly
-
2012-02-23$8,250
Show marketing remark (463 chars)
WOW what a price for this home!!This home is a 3 bed bungalow, 1 full bath and a 1 car garage. Show and sell!Bank of America or Merrill Lynch prequalification required on all offers. Cash sales must have POF. Please allow 2-3 business days for seller response. This prop is sold as is. The EMD is to be a cashiers check held by listing office. Click SHARED FORMS-VIEW DOCS for bank addendums prior to submitting. All docs must be filled out and presented properly
-
2006-11-16soldstatus $68,900
-
2006-10-06soldstatus $68,900
-
2006-10-06soldstatus $68,900
-
2006-09-16historical
-
2006-09-11$69,900
-
2006-09-11$69,900
-
2006-08-15historical
-
2006-08-15historical
-
2006-03-30$84,900
-
2006-03-30$84,900
-
2006-01-30soldstatus $34,000
-
2005-11-30historical
-
2005-08-24$36,900
-
2005-08-24$44,900
-
1997-12-12soldstatus $55,990
-
1997-08-25soldstatus $55,990
-
1997-06-03historical
-
1997-05-20$52,900
-
1994-04-12soldstatus $33,000
ⓘ Source: listings_history table (triggers on properties + properties_extension) + one-shot
backfill from property_details.listing_events for pre-trigger history.
Tax reassessment forecast MI · Partial reset (capped growth)
- Current annual tax
- $1,135 · $95/mo
- Projected year-2 tax
- $1,135 · $95/mo
- Expected delta
- $0/yr ($0/mo · 0.0%)
ⓘ Screening estimate from a state-policy table — verify with the county assessor before closing.
Climate risk First Street
- Flood 1/10 Low FEMA zone X (unshaded) · 0% chance over 30 yrs
- Wildfire 1/10 Low
- Heat 3/10 Moderate 7 d/yr ≥95°F today · 15 d/yr by 30 yrs out
- Wind 2/10 Low
- Air quality 3/10 Moderate 3 unhealthy d/yr today · 4 by 30 yrs out
Nearby sold comps map
Loading sold comps map…
Walkable amenities ~0.75 mi
Loading nearby amenities…
Taxation est. · year 1
- Rental income
- $14,608
- − Mortgage interest
- −$3,473
- − Property taxes
- −$1,135
- − Insurance
- −$310
- − Repairs & maintenance
- −$1,169
- − Management
- −$1,169
- − Depreciation
- −$1,804
- Taxable income
- $5,549
- Est. tax owed @ 24.0%
- −$1,332
- After-tax cash flow
- $4,862/yr
For passive investors: Depreciation is non-cash, so a rental often shows a tax loss while cash-flowing — sheltering income. Rental losses are passive: they offset passive income freely, and up to $25,000/yr can offset ordinary (W-2) income if you actively participate and your MAGI is under $100k (phasing out to $0 by $150k); unused losses carry forward. On sale, claimed depreciation is recaptured at up to 25%, and gains may owe capital-gains tax (a 1031 exchange can defer both). Figures are a year-1 estimate at your 24.0% rate — not tax advice; consult a CPA.
Schools (NCES district)
- District
- Harper Woods School District
- NCES district ID
- 2617760
- Math proficiency
- 4% ▼ -7.00%
- Reading proficiency
- 15% ▼ -9.00%
- Median HH income
- $46,155
- Composite
- 8.8/100
- National rank
- #9892
- State rank
- #524 of 540 in MI
Livability — Harper Woods
- Score
- 73/100
- State rank
- #199
- US rank
- #5054
Category grades
Schools grade is shown separately in the Schools card above.
Census & demographics
- Census place
- Harper Woods, MI
- County
- Wayne County · 1,562,939 people
- City population
- 572,865
- Metro
- Detroit-Warren-Dearborn, MI
- Population (ZIP)
- 16,098
- Household income
- $61,750
- Rent vs Own
- Severe rent burden
- 410.0
Population outlook (Wayne County) Hauer SSP2
- Today (2025)
- 1,675,273 people
- By 2030
- 1,620,300 · -3.3%
- By 2040
- 1,502,341 · -10.3%
- By 2050
- 1,384,039 · -17.4%
- By 2075
- 1,124,592 · -32.9%
- By 2100
- 881,193 · -47.4%
Race, ethnicity, and origin ACS 2023
- Neighborhood character
- Predominantly Black (65%)
- Race & ethnicity
- Black 65% White 28% Two or more races 4% Hispanic / Latino 1%
- Common ancestry
- Romanian 4% Lithuanian 1% German 1%
- Foreign-born
- 2% · Canada
- Languages at home
- 95% English-only · Arabic 2% Spanish 1%
Political lean MEDSL · Wayne
- 2024 margin
- Strong D (+29.0) · D 62.7% · R 33.7% · Other 3.6%
- 2008→2024 swing
- -20.5pp toward R · 2008: 49.5pp · 2024: 29.0pp
- All cycles
- 2024: D+29.0 2020: D+38.1 2016: D+37.3 2012: D+46.9 2008: D+49.5
Not yet ingested
- Civics
- —
Market trends
- HPI YoY
- ▼ -150.40%
- Current HPI
- 181.4961
- Rent YoY
- ▲ 5.10%
- Metro
- Detroit-Warren-Dearborn, MI
- State GDP YoY
- ▲ 1.37%
- F500 in state
- 28
Industry mix (Fortune 500 HQ in MI)
| Industry | F500 HQs | Revenue |
|---|---|---|
| Automotive Parts | 3 | $48B |
|
||
| Automotive | 2 | $372B |
|
||
| Chemicals | 1 | $45B |
|
||
| Automotive Retail | 1 | $29B |
|
||
| Healthcare / Medical Devices | 1 | $23B |
|
||
| Automotive Technology | 1 | $20B |
|
||
Price history
+87.9% since first listed26 events — show timeline
- 2026-05-04 Listed $62,000 REALCOMP
- 2026-05-04 Listed $62,000 MiRealSource-MiMLS
- 2012-06-29 Sold (MLS) $7,500 MiRealSource-MiMLS
- 2012-06-29 Sold (MLS) $7,500 REALCOMP
- 2012-05-08 Listing Removed — MiRealSource-MiMLS
- 2012-02-23 Listed $8,250 MiRealSource-MiMLS
- 2012-02-23 Listed $8,250 REALCOMP
- 2006-11-16 Sold (Public Records) $68,900 Public Records
- 2006-10-06 Sold (MLS) $68,900 REALCOMP
- 2006-10-06 Sold (MLS) $68,900 MiRealSource-MiMLS
- 2006-09-16 Listing Removed — MiRealSource-MiMLS
- 2006-09-11 Listed $69,900 REALCOMP
- 2006-09-11 Listed $69,900 MiRealSource-MiMLS
- 2006-08-15 Listing Removed — MiRealSource-MiMLS
- 2006-08-15 Listing Removed — REALCOMP
- 2006-03-30 Listed $84,900 MiRealSource-MiMLS
- 2006-03-30 Listed $84,900 REALCOMP
- 2006-01-30 Sold (MLS) $34,000 REALCOMP
- 2005-11-30 Listing Removed — REALCOMP
- 2005-08-24 Listed $44,900 REALCOMP
- 2005-08-24 Listed $36,900 REALCOMP
- 1997-12-12 Sold (Public Records) $55,990 Public Records
- 1997-08-25 Sold (MLS) $55,990 MiRealSource-MiMLS
- 1997-06-03 Listing Removed — MiRealSource-MiMLS
- 1997-05-20 Listed $52,900 MiRealSource-MiMLS
- 1994-04-12 Sold (Public Records) $33,000 Public Records
Property tax history
-4.9%/yrLatest (2025): $1,135 · -46.7% YoY. Source: county tax records.
Cash-flow waterfall
monthlySold comps — $/sqft
last 12 mo · ≤1 miLoading sold comps…