 🏷️ Likely Rental
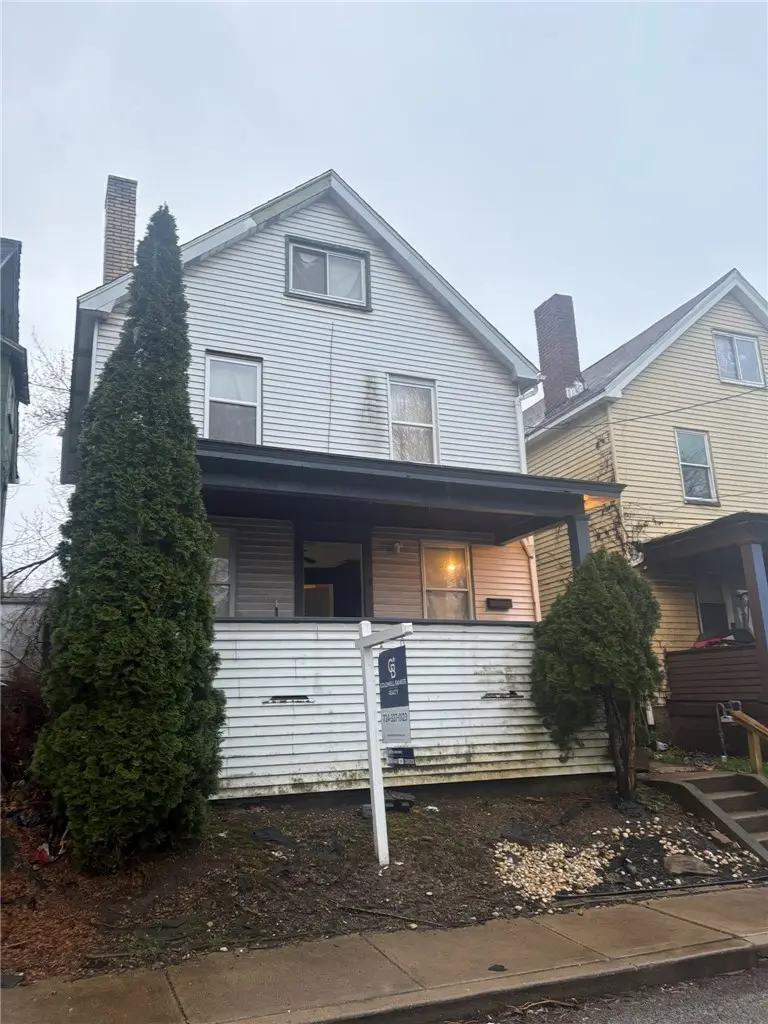
3314 Oakland St · McKeesport, PA
Flood risk 1/10 · Minimal
- FEMA flood zone
- X (unshaded)
- Chance of flooding over 30 yrs
- 0.0%
- Est. flood insurance / yr
- $473 – $860
Fire risk 1/10 · Minimal
- Est. fire insurance / yr
- $511 – $949
Heat risk 4/10 · Minor
- Hot days now (above 97°F)
- 7 days/yr
- Hot days in 30 yrs
- 18 days/yr
Wind risk 2/10 · Minimal
- Chance of severe wind over 30 yrs
- 0.0%
Air-quality risk 5/10 · Moderate
- Unhealthy air days now
- 9 days/yr
- Unhealthy air days in 30 yrs
- 11 days/yr
Risk factors via First Street. Map © Google.
Why this score? — see what drove the B grade
The composite is a weighted blend of 9 inputs, each scored 0–100. Each bar is that input's sub-score; the figure is the points it added to the 100-point composite (weight × sub-score).
- Cash flow +30.0/30.0
- ARV discount +15.0/15.0
- 1% rule +10.0/10.0
- DSCR +10.0/10.0
- Livability +3.3/5.0
- Rent growth +2.5/5.0
- Condition / age +2.5/5.0
- Schools +1.6/10.0
- Appreciation +0.0/10.0
$65,000
🖨 Deal sheet (PDF) 📄 Offer letter ✓ Due diligence
Listing remarks MLS
INVESTMENT OPPORTUNITY IS KNOCKING! This adorable two story is a great add to your investment portfolio. Occupied by a long-term tenant temporarily until their regular home can be occupied again. More pictures are available. Property may be available in the future for owner occupants looking to buy an affordable home.
Key facts
- 2,238 sq ft lot
- Built 1915
- Listed 75 days
Neighborhood map
What this means for you Summary
Snapshot
- This is a 3-bed/1.5-bath single-family listed at $65k.
Deal economics
- At list price, monthly cash flow is $605 ($7k/yr) — positive.
- The deal already cash-flows at list — no discount required.
- Meets the 1% rule at list price ($1k rent vs $65k).
- Recommended offer: $61k (6.0% below list) — sets the bar for market timing.
- Cap rate 17.5% vs local median 10.3% in McKeesport — top-decile yield for the area; either an underpriced asset or a hidden risk that comps aren't pricing in. Stress-test before assuming the spread holds.
Location & tenants
- Location reads 66/100 on livability (#1,089 in PA) — a middle-class / working-renter tenant base. Strengths: commute A+, cost of living A+, housing A+; Watch: schools D+, health & safety D, crime F.
- Mckeesport Area SD (suburban): math 11% / reading 28% proficiency, ranked #499 of 539 in PA (top 93%) — low school quality limits family demand, transient renter base, plan for 1-2y turnover; 66% free/reduced lunch — lower-income household profile, screen leases tightly.
- Market conditions: 113 active listings in the ZIP; 20 comparable units currently listed for rent nearby; rentals at typical pace (median 24d on market — plan ~3-4 weeks tenant-placement turnaround); lower-income renter base — watch delinquency; 2,996 units permitted in Allegheny County in 2024 (1,588 in 5+ unit buildings).
- This rent runs 43% of the median local income ($35k/yr) — at the standard rent-burdened threshold; future hikes will face affordability resistance.
Forward outlook
- Local home prices are declining (-3.0%/yr); year-one equity from $449 of loan paydown is wiped out by about $2k of value loss. Plan a longer hold.
- At projected returns (-3.0% appreciation + 3.0% rent growth), your $18k cash investment doubles in ~3 years — after that, you're playing with house money.
Negotiation context
- It's been on market 75 days — a 6% lower offer ($61k) is reasonable based on typical stale-listing flexibility.
- 3 sale attempts since 11y ago with the ask held roughly flat each time — persistent listings suggest the price (not the market) is what's stuck; bring a comps-based counter.
- Current owner paid $15k; list at $65k implies a 333% gain — meaningful room to come down on a strong offer.
Risks & watch-outs
- Watch-outs: built in 1915 — expect roof / HVAC / electrical / plumbing capex.
Questions for the listing agent
- It's been on market 75 days. Have you received any prior offers? Is the seller open to a 6% concession, seller financing, or rate buy-down credit?
- Built in 1915 — when were the roof, HVAC, electrical panel, plumbing, and water heater last replaced?
- Why hasn't it sold? Are there any deal-killer items the seller is aware of (foundation, flood, title, zoning, code violations)?
- Is there a deadline driving the sale (1031 exchange, divorce, estate, relocation)? That informs how much negotiation room exists.
- Schools are D-rated, which usually means shorter tenancies and higher turnover. Who's the typical renter profile here, and what's been the actual vacancy rate?
- Crime grade is F in this area — have there been break-ins, vandalism, or insurance claims at this property in the last 3 years? What carrier currently insures it and at what premium?
- What's the average days-on-market for RENTAL listings here right now (not sales)? A rising rental-DOM trend means longer vacancies and softer asking-rent achievability than the comps imply.
- What's the recent tenant-quality profile in this submarket — average credit score on applications, eviction rate, late-payment / NSF rate, and stable-employment percentage? A property-management company in the area should have these aggregated.
- How much new for-sale + rental construction is in the pipeline within 1–3 miles? Heavy new supply typically softens prices + rents 12–24 months out; constrained supply supports both.
Investment metrics
- 1% rule
- 1.93% ✓
- Cap rate
- 17.46%
- Cash-on-cash
- 39.89%
- DSCR
- 2.77
- GRM
- 4.3
CMA / ARV
- ARV (median comp)
- $90,222
- List price
- $65,000
- Delta
- -27.96%
- Verdict
- UNDERPRICED
- Comps
- 20 within 1.0 mi
Show comp detail 12 sales within ~0.75 mi
| Address | Dist | Beds/Ba | Sqft | Sold | Price | $/sf | Match |
|---|---|---|---|---|---|---|---|
| 3300 Stewart St | 0.19mi | 3/1.5 | 1,558 (+9%) | 3mo | $60,000 | $39 | 73 |
| 3806 Sarah St | 0.37mi | 3/1.0 | 1,324 (-7%) | 0mo | $129,900 | $98 | 68 |
| 2316 Collins St | 0.62mi | 3/1.5 | 1,485 (+4%) | 4mo | $127,000 | $86 | 61 |
| 1002 Summit St | 0.71mi | 3/2.0 | 1,462 (+2%) | 2mo | $157,000 | $107 | 59 |
| 1310 Pirl St | 0.32mi | 3/1.0 | 1,270 (-11%) | 7mo | $55,000 | $43 | 59 |
| 1217 Scott St | 0.47mi | 4/1.0 (+1) | 1,500 (+5%) | 6mo | $55,000 | $37 | 58 |
| 1813 Duquesne Ave | 0.56mi | 3/1.5 | 1,560 (+9%) | 2mo | $149,900 | $96 | 57 |
| 1819 Scott St | 0.61mi | 4/1.0 (+1) | 1,450 (+1%) | 6mo | $103,000 | $71 | 57 |
| 3021 Myer Blvd | 0.54mi | 3/1.0 | 1,296 (-9%) | 7mo | $118,000 | $91 | 51 |
| 473 Mccully St | 0.57mi | 3/1.5 | 1,260 (-12%) | 3mo | $206,000 | $163 | 51 |
| 2405 Harrison St | 0.65mi | 3/2.5 | 1,320 (-8%) | 8mo | $21,000 | $16 | 47 |
| 2817 Jenny Lind St | 0.53mi | 2/1.0 (-1) | 1,232 (-14%) | 2mo | $51,033 | $41 | 44 |
Match score weights: distance 35% · size 25% · config 20% · recency 20%. Top-matched comps best support the ARV.
Projected returns pro-forma
-3.0% appreciation · 3.0% rent growth · sell at horizon
- IRR
- 36.2%
- Equity multiple
- 2.54×
- Total profit
- $27,979
- Equity at exit
- $9,692
- IRR
- 42.9%
- Equity multiple
- 5.06×
- Total profit
- $73,898
- Equity at exit
- $5,620
Cash invested: $18,200 (down + closing). Projections, not guarantees.
Landlord ↔ Tenant lean methodology
- Overall (STATE)
- 62 Landlord-Friendly
- State Pennsylvania
- 62 Landlord-Friendly · EVEN
- County
- — inherits STATE
- City
- — inherits STATE
ZIP-level market 15132
- Home prices YoY
- -32.9%
- Active inventory
- 113
- Price-to-rent
- 4.3×
Monthly cashflow live
- Estimated rent
- $1,254 high interval (Pro) →
- Mortgage (P&I)
- −$341
- Tax from tax record
- −$18 /mo · $211/yr
- Insurance
- −$27
- HOA
- −$0
- Vacancy / Maint / Mgmt
- −$263
- Net cashflow
- $605
Break-even live
Sensitivity live
| Price | -10% $642 | -5% $623 | +0% $605 | +5% $587 | +10% $568 |
|---|---|---|---|---|---|
| Rent | -10% $506 | -5% $555 | +0% $605 | +5% $655 | +10% $704 |
| Rate | -1.0pp $638 | -0.5pp $622 | base $605 | +0.5pp $588 | +1.0pp $571 |
UW: 25.0% down · 7.5% · 30yr · 1.5% tax · 5.0% vac · 8.0% maint · 8.0% mgmt
Financing live
Cash to close
- Down payment
- $16,250
- Closing costs
- $1,950
- Reserves months
- —
- Total cash needed
- —
Loan-product check · same deal, 3 products live
Conventional
25% down · 7.5% · 30yr
- Down + closing
- —
- Monthly P&I
- —
- Monthly cashflow
- —
- DSCR
- —
- Eligible?
- —
Personal DTI + credit; lowest rate.
DSCR
20% down · 8.5% · 30yr
- Down + closing
- —
- Monthly P&I
- —
- Monthly cashflow
- —
- DSCR
- —
- Eligible?
- —
No personal income docs; deal must DSCR.
Hard money
10% down · 12.0% · 12mo
- Down + closing
- —
- Monthly P&I
- —
- Monthly cashflow
- —
- DSCR
- —
- Eligible?
- —
Short-term bridge; refi at stabilization.
Rent comps 20 comps
| Address | Beds | Baths | Sqft | Rent | $/sqft | DOM | Units | Dist |
|---|---|---|---|---|---|---|---|---|
| 1114-1116 Ohio St Unit 2R McKeesport, PA | 2.0 | 1.0 | 878 | $850 | $0.97 | 16d | 1 | 0.16mi |
| 1506 Freemont St McKeesport, PA | 3.0 | 2.0 | 1250 | $1,295 | $1.04 | 24d | 1 | 0.29mi |
| 3710 Mayfair St McKeesport, PA | 3.0 | 1.5 | 1314 | $1,095 | $0.83 | 3d | 1 | 0.39mi |
| 3506 Mayfair St Unit B McKeesport, PA | 2.0 | 1.0 | 948 | $1,200 | $1.27 | 44d | 1 | 0.40mi |
| 1217 Scott St McKeesport, PA | 3.0 | 1.0 | 1500 | $1,165 | $0.78 | 44d | 1 | 0.46mi |
| 2807 Beaver St McKeesport, PA | 4.0 | 2.0 | 1700 | $1,200 | $0.71 | 44d | 1 | 0.46mi |
| 1108 Prescott St White Oak, PA | 2.0 | 1.0 | 945 | $1,200 | $1.27 | 13d | 1 | 0.62mi |
| 2408 McCarrell St McKeesport, PA | 4.0 | 1.0 | 1430 | $1,195 | $0.84 | 24d | 1 | 0.64mi |
| 2212 Cronemeyer St McKeesport, PA | 3.0 | 1.0 | 1720 | $1,375 | $0.80 | 44d | 1 | 0.69mi |
| 311-313 24th St McKeesport, PA | 2.0 | 1.0 | 950 | $900 | $0.95 | 44d | 1 | 0.91mi |
| 1507 Carnegie Ave McKeesport, PA | 3.0 | 1.5 | 1600 | $1,699 | $1.06 | 15d | 1 | 0.93mi |
| 3211 Walnut St McKeesport, PA | 4.0 | 1.0 | 1434 | $1,500 | $1.05 | 8d | 1 | 1.04mi |
| 1451 Jenny Lind St McKeesport, PA | 3.0 | 1.5 | 1408 | $1,150 | $0.82 | 24d | 1 | 1.09mi |
| 604 Shaw Ave McKeesport, PA | 2.0 | 1.0–1.5 | 800 | $900 | $1.12 | 13d | 3 | 1.16mi |
| 604 Shaw Ave Unit 101 McKeesport, PA | 2.0 | 1.5 | 1050 | $900 | $0.86 | 15d | 1 | 1.16mi |
| 2618 Poinsettia Dr White Oak, PA | 4.0 | 1.0 | 1225 | $1,599 | $1.31 | 24d | 1 | 1.25mi |
| 2710 Henderson Rd White Oak, PA | 3.0 | 1.5 | 1676 | $1,675 | $1.00 | 2d | 1 | 1.29mi |
| 1735 Ohio Ave Unit 6 White Oak, PA | 3.0 | 1.0 | 1034 | $1,200 | $1.16 | 44d | 1 | 1.30mi |
| 1318 Maryland Ave West Mifflin, PA | 3.0 | 1.0 | 1408 | $1,695 | $1.20 | 44d | 1 | 1.46mi |
| 152 Royal Oak Dr White Oak, PA | 1.0–2.0 | 1.0–2.0 | 930 | $1,445 | $1.55 | 2d | 9 | 1.46mi |
Listing history 19 events
-
2026-06-18days on market $65,000 Active 75 DOM
-
2026-06-17days on market $65,000 Active 74 DOM
-
2026-06-16days on market $65,000 Active 73 DOM
-
2026-06-15days on market $65,000 Active 72 DOM
-
2026-06-13days on market $65,000 Active 70 DOM
-
2026-06-13days on market $65,000 Active 69 DOM
-
2026-06-09days on market $65,000 Active 66 DOM
-
2026-06-08days on market $65,000 Active 65 DOM
-
2026-06-07days on market $65,000 Active 64 DOM
-
2026-06-03days on market $65,000 Active 60 DOM
-
2026-06-02days on market $65,000 Active 59 DOM
-
2026-06-01days on market $65,000 Active 58 DOM
-
2026-05-31days on market $65,000 Active 57 DOM
-
2026-04-01$65,000 Active 320-char remark
Show marketing remark (320 chars)
INVESTMENT OPPORTUNITY IS KNOCKING! This adorable two story is a great add to your investment portfolio. Occupied by a long-term tenant temporarily until their regular home can be occupied again. More pictures are available. Property may be available in the future for owner occupants looking to buy an affordable home.
-
2025-09-16historical Expired 231-char remark
Show marketing remark (231 chars)
Add to your rental portfolio with this great opportunity to own this great 4 bedroom 1 bathroom home that is a great cash flow investment property! Also has a NEW furnace! Walking distance to Uni-Mart and McKeesport High School.
-
2024-09-17$59,000 Active 231-char remark
Show marketing remark (231 chars)
Add to your rental portfolio with this great opportunity to own this great 4 bedroom 1 bathroom home that is a great cash flow investment property! Also has a NEW furnace! Walking distance to Uni-Mart and McKeesport High School.
-
2015-10-29historical
-
2015-04-10$15,000 Active
-
2006-01-11soldstatus $15,000
ⓘ Source: listings_history table (triggers on properties + properties_extension) + one-shot
backfill from property_details.listing_events for pre-trigger history.
Tax reassessment forecast PA · Partial reset (capped growth)
- Current annual tax
- $211 · $18/mo
- Projected year-2 tax
- $619 · $52/mo
- Expected delta
- +$408/yr (+$34/mo · 193.7%)
ⓘ Screening estimate from a state-policy table — verify with the county assessor before closing.
Climate risk First Street
- Flood 1/10 Low FEMA zone X (unshaded) · 0% chance over 30 yrs
- Wildfire 1/10 Low
- Heat 4/10 Moderate 7 d/yr ≥97°F today · 18 d/yr by 30 yrs out
- Wind 2/10 Low 0% chance of damaging wind over 30 yrs
- Air quality 5/10 Major 9 unhealthy d/yr today · 11 by 30 yrs out
Nearby sold comps map
Loading sold comps map…
Walkable amenities ~0.75 mi
Loading nearby amenities…
Taxation est. · year 1
- Rental income
- $15,046
- − Mortgage interest
- −$3,641
- − Property taxes
- −$211
- − Insurance
- −$325
- − Repairs & maintenance
- −$1,204
- − Management
- −$1,204
- − Depreciation
- −$1,891
- Taxable income
- $6,571
- Est. tax owed @ 24.0%
- −$1,577
- After-tax cash flow
- $5,683/yr
For passive investors: Depreciation is non-cash, so a rental often shows a tax loss while cash-flowing — sheltering income. Rental losses are passive: they offset passive income freely, and up to $25,000/yr can offset ordinary (W-2) income if you actively participate and your MAGI is under $100k (phasing out to $0 by $150k); unused losses carry forward. On sale, claimed depreciation is recaptured at up to 25%, and gains may owe capital-gains tax (a 1031 exchange can defer both). Figures are a year-1 estimate at your 24.0% rate — not tax advice; consult a CPA.
Schools (NCES district)
- District
- Mckeesport Area SD
- NCES district ID
- 4214940
- Math proficiency
- 11% ▼ -9.00%
- Reading proficiency
- 28% ▼ -10.00%
- Median HH income
- $33,779
- Composite
- 15.88/100
- National rank
- #9257
- State rank
- #499 of 539 in PA
Livability — McKeesport
- Score
- 66/100
- State rank
- #1089
- US rank
- #12321
Category grades
Schools grade is shown separately in the Schools card above.
Census & demographics
- Census place
- McKeesport, PA
- County
- Allegheny County · 1,022,028 people
- City population
- 25,010
- Metro
- Pittsburgh, PA
- Population (ZIP)
- 18,898
- Household income
- $35,397
- Rent vs Own
- Severe rent burden
- 1239.0
Population outlook (Allegheny County) Hauer SSP2
- Today (2025)
- 1,250,282 people
- By 2030
- 1,256,482 · +0.5%
- By 2040
- 1,256,318 · +0.5%
- By 2050
- 1,244,169 · -0.5%
- By 2075
- 1,197,693 · -4.2%
- By 2100
- 1,093,187 · -12.6%
Race, ethnicity, and origin ACS 2023
- Neighborhood character
- Diverse neighborhood (Simpson 0.62)
- Race & ethnicity
- White 50% Black 35% Two or more races 10% Hispanic / Latino 4% Asian 1%
- Common ancestry
- Romanian 5% Serbian 2% Scotch-Irish 2%
- Foreign-born
- 2% · Canada, China
- Languages at home
- 96% English-only · Spanish 3%
Political lean MEDSL · Allegheny
- 2024 margin
- Strong D (+20.3) · D 59.7% · R 39.4%
- 2008→2024 swing
- +4.8pp toward D · 2008: 15.5pp · 2024: 20.3pp
- All cycles
- 2024: D+20.3 2020: D+20.4 2016: D+16.4 2012: D+14.4 2008: D+15.5
Not yet ingested
- Civics
- —
Market trends
- HPI YoY
- ▼ -71.01%
- Current HPI
- 145.195
- Rent YoY
- —
- Metro
- Pittsburgh, PA
- State GDP YoY
- ▲ 1.68%
- F500 in state
- 34
Industry mix (Fortune 500 HQ in PA)
| Industry | F500 HQs | Revenue |
|---|---|---|
| Healthcare | 2 | $309B |
|
||
| Insurance | 2 | $27B |
|
||
| Telecommunications / Media | 1 | $124B |
|
||
| Industrial Distribution | 1 | $22B |
|
||
| Financial Services | 1 | $20B |
|
||
| Chemicals / Materials | 1 | $18B |
|
||
Price history
+333.3% since first listed6 events — show timeline
- 2026-04-01 Listed $65,000 West Penn MLS
- 2025-09-16 Delisted — West Penn MLS
- 2024-09-17 Listed $59,000 West Penn MLS
- 2015-10-29 Delisted — West Penn MLS
- 2015-04-10 Listed $15,000 West Penn MLS
- 2006-01-11 Sold (Public Records) $15,000 Public Records
Property tax history
-11.1%/yrLatest (2026): $211 · +0.0% YoY. Source: county tax records.
Cash-flow waterfall
monthlySold comps — $/sqft
last 12 mo · ≤1 miLoading sold comps…