 Multi-family
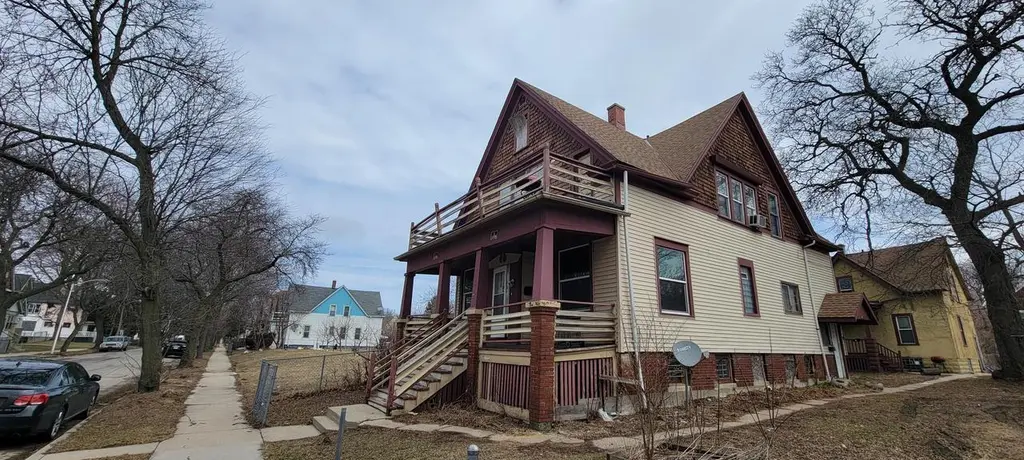
3154 N 12th St Unit 3154A · Milwaukee, WI
Flood risk 5/10 · Moderate
- FEMA flood zone
- X (unshaded)
- Chance of flooding over 30 yrs
- 0.66%
- Est. flood insurance / yr
- $473 – $860
Fire risk 1/10 · Minimal
- Est. fire insurance / yr
- $636 – $1,182
Heat risk 2/10 · Minimal
- Hot days now (above 98°F)
- 7 days/yr
- Hot days in 30 yrs
- 13 days/yr
Wind risk 2/10 · Minimal
- Chance of severe wind over 30 yrs
- —
Air-quality risk 3/10 · Minor
- Unhealthy air days now
- 3 days/yr
- Unhealthy air days in 30 yrs
- 4 days/yr
Risk factors via First Street. Map © Google.
Why this score? — see what drove the B grade
The composite is a weighted blend of 9 inputs, each scored 0–100. Each bar is that input's sub-score; the figure is the points it added to the 100-point composite (weight × sub-score).
- Cash flow +25.7/30.0
- Appreciation +10.0/10.0
- DSCR +8.5/10.0
- ARV discount +7.5/15.0
- 1% rule +6.8/10.0
- Rent growth +4.6/5.0
- Livability +4.0/5.0
- Condition / age +2.5/5.0
- Schools +1.2/10.0
$200,000
🖨 Deal sheet (PDF) 📄 Offer letter ✓ Due diligence
Multi-family units
County records classify this as Multi-Family (2-4 Unit). Listing-text estimate: 1 unit. estimate disagrees with records
Listing remarks MLS
There is a single family 1.5 story, 1,204 sq ft cottage located on this property and is included with the sale of the duplex. This property qualifies for the NSP program. Additional information can be found on the City of Milwaukee website.
Key facts
- 5,227 sq ft lot
- Built 1900
- Listed 83 days
Property features AI
Exterior
- Parking: Inside parking available; Outside parking available
- Utilities: Municipal water; Municipal sewer
- Home design: Multi-family building (Duplex+); 1–2 stories; Zoned RT4 Residential; Lot smaller than 1/2 acre (approximately 0.12 acre)
- Construction: Assessor/public record for year built
- Exterior features: Stucco/slate and wood exterior; Other exterior materials
Interior
- Kitchen: Three stoves included; Three refrigerators included
- Bedrooms: 3 units (multi-family property)
- Heating & cooling: Natural gas heating
- Interior features: Full basement
Neighborhood map
What this means for you Summary
Snapshot
- This is a multifamily listed at $200k.
Deal economics
- At list price, monthly cash flow is $477 ($6k/yr) — positive.
- The deal already cash-flows at list — no discount required.
- Meets the 1% rule at list price ($2k rent vs $200k).
- Recommended offer: $188k (6.0% below list) — sets the bar for market timing.
- Cap rate 9.2% vs local median 5.1% in Milwaukee — top-decile yield for the area; either an underpriced asset or a hidden risk that comps aren't pricing in. Stress-test before assuming the spread holds.
Location & tenants
- Location reads 81/100 on livability (#55 in WI, #1,534 nationally) — a professional / high-income tenant draw. Strengths: amenities A+, commute A+, cost of living A+; Watch: employment D+, schools F, crime F.
- Milwaukee School District (urban): math 10% / reading 18% proficiency, ranked #337 of 342 in WI (top 98%) — low school quality limits family demand, transient renter base, plan for 1-2y turnover; 77% free/reduced lunch — lower-income household profile, screen leases tightly.
- Market conditions: Rents rising fast (+8.3%/yr); 160 active listings in the ZIP; 3 comparable units currently listed for rent nearby; rentals lingering (median 46d on market — plan ~5-8 weeks vacancy on turnover, expect pricing pressure); 67% of comp listings sitting > 30 days — soft ceiling on asking rent; lower-income renter base — watch delinquency; 1,017 units permitted in Milwaukee County in 2024 (803 in 5+ unit buildings).
- At $2,353/mo this rent would consume 96% of the median local household income ($29k/yr) (locally 2061% of renters already pay >50% of income on rent) — very limited rent-growth headroom before tenants either downsize or default.
Forward outlook
- In year one you build about $21k of equity ($1k loan paydown + $20k appreciation (10.0% local appreciation)).
- Milwaukee County population projected at +4% by 2050 — modest demand growth; plan on rents tracking national, not racing it.
- At projected returns (10.0% appreciation + 8.0% rent growth), your $56k cash investment doubles in ~2 years — after that, you're playing with house money.
- By year 2, paydown + projected appreciation supports a ~$34k cash-out refi (75% LTV) — recoverable capital for the next deal without selling this one.
Negotiation context
- It's been on market 84 days — a 6% lower offer ($188k) is reasonable based on typical stale-listing flexibility.
- 3 sale attempts since 14y ago; this cycle's ask has dropped $30k (13%) from the opening price — seller is motivated, your offer sets the floor, not the list.
Risks & watch-outs
- Watch-outs: built in 1900 — expect roof / HVAC / electrical / plumbing capex.
- Climate carrying-cost: moderate flood risk — expect insurance premiums to compound above CPI over the hold.
Questions for the listing agent
- It's been on market 84 days. Have you received any prior offers? Is the seller open to a 6% concession, seller financing, or rate buy-down credit?
- Built in 1900 — when were the roof, HVAC, electrical panel, plumbing, and water heater last replaced?
- Why hasn't it sold? Are there any deal-killer items the seller is aware of (foundation, flood, title, zoning, code violations)?
- Is there a deadline driving the sale (1031 exchange, divorce, estate, relocation)? That informs how much negotiation room exists.
- Schools are F-rated, which usually means shorter tenancies and higher turnover. Who's the typical renter profile here, and what's been the actual vacancy rate?
- Crime grade is F in this area — have there been break-ins, vandalism, or insurance claims at this property in the last 3 years? What carrier currently insures it and at what premium?
- What's the average days-on-market for RENTAL listings here right now (not sales)? A rising rental-DOM trend means longer vacancies and softer asking-rent achievability than the comps imply.
- What's the recent tenant-quality profile in this submarket — average credit score on applications, eviction rate, late-payment / NSF rate, and stable-employment percentage? A property-management company in the area should have these aggregated.
- How much new apartment / multifamily construction is in the pipeline within 1–3 miles? Heavy new supply (>2% of stock underway) typically softens rents 12–24 months out; light construction supports rent growth.
Investment metrics
- 1% rule
- 1.18% ✓
- Cap rate
- 9.15%
- Cash-on-cash
- 10.22%
- DSCR
- 1.45
- GRM
- 7.1
CMA / ARV
- ARV (on-the-fly)
- $132,616
- Comps found
- 12
Show comp detail 12 sales within ~0.75 mi
| Address | Dist | Beds/Ba | Sqft | Sold | Price | $/sf | Match |
|---|---|---|---|---|---|---|---|
| 2910 N 11th St #2912 | 0.31mi | 6/2.0 | 2,621 (-13%) | 2mo | $105,382 | $40 | 63 |
| 3345 N Vel R Phillips Ave #3347 | 0.59mi | 6/2.0 | 2,894 (-4%) | 5mo | $140,000 | $48 | 62 |
| 3252 N 10th St #3254 | 0.17mi | 6/2.0 | 2,588 (-14%) | 9mo | $185,000 | $71 | 61 |
| 3123 N 2nd St Unit 3123 A | 0.66mi | 4/2.0 | 2,847 (-6%) | 1mo | $84,000 | $30 | 59 |
| 3004 N 11th St #3006 | 0.20mi | 6/2.0 | 2,602 (-14%) | 11mo | $175,000 | $67 | 59 |
| 2817 N 18th St #2819 | 0.66mi | 7/2.0 | 2,720 (-10%) | 3mo | $10,000 | $4 | 51 |
| 2931 N 2nd St #2933 | 0.72mi | 8/2.0 | 3,146 (+4%) | 11mo | $115,000 | $37 | 50 |
| 2920 N 11th St #2922 | 0.30mi | 6/2.0 | 2,645 (-12%) | 22mo | $46,100 | $17 | 47 |
| 2758 N 10th St #2760 | 0.50mi | 6/2.0 | 2,682 (-11%) | 15mo | $118,500 | $44 | 45 |
| 3260 N 21st St | 0.65mi | 8/2.0 | 2,624 (-13%) | 7mo | $80,000 | $30 | 42 |
| 3279 N 21st St Unit 3279B | 0.67mi | 9/3.0 | 2,600 (-14%) | 17mo | $175,000 | $67 | 31 |
| 2865 N 2nd St #2867 | 0.75mi | 4/2.0 | 2,593 (-14%) | 19mo | $117,500 | $45 | 26 |
Match score weights: distance 35% · size 25% · config 20% · recency 20%. Top-matched comps best support the ARV.
Projected returns pro-forma
10.0% appreciation · 8.0% rent growth · sell at horizon
- IRR
- 34.0%
- Equity multiple
- 3.71×
- Total profit
- $151,758
- Equity at exit
- $180,176
- IRR
- 31.1%
- Equity multiple
- 9.11×
- Total profit
- $453,903
- Equity at exit
- $388,556
Cash invested: $56,000 (down + closing). Projections, not guarantees.
Landlord ↔ Tenant lean methodology
- Overall (STATE)
- 73 Landlord-Friendly
- State Wisconsin
- 73 Landlord-Friendly · R+2
- County
- — inherits STATE
- City
- — inherits STATE
ZIP-level market 53206
- Rents YoY
- 8.3%
- Active inventory
- 160
- Price-to-rent
- 14.2×
Monthly cashflow live
- Estimated rent
- $2,353 high interval (Pro) →
- Mortgage (P&I)
- −$1,049
- Tax est. 1.5%
- −$250 /mo · $3,000/yr
- Insurance
- −$83
- HOA
- −$0
- Vacancy / Maint / Mgmt
- −$494
- Net cashflow
- $477
Break-even live
Sensitivity live
| Price | -10% $615 | -5% $546 | +0% $477 | +5% $408 | +10% $338 |
|---|---|---|---|---|---|
| Rent | -10% $291 | -5% $384 | +0% $477 | +5% $570 | +10% $663 |
| Rate | -1.0pp $577 | -0.5pp $528 | base $477 | +0.5pp $425 | +1.0pp $372 |
2-unit breakdown (identical units grouped — click to expand)
| Units | Beds | Baths | Est. rent |
|---|---|---|---|
| 2× units | 2 | 1.5 | $2,352 |
| #1 | 2 | 1.5 | $1,176 |
| #2 | 2 | 1.5 | $1,176 |
| Total (2 units) | $2,353 | ||
UW: 25.0% down · 7.5% · 30yr · 1.5% tax · 5.0% vac · 8.0% maint · 8.0% mgmt
Financing live
Cash to close
- Down payment
- $50,000
- Closing costs
- $6,000
- Reserves months
- —
- Total cash needed
- —
Loan-product check · same deal, 3 products live
Conventional
25% down · 7.5% · 30yr
- Down + closing
- —
- Monthly P&I
- —
- Monthly cashflow
- —
- DSCR
- —
- Eligible?
- —
Personal DTI + credit; lowest rate.
DSCR
20% down · 8.5% · 30yr
- Down + closing
- —
- Monthly P&I
- —
- Monthly cashflow
- —
- DSCR
- —
- Eligible?
- —
No personal income docs; deal must DSCR.
Hard money
10% down · 12.0% · 12mo
- Down + closing
- —
- Monthly P&I
- —
- Monthly cashflow
- —
- DSCR
- —
- Eligible?
- —
Short-term bridge; refi at stabilization.
Rent comps 3 comps
| Address | Beds | Baths | Sqft | Rent | $/sqft | DOM | Units | Dist |
|---|---|---|---|---|---|---|---|---|
| 912 W Hadley St Milwaukee, WI | 2.0 | 1.0 | 2222 | $1,250 | $0.56 | 16d | 1 | 0.46mi |
| 3420-22 N Vel R Phillips Ave Milwaukee, WI | 3.0 | 1.0 | 2756 | $1,195 | $0.43 | 45d | 1 | 0.65mi |
| 3420 N Vel R. Phillips Ave Unit 3422 Milwaukee, WI | 3.0 | 1.0 | 2756 | $1,195 | $0.43 | 45d | 1 | 0.65mi |
Listing history 23 events
-
2026-06-21days on market $200,000 Active 84 DOM
-
2026-06-18days on market $200,000 Active 81 DOM
-
2026-06-17days on market $200,000 Active 80 DOM
-
2026-06-16days on market $200,000 Active 79 DOM
-
2026-06-15days on market $200,000 Active 78 DOM
-
2026-06-13remarks 383-char remark
-
2026-06-13pricedays on market $200,000 Active 76 DOM
-
2026-06-13days on market $210,000 Active 75 DOM
-
2026-06-09days on market $210,000 Active 72 DOM
-
2026-06-08days on market $210,000 Active 71 DOM
-
2026-06-07days on market $210,000 Active 70 DOM
-
2026-06-05days on market $210,000 Active 67 DOM
-
2026-06-03days on market $210,000 Active 66 DOM
-
2026-06-02days on market $210,000 Active 65 DOM
-
2026-06-01days on market $210,000 Active 64 DOM
-
2026-05-31days on market $210,000 Active 63 DOM
-
2026-05-19price $210,000
-
2026-04-29price $220,000
-
2026-03-27$230,000 Active
-
2024-06-29historical $845
-
2024-04-10$845
-
2012-05-16$10,500 240-char remark
Show marketing remark (240 chars)
There is a single family 1.5 story, 1,204 sq ft cottage located on this property and is included with the sale of the duplex. This property qualifies for the NSP program. Additional information can be found on the City of Milwaukee website.
-
2012-05-16historical 240-char remark
Show marketing remark (240 chars)
There is a single family 1.5 story, 1,204 sq ft cottage located on this property and is included with the sale of the duplex. This property qualifies for the NSP program. Additional information can be found on the City of Milwaukee website.
ⓘ Source: listings_history table (triggers on properties + properties_extension) + one-shot
backfill from property_details.listing_events for pre-trigger history.
Climate risk First Street
- Flood 5/10 Major FEMA zone X (unshaded) · 66% chance over 30 yrs
- Wildfire 1/10 Low
- Heat 2/10 Low 7 d/yr ≥98°F today · 13 d/yr by 30 yrs out
- Wind 2/10 Low
- Air quality 3/10 Moderate 3 unhealthy d/yr today · 4 by 30 yrs out
Nearby sold comps map
Loading sold comps map…
Walkable amenities ~0.75 mi
Loading nearby amenities…
Taxation est. · year 1
- Rental income
- $28,236
- − Mortgage interest
- −$11,203
- − Property taxes
- −$3,000
- − Insurance
- −$1,000
- − Repairs & maintenance
- −$2,259
- − Management
- −$2,259
- − Depreciation
- −$5,818
- Taxable income
- $2,697
- Est. tax owed @ 24.0%
- −$647
- After-tax cash flow
- $5,073/yr
For passive investors: Depreciation is non-cash, so a rental often shows a tax loss while cash-flowing — sheltering income. Rental losses are passive: they offset passive income freely, and up to $25,000/yr can offset ordinary (W-2) income if you actively participate and your MAGI is under $100k (phasing out to $0 by $150k); unused losses carry forward. On sale, claimed depreciation is recaptured at up to 25%, and gains may owe capital-gains tax (a 1031 exchange can defer both). Figures are a year-1 estimate at your 24.0% rate — not tax advice; consult a CPA.
Schools (NCES district)
- District
- Milwaukee School District
- NCES district ID
- 5509600
- Math proficiency
- 10% ▼ -5.00%
- Reading proficiency
- 18% ▬ 0.00%
- Median HH income
- $36,339
- Composite
- 11.61/100
- National rank
- #9696
- State rank
- #337 of 342 in WI
Livability — Milwaukee
- Score
- 81/100
- State rank
- #55
- US rank
- #1534
Category grades
Schools grade is shown separately in the Schools card above.
Census & demographics
- Census place
- Milwaukee, WI
- County
- Milwaukee County · 926,379 people
- City population
- 573,768
- Metro
- Milwaukee-Waukesha, WI
- Population (ZIP)
- 19,887
- Household income
- $29,336
- Rent vs Own
- Severe rent burden
- 2061.0
Population outlook (Milwaukee County) Hauer SSP2
- Today (2025)
- 995,758 people
- By 2030
- 1,009,124 · +1.3%
- By 2040
- 1,028,128 · +3.3%
- By 2050
- 1,040,066 · +4.4%
- By 2075
- 1,057,849 · +6.2%
- By 2100
- 1,039,774 · +4.4%
Race, ethnicity, and origin ACS 2023
- Neighborhood character
- Predominantly Black (91%)
- Race & ethnicity
- Black 91% Two or more races 3% White 3% Hispanic / Latino 3%
- Common ancestry
- Norwegian 1%
- Foreign-born
- 1% · Canada
- Languages at home
- 97% English-only · Spanish 2%
Political lean MEDSL · Milwaukee
- 2024 margin
- Solid D (+38.5) · D 68.3% · R 29.8% · Other 1.8%
- 2008→2024 swing
- +2.7pp toward D · 2008: 35.9pp · 2024: 38.5pp
- All cycles
- 2024: D+38.5 2020: D+39.9 2016: D+37.5 2012: D+34.6 2008: D+35.9
Not yet ingested
- Civics
- —
Market trends
- HPI YoY
- ▲ 133.03%
- Current HPI
- 397.7151
- Rent YoY
- ▲ 8.28%
- Metro
- Milwaukee-Waukesha, WI
- State GDP YoY
- ▲ 2.10%
- F500 in state
- 20
Industry mix (Fortune 500 HQ in WI)
| Industry | F500 HQs | Revenue |
|---|---|---|
| Industrial Machinery | 4 | $23B |
|
||
| Industrial Technology | 2 | $36B |
|
||
| Insurance | 1 | $36B |
|
||
| Professional Services | 1 | $19B |
|
||
| Utilities | 1 | $9B |
|
||
| Consumer Goods | 1 | $3B |
|
||
Price history
+1900.0% since first listed7 events — show timeline
- 2026-05-19 Price Changed $210,000 METROMLS
- 2026-04-29 Price Changed $220,000 METROMLS
- 2026-03-27 Listed $230,000 METROMLS
- 2024-06-29 Rental Removed $845 APPFOLIO
- 2024-04-10 Listed for Rent $845 APPFOLIO
- 2012-05-16 Listing Removed — METROMLS
- 2012-05-16 Listed $10,500 METROMLS
Cash-flow waterfall
monthlySold comps — $/sqft
last 12 mo · ≤1 miLoading sold comps…