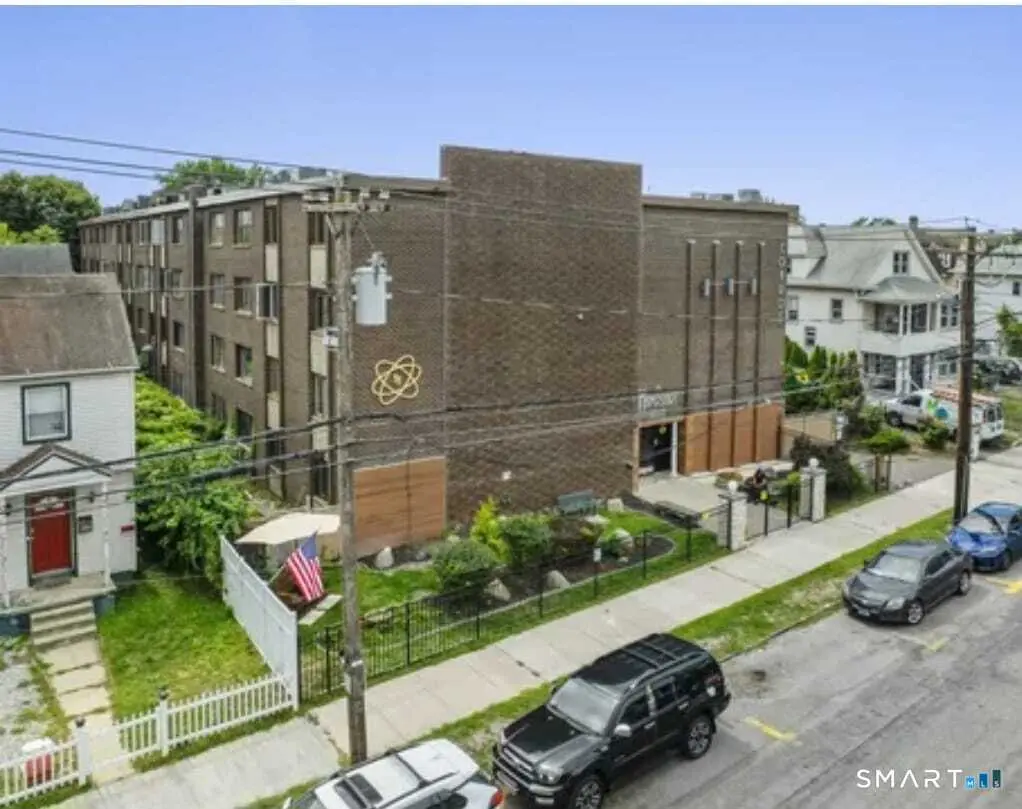
393 Laurel Ave #210 · Bridgeport, CT
Flood risk 6/10 · Moderate
- FEMA flood zone
- X (unshaded)
- Chance of flooding over 30 yrs
- 0.71%
- Est. flood insurance / yr
- $507 – $1,088
Fire risk 1/10 · Minimal
- Est. fire insurance / yr
- $829 – $1,539
Heat risk 6/10 · Moderate
- Hot days now (above 97°F)
- 7 days/yr
- Hot days in 30 yrs
- 16 days/yr
Wind risk 6/10 · Moderate
- Chance of severe wind over 30 yrs
- 66.0%
Air-quality risk 4/10 · Minor
- Unhealthy air days now
- 5 days/yr
- Unhealthy air days in 30 yrs
- 7 days/yr
Risk factors via First Street. Map © Google.
Why this score? — see what drove the C- grade
The composite is a weighted blend of 9 inputs, each scored 0–100. Each bar is that input's sub-score; the figure is the points it added to the 100-point composite (weight × sub-score).
- Cash flow +19.3/30.0
- ARV discount +7.5/15.0
- 1% rule +6.7/10.0
- DSCR +6.1/10.0
- Livability +4.0/5.0
- Rent growth +3.0/5.0
- Condition / age +2.5/5.0
- Schools +1.2/10.0
- Appreciation +0.0/10.0
$149,000
🖨 Deal sheet (PDF) 📄 Offer letter ✓ Due diligence
Listing remarks MLS
Here is your opportunity to invest in you and own property. This 1 BR 1 BA is move in ready an waiting for you to make it your own updates. This condo unit is located in a secure building minutes away from downtown living with dining, entertainment and sporting events. Enjoy the nearby beach or jump on the Ferry down Long Island Sound. The building has gated assigned parking, laundry facility on site, exercise room and community meeting room. This is a must see and won't last at this price!
Key facts
- Gated community
- Fitness center
- Updated kitchen
Tags
Neighborhood map
What this means for you Summary
Snapshot
- This is a 1-bed/1.0-bath condo listed at $149k.
Deal economics
- At list price, monthly cash flow is $164 ($2k/yr) — positive.
- The deal already cash-flows at list — no discount required.
- Meets the 1% rule at list price ($2k rent vs $149k).
- Cap rate 7.6% vs local median 5.0% in Bridgeport — top-decile yield for the area; either an underpriced asset or a hidden risk that comps aren't pricing in. Stress-test before assuming the spread holds.
Location & tenants
- Location reads 81/100 on livability (#15 in CT, #1,374 nationally) — a professional / high-income tenant draw. Strengths: amenities A+, commute A+, health & safety A+; Watch: crime C-, employment D+, schools D-.
- Bridgeport School District (urban): math 9% / reading 19% proficiency, ranked #151 of 153 in CT (top 99%) — low school quality limits family demand, transient renter base, plan for 1-2y turnover; 97% free/reduced lunch — lower-income household profile, screen leases tightly.
- Market conditions: Rents rising (+1.8%/yr); 47 active listings in the ZIP; 27 comparable units currently listed for rent nearby; rentals lingering (median 46d on market — plan ~5-8 weeks vacancy on turnover, expect pricing pressure); 52% of comp listings sitting > 30 days — soft ceiling on asking rent; 852 units permitted in Greater Bridgeport Planning Region in 2024 (698 in 5+ unit buildings).
- This rent runs 37% of the median local income ($56k/yr) — at the standard rent-burdened threshold; future hikes will face affordability resistance.
Forward outlook
- Local home prices are declining (-3.0%/yr); year-one equity from $1k of loan paydown is wiped out by about $4k of value loss. Plan a longer hold.
Negotiation context
- Only 9 days on market — expect competitive offers; lowballing is unlikely to land.
- 2 sale attempts since 4y ago with the ask held roughly flat each time — persistent listings suggest the price (not the market) is what's stuck; bring a comps-based counter.
- Current owner paid $116k; 28% above their basis — modest negotiation headroom, anchor on the comps not their cost.
Risks & watch-outs
- Climate carrying-cost: major flood risk; major wind risk, 66% chance of damaging wind over 30y; extreme-heat days projected 7→16/yr by 2055 (HVAC capex compounding) — expect insurance premiums to compound above CPI over the hold.
Questions for the listing agent
- Built in 1972 — when were the roof, HVAC, electrical panel, plumbing, and water heater last replaced?
- What does the HOA fee cover, when was the last increase, and are there any pending special assessments or reserve-fund shortfalls?
- Any open or pending special assessments — roof, HVAC, plumbing, elevator, façade? What's the per-unit balance and payoff schedule, and is the seller paying it off at close or rolling it to the buyer?
- Is there a deadline driving the sale (1031 exchange, divorce, estate, relocation)? That informs how much negotiation room exists.
- Schools are D-rated, which usually means shorter tenancies and higher turnover. Who's the typical renter profile here, and what's been the actual vacancy rate?
- What's the average days-on-market for RENTAL listings here right now (not sales)? A rising rental-DOM trend means longer vacancies and softer asking-rent achievability than the comps imply.
- What's the recent tenant-quality profile in this submarket — average credit score on applications, eviction rate, late-payment / NSF rate, and stable-employment percentage? A property-management company in the area should have these aggregated.
- How much new apartment / multifamily construction is in the pipeline within 1–3 miles? Heavy new supply (>2% of stock underway) typically softens rents 12–24 months out; light construction supports rent growth.
Investment metrics
- 1% rule
- 1.17% ✓
- Cap rate
- 7.61%
- Cash-on-cash
- 4.71%
- DSCR
- 1.21
- GRM
- 7.1
CMA / ARV
No comps found within radius.
Projected returns pro-forma
-3.0% appreciation · 1.81% rent growth · sell at horizon
- IRR
- -10.4%
- Equity multiple
- 0.62×
- Total profit
- $-15,646
- Equity at exit
- $22,216
- IRR
- -3.0%
- Equity multiple
- 0.81×
- Total profit
- $-7,902
- Equity at exit
- $12,883
Cash invested: $41,720 (down + closing). Projections, not guarantees.
Landlord ↔ Tenant lean methodology
- Overall (STATE)
- 27 Tenant-Leaning
- State Connecticut
- 27 Tenant-Leaning · D+7
- County
- — inherits STATE
- City
- — inherits STATE
ZIP-level market 06605
- Home prices YoY
- -14.5%
- Rents YoY
- 1.8%
- Active inventory
- 47
- Price-to-rent
- 7.1×
Monthly cashflow live
- Estimated rent
- $1,743 high interval (Pro) →
- Mortgage (P&I)
- −$781
- Tax from tax record
- −$114 /mo · $1,374/yr
- Insurance
- −$62
- HOA
- −$255
- Vacancy / Maint / Mgmt
- −$366
- Net cashflow
- $164
Break-even live
Sensitivity live
| Price | -10% $248 | -5% $206 | +0% $164 | +5% $121 | +10% $79 |
|---|---|---|---|---|---|
| Rent | -10% $26 | -5% $95 | +0% $164 | +5% $232 | +10% $301 |
| Rate | -1.0pp $239 | -0.5pp $202 | base $164 | +0.5pp $125 | +1.0pp $86 |
UW: 25.0% down · 7.5% · 30yr · 1.5% tax · 5.0% vac · 8.0% maint · 8.0% mgmt
Financing live
Cash to close
- Down payment
- $37,250
- Closing costs
- $4,470
- Reserves months
- —
- Total cash needed
- —
Loan-product check · same deal, 3 products live
Conventional
25% down · 7.5% · 30yr
- Down + closing
- —
- Monthly P&I
- —
- Monthly cashflow
- —
- DSCR
- —
- Eligible?
- —
Personal DTI + credit; lowest rate.
DSCR
20% down · 8.5% · 30yr
- Down + closing
- —
- Monthly P&I
- —
- Monthly cashflow
- —
- DSCR
- —
- Eligible?
- —
No personal income docs; deal must DSCR.
Hard money
10% down · 12.0% · 12mo
- Down + closing
- —
- Monthly P&I
- —
- Monthly cashflow
- —
- DSCR
- —
- Eligible?
- —
Short-term bridge; refi at stabilization.
Rent comps 27 comps
| Address | Beds | Baths | Sqft | Rent | $/sqft | DOM | Units | Dist |
|---|---|---|---|---|---|---|---|---|
| 273 Colorado Ave Bridgeport, CT | — | 1.0 | 450 | $1,295 | $2.88 | 45d | 1 | 0.27mi |
| 631 Colorado Ave Bridgeport, CT | 1.0 | 1.0 | 366 | $1,350 | $3.69 | 45d | 1 | 0.37mi |
| 210 Washington Ave Bridgeport, CT | 1.0–2.0 | 1.0 | 837 | $1,331 | $1.59 | 5d | 6 | 0.51mi |
| 838 Wood Ave Bridgeport, CT | — | 1.0 | 410 | $1,295 | $3.16 | 25d | 1 | 0.65mi |
| 80 Cartright St Unit 1G Bridgeport, CT | — | 1.0 | 604 | $1,600 | $2.65 | 5d | 1 | 0.72mi |
| 333 State St Bridgeport, CT | 1.0 | 1.0 | 740 | $2,050 | $2.77 | 5d | 6 | 0.75mi |
| 225 Golden Hill St Apt 4D Bridgeport, CT | 2.0 | 1.0 | 750 | $1,800 | $2.40 | 45d | 1 | 0.83mi |
| 213 Golden Hill St Unit 4D Bridgeport, CT | 2.0 | 1.0 | 750 | $1,800 | $2.40 | 45d | 1 | 0.83mi |
| 120 Rennell St Bridgeport, CT | 2.0 | 1.0 | 750 | $1,450 | $1.93 | 4d | 1 | 0.86mi |
| 195 Laurel Pl Bridgeport, CT | 1.0 | 1.0 | 600 | $2,000 | $3.33 | 45d | 1 | 0.86mi |
| 144 Golden Hill St Bridgeport, CT | 1.0 | 1.0 | 592 | $1,675 | $2.83 | 16d | 1 | 0.91mi |
| 325 Lafayette St Bridgeport, CT | 3.0 | 1.0 | 1118 | $1,758 | $1.57 | 4d | 2 | 0.99mi |
| 325 Lafayette St Bridgeport, CT | 1.0–3.0 | 1.0 | 1065 | $1,450 | $1.36 | 45d | 2 | 0.99mi |
| 120 Morgan Ave Bridgeport, CT | 1.0 | 1.0 | 545 | $1,500 | $2.75 | 25d | 1 | 1.05mi |
| 226 Kings Hwy E Fairfield, CT | 1.0 | 1.0 | 600 | $1,650 | $2.75 | 25d | 1 | 1.10mi |
| 80 Taft Ave Bridgeport, CT | 1.0–2.0 | 1.0 | 645 | $1,750 | $2.71 | 45d | 2 | 1.12mi |
| 105 William St Unit A Bridgeport, CT | 1.0 | 1.0 | 582 | $1,350 | $2.32 | 45d | 1 | 1.24mi |
| 55 E Main St Bridgeport, CT | 3.0 | 1.0–3.0 | 1115 | $4,338 | $3.89 | 4d | 189 | 1.27mi |
| 77 Crowther Ave Bridgeport, CT | 1.0 | 1.0 | 650 | $1,900 | $2.92 | 45d | 1 | 1.31mi |
| 585 Ellsworth St Bridgeport, CT | 1.0 | 1.0 | 650 | $1,995 | $3.07 | 45d | 2 | 1.31mi |
| 575 Ellsworth St Bridgeport, CT | 1.0 | 1.0 | 580 | $1,975 | $3.40 | 45d | 5 | 1.32mi |
| 588-612 E Main St Unit 598 Bridgeport, CT | 2.0 | 1.0 | 750 | $1,975 | $2.63 | 12d | 1 | 1.43mi |
| 588-612 E Main St Unit D Bridgeport, CT | 2.0 | 1.0 | 750 | $2,125 | $2.83 | 45d | 1 | 1.43mi |
| 305 Ellsworth St Unit 21-F Bridgeport, CT | 1.0 | 1.0 | 750 | $2,015 | $2.69 | 25d | 1 | 1.44mi |
| 220 King St Bridgeport, CT | 2.0 | 1.0 | 750 | $2,300 | $3.07 | 5d | 1 | 1.45mi |
| 267 Ellsworth St Apt 5C Bridgeport, CT | — | 1.0 | 400 | $1,625 | $4.06 | 45d | 1 | 1.47mi |
| 45 Biro St Unit 1 Fairfield, CT | 1.0 | 1.0 | 660 | $1,950 | $2.95 | 45d | 1 | 1.47mi |
HOA detail condo
- Monthly dues
- $255 · $3,060/yr
- Likely covers
- securityparking
- Assessments
- None detected in remarks — confirm with the listing agent.
Listing history 5 events
-
2026-03-31status Under Contract
-
2026-03-21$149,000 Active
-
2022-08-25soldstatus $116,000
-
2022-08-19soldstatus $115,000 Closed 495-char remark
Show marketing remark (495 chars)
Here is your opportunity to invest in you and own property. This 1 BR 1 BA is move in ready an waiting for you to make it your own updates. This condo unit is located in a secure building minutes away from downtown living with dining, entertainment and sporting events. Enjoy the nearby beach or jump on the Ferry down Long Island Sound. The building has gated assigned parking, laundry facility on site, exercise room and community meeting room. This is a must see and won't last at this price!
-
2022-05-28$110,000 Active 495-char remark
Show marketing remark (495 chars)
Here is your opportunity to invest in you and own property. This 1 BR 1 BA is move in ready an waiting for you to make it your own updates. This condo unit is located in a secure building minutes away from downtown living with dining, entertainment and sporting events. Enjoy the nearby beach or jump on the Ferry down Long Island Sound. The building has gated assigned parking, laundry facility on site, exercise room and community meeting room. This is a must see and won't last at this price!
ⓘ Source: listings_history table (triggers on properties + properties_extension) + one-shot
backfill from property_details.listing_events for pre-trigger history.
Tax reassessment forecast CT · Partial reset (capped growth)
- Current annual tax
- $1,374 · $114/mo
- Projected year-2 tax
- $2,281 · $190/mo
- Expected delta
- +$907/yr (+$76/mo · 66.0%)
ⓘ Screening estimate from a state-policy table — verify with the county assessor before closing.
Climate risk First Street
- Flood 6/10 Major FEMA zone X (unshaded) · 71% chance over 30 yrs
- Wildfire 1/10 Low
- Heat 6/10 Major 7 d/yr ≥97°F today · 16 d/yr by 30 yrs out
- Wind 6/10 Major 66% chance of damaging wind over 30 yrs
- Air quality 4/10 Moderate 5 unhealthy d/yr today · 7 by 30 yrs out
Nearby sold comps map
Loading sold comps map…
Walkable amenities ~0.75 mi
Loading nearby amenities…
Taxation est. · year 1
- Rental income
- $20,910
- − Mortgage interest
- −$8,346
- − Property taxes
- −$1,374
- − Insurance
- −$745
- − Repairs & maintenance
- −$1,673
- − Management
- −$1,673
- − HOA
- −$3,060
- − Depreciation
- −$4,335
- Taxable loss
- −$295
- Est. tax savings @ 24.0%
- +$71
- After-tax cash flow
- $2,034/yr
For passive investors: Depreciation is non-cash, so a rental often shows a tax loss while cash-flowing — sheltering income. Rental losses are passive: they offset passive income freely, and up to $25,000/yr can offset ordinary (W-2) income if you actively participate and your MAGI is under $100k (phasing out to $0 by $150k); unused losses carry forward. On sale, claimed depreciation is recaptured at up to 25%, and gains may owe capital-gains tax (a 1031 exchange can defer both). Figures are a year-1 estimate at your 24.0% rate — not tax advice; consult a CPA.
Schools (NCES district)
- District
- Bridgeport School District
- NCES district ID
- 0900450
- Math proficiency
- 9% ▼ -7.00%
- Reading proficiency
- 19% ▼ -10.00%
- Median HH income
- $41,507
- Composite
- 12.09/100
- National rank
- #9656
- State rank
- #151 of 153 in CT
Livability — Bridgeport
- Score
- 81/100
- State rank
- #15
- US rank
- #1374
Category grades
Schools grade is shown separately in the Schools card above.
Census & demographics
- Census place
- Bridgeport, CT
- County
- Fairfield County · 765,532 people
- City population
- 149,153
- Metro
- Bridgeport-Stamford-Norwalk, CT
- Population (ZIP)
- 25,929
- Household income
- $56,179
- Rent vs Own
- Severe rent burden
- 2367.0
Population outlook (Greater Bridgeport County) Hauer SSP2
- By 2040
- 365,581
Race, ethnicity, and origin ACS 2023
- Neighborhood character
- Diverse neighborhood (Simpson 0.70)
- Race & ethnicity
- Hispanic / Latino 39% White 33% Black 19% Two or more races 12% Asian 5% Native American 1%
- Hispanic origin (detail)
- Mexican 6% Puerto Rican 17% Cuban 3% Dominican 3%
- Common ancestry
- Romanian 4% Hispanic 3% Scotch-Irish 2%
- Foreign-born
- 25% · Canada, Guatemala, China
- Languages at home
- 54% English-only · Spanish 32% Other Indo-European 4% French/Haitian/Cajun 3%
Political lean MEDSL · Greater Bridgeport
- 2024 margin
- Strong D (+23.3) · D 60.9% · R 37.6% · Other 1.5%
- All cycles
- 2024: D+23.3
Not yet ingested
- Civics
- —
Market trends
- HPI YoY
- ▼ -40.42%
- Current HPI
- 238.1786
- Rent YoY
- ▲ 1.81%
- Metro
- Bridgeport-Stamford-Norwalk, CT
- State GDP YoY
- ▲ 1.06%
- F500 in state
- 38
Industry mix (Fortune 500 HQ in CT)
| Industry | F500 HQs | Revenue |
|---|---|---|
| Industrial Machinery | 4 | $38B |
|
||
| Insurance | 3 | $71B |
|
||
| Financial Services | 2 | $25B |
|
||
| Transportation / Logistics | 2 | $18B |
|
||
| Healthcare | 1 | $247B |
|
||
| Telecommunications | 1 | $55B |
|
||
Price history
+35.5% since first listed5 events — show timeline
- 2026-03-31 Pending — Smart MLS
- 2026-03-21 Listed $149,000 Smart MLS
- 2022-08-25 Sold (Public Records) $116,000 Public Records
- 2022-08-19 Sold (MLS) $115,000 Smart MLS
- 2022-05-28 Listed $110,000 Smart MLS
Property tax history
-2.4%/yrLatest (2023): $1,374 · +0.0% YoY. Source: county tax records.
Cash-flow waterfall
monthlySold comps — $/sqft
last 12 mo · ≤1 miLoading sold comps…