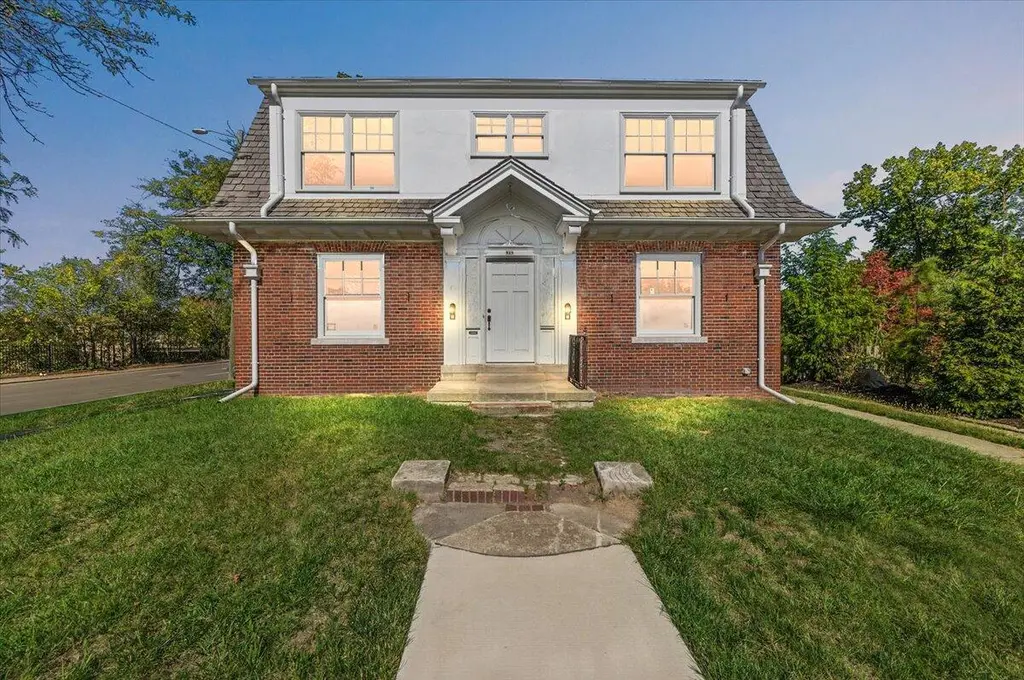
918 Virginia Park St · Detroit, MI
Flood risk 1/10 · Minimal
- FEMA flood zone
- X (unshaded)
- Chance of flooding over 30 yrs
- 0.0%
- Est. flood insurance / yr
- $473 – $860
Fire risk 1/10 · Minimal
- Est. fire insurance / yr
- $784 – $1,456
Heat risk 3/10 · Minor
- Hot days now (above 96°F)
- 7 days/yr
- Hot days in 30 yrs
- 15 days/yr
Wind risk 2/10 · Minimal
- Chance of severe wind over 30 yrs
- —
Air-quality risk 4/10 · Minor
- Unhealthy air days now
- 4 days/yr
- Unhealthy air days in 30 yrs
- 6 days/yr
Risk factors via First Street. Map © Google.
Why this score? — see what drove the D grade
The composite is a weighted blend of 9 inputs, each scored 0–100. Each bar is that input's sub-score; the figure is the points it added to the 100-point composite (weight × sub-score).
- ARV discount +15.0/15.0
- Cash flow +11.2/30.0
- 1% rule +5.4/10.0
- Livability +3.7/5.0
- DSCR +3.3/10.0
- Condition / age +2.5/5.0
- Schools +1.3/10.0
- Rent growth +1.2/5.0
- Appreciation +0.0/10.0
$249,000
🖨 Deal sheet (PDF) 📄 Offer letter ✓ Due diligence
Listing remarks MLS
Located in the historic Virginia Park District of Detroit, this spacious 5-bedroom, 3.2-bath home offers 2,747 sq ft of living space on a corner lot with a 2-car garage. The property is white boxed, meaning the major rough work has been completed and inspected, leaving only cosmetic finishes to bring your vision to life. All rough-in inspections are approved, including plumbing, HVAC, electrical, roof, windows, and exterior doors—saving time and construction costs. The flexible floor plan and generous room sizes make this ideal for an owner-occupant or investor seeking a value-add opportunity in a highly regarded neighborhood. Conveniently located less than 10 minutes from downtown Detroit with easy access to major corridors and city amenities. A rare opportunity to finish a nearly complete home in one of Detroit's most historic districts.
Key facts
- Flexible floor plan
- Corner lot
- 8,712 sq ft lot
Tags
Neighborhood map
What this means for you Summary
Snapshot
- This is a 5-bed/1.5-bath single-family listed at $249k.
Deal economics
- At list price, monthly cash flow is $-98 ($-1k/yr) — negative.
- To cash-flow at today's rent, offer at most $232k (6.9% below list).
- Meets the 1% rule at list price ($3k rent vs $249k).
- Recommended offer: $219k (12.0% below list) — sets the bar for market timing.
- Cap rate 5.8% vs local median 10.0% in Detroit — below-typical yield; the buyer is paying a premium for something (appreciation thesis, condition, location) that the cap rate doesn't capture.
Location & tenants
- Location reads 73/100 on livability (#218 in MI) — a middle-class / working-renter tenant base. Strengths: amenities A+, commute A+, cost of living A+; Watch: crime F, employment F.
- Detroit Public Schools Community District (urban): math 10% / reading 24% proficiency, ranked #499 of 540 in MI (top 92%) — low school quality limits family demand, transient renter base, plan for 1-2y turnover; 90% free/reduced lunch — lower-income household profile, screen leases tightly.
- Zoned schools: Thirkell Elementarymiddle School (math 2% / reading 8%, grade F, #1,325 of 1,397 statewide, top 99%, 501 students, 91% FRL); Northwestern High School (math 10% / reading 10%, grade F, #659 of 713 statewide, top 97%, 358 students, 88% FRL) — zoned schools at 90% FRL track the district average.
- Market conditions: Rents falling (-5.1%/yr); 257 active listings in the ZIP; 11 comparable units currently listed for rent nearby; rentals leasing fast (median 12d on market — plan ~1-2 weeks tenant-placement turnaround); lower-income renter base — watch delinquency; 2,639 units permitted in Wayne County in 2024 (1,216 in 5+ unit buildings).
- At $2,580/mo this rent would consume 71% of the median local household income ($44k/yr) (locally 1258% of renters already pay >50% of income on rent) — very limited rent-growth headroom before tenants either downsize or default.
Forward outlook
- Local home prices are declining (-3.0%/yr); year-one equity from $2k of loan paydown is wiped out by about $7k of value loss. Plan a longer hold.
- Wayne County population projected at -17% by 2050 — secular population decline; favor cash flow + early exit over multi-decade hold.
Negotiation context
- It's been on market 158 days — a 12% lower offer ($219k) is reasonable based on typical stale-listing flexibility.
- 4 sale attempts since 21y ago with the ask held roughly flat each time — persistent listings suggest the price (not the market) is what's stuck; bring a comps-based counter.
- Current owner paid $70k; list at $249k implies a 256% gain — meaningful room to come down on a strong offer.
Risks & watch-outs
- Watch-outs: property tax is 3.5% of price; built in 1912 — expect roof / HVAC / electrical / plumbing capex.
Questions for the listing agent
- What do current leases actually rent for vs. the listed asking? Can we see a recent rent roll and the last 12 months of T-12 income?
- It's been on market 158 days. Have you received any prior offers? Is the seller open to a 12% concession, seller financing, or rate buy-down credit?
- Built in 1912 — when were the roof, HVAC, electrical panel, plumbing, and water heater last replaced?
- Property tax is high relative to price — has the assessment been appealed recently, and will the sale trigger a re-assessment?
- Why hasn't it sold? Are there any deal-killer items the seller is aware of (foundation, flood, title, zoning, code violations)?
- Is there a deadline driving the sale (1031 exchange, divorce, estate, relocation)? That informs how much negotiation room exists.
- Schools are F-rated, which usually means shorter tenancies and higher turnover. Who's the typical renter profile here, and what's been the actual vacancy rate?
- Crime grade is F in this area — have there been break-ins, vandalism, or insurance claims at this property in the last 3 years? What carrier currently insures it and at what premium?
- The area grade is low — what's the realistic commute time and amenity access for the typical tenant pool here? Any planned neighborhood developments (good or bad) we should know about?
- What's the average days-on-market for RENTAL listings here right now (not sales)? A rising rental-DOM trend means longer vacancies and softer asking-rent achievability than the comps imply.
- What's the recent tenant-quality profile in this submarket — average credit score on applications, eviction rate, late-payment / NSF rate, and stable-employment percentage? A property-management company in the area should have these aggregated.
- How much new for-sale + rental construction is in the pipeline within 1–3 miles? Heavy new supply typically softens prices + rents 12–24 months out; constrained supply supports both.
Investment metrics
- 1% rule
- 1.04% ✓
- Cap rate
- 5.82%
- Cash-on-cash
- -1.69%
- DSCR
- 0.93
- GRM
- 8.0
CMA / ARV
- ARV (median comp)
- $344,337
- List price
- $249,000
- Delta
- -27.69%
- Verdict
- UNDERPRICED
- Comps
- 20 within 1.0 mi
Show comp detail 12 sales within ~0.75 mi
| Address | Dist | Beds/Ba | Sqft | Sold | Price | $/sf | Match |
|---|---|---|---|---|---|---|---|
| 1640 Estates Dr | 0.56mi | 4/3.0 (-1) | 2,674 (-3%) | 0mo | $380,000 | $142 | 58 |
| 65 Melbourne St | 0.52mi | 4/4.5 (-1) | 2,650 (-4%) | 2mo | $275,000 | $104 | 51 |
| 708 Taylor St | 0.47mi | 4/1.5 (-1) | 2,435 (-11%) | 7mo | $225,000 | $92 | 48 |
| 100 Taylor St | 0.56mi | 4/2.5 (-1) | 2,486 (-10%) | 3mo | $140,000 | $56 | 47 |
| 1199 Atkinson St | 0.57mi | 5/2.5 | 3,060 (+11%) | 5mo | $265,000 | $87 | 46 |
| 7406 Kipling Ave | 0.51mi | 4/5.0 (-1) | 2,605 (-5%) | 4mo | $321,000 | $123 | 45 |
| 686 Atkinson St S | 0.61mi | 5/2.5 | 2,384 (-13%) | 1mo | $195,000 | $82 | 45 |
| 237 Alger St | 0.67mi | 4/3.0 (-1) | 2,597 (-6%) | 6mo | $337,500 | $130 | 44 |
| 1441 Longfellow St | 0.73mi | 5/2.5 | 2,463 (-10%) | 2mo | $166,000 | $67 | 43 |
| 1411 Atkinson St | 0.60mi | 5/5.5 | 2,993 (+9%) | 7mo | $148,000 | $49 | 35 |
| 1475 Atkinson St | 0.63mi | 4/2.5 (-1) | 2,377 (-14%) | 6mo | $172,500 | $73 | 34 |
| 2007 Virginia Park St | 0.67mi | 6/4.0 (+1) | 2,960 (+8%) | 9mo | $362,500 | $122 | 34 |
Match score weights: distance 35% · size 25% · config 20% · recency 20%. Top-matched comps best support the ARV.
Projected returns pro-forma
-3.0% appreciation · 0.0% rent growth · sell at horizon
- IRR
- -23.3%
- Equity multiple
- 0.23×
- Total profit
- $-53,851
- Equity at exit
- $37,127
- IRR
- -33.1%
- Equity multiple
- -0.19×
- Total profit
- $-82,946
- Equity at exit
- $21,529
Cash invested: $69,720 (down + closing). Projections, not guarantees.
Landlord ↔ Tenant lean methodology
- Overall (STATE)
- 62 Landlord-Friendly
- State Michigan
- 62 Landlord-Friendly · EVEN
- County
- — inherits STATE
- City
- — inherits STATE
ZIP-level market 48202
- Rents YoY
- -5.1%
- Active inventory
- 257
- Price-to-rent
- 8.0×
Monthly cashflow live
- Estimated rent
- $2,580 high interval (Pro) →
- Mortgage (P&I)
- −$1,306
- Tax from tax record
- −$726 /mo · $8,718/yr
- Insurance
- −$104
- HOA
- −$0
- Vacancy / Maint / Mgmt
- −$542
- Net cashflow
- $-98
Break-even live
Sensitivity live
| Price | -10% $43 | -5% $-27 | +0% $-98 | +5% $-168 | +10% $-239 |
|---|---|---|---|---|---|
| Rent | -10% $-302 | -5% $-200 | +0% $-98 | +5% $4 | +10% $106 |
| Rate | -1.0pp $27 | -0.5pp $-35 | base $-98 | +0.5pp $-162 | +1.0pp $-228 |
UW: 25.0% down · 7.5% · 30yr · 1.5% tax · 5.0% vac · 8.0% maint · 8.0% mgmt
Financing live
Cash to close
- Down payment
- $62,250
- Closing costs
- $7,470
- Reserves months
- —
- Total cash needed
- —
Loan-product check · same deal, 3 products live
Conventional
25% down · 7.5% · 30yr
- Down + closing
- —
- Monthly P&I
- —
- Monthly cashflow
- —
- DSCR
- —
- Eligible?
- —
Personal DTI + credit; lowest rate.
DSCR
20% down · 8.5% · 30yr
- Down + closing
- —
- Monthly P&I
- —
- Monthly cashflow
- —
- DSCR
- —
- Eligible?
- —
No personal income docs; deal must DSCR.
Hard money
10% down · 12.0% · 12mo
- Down + closing
- —
- Monthly P&I
- —
- Monthly cashflow
- —
- DSCR
- —
- Eligible?
- —
Short-term bridge; refi at stabilization.
Rent comps 11 comps
| Address | Beds | Baths | Sqft | Rent | $/sqft | DOM | Units | Dist |
|---|---|---|---|---|---|---|---|---|
| 216 Holbrook Unit Na Detroit, MI | 4.0 | 2.0 | 2000 | $2,200 | $1.10 | 0d | 1 | 0.66mi |
| 216 Holbrook St Detroit, MI | 4.0 | 2.0 | 2000 | $2,000 | $1.00 | 23d | 1 | 0.66mi |
| 2028 Gladstone St Unit 1 Detroit, MI | 5.0 | 2.0 | 2500 | $2,850 | $1.14 | 5d | 1 | 0.78mi |
| 2080 Gladstone St #1 Detroit, MI | 4.0 | 2.0 | 2426 | $3,000 | $1.24 | 0d | 1 | 0.83mi |
| 7370 La Salle Blvd Detroit, MI | 4.0 | 3.0 | 3610 | $4,500 | $1.25 | 45d | 1 | 1.01mi |
| 8951 La Salle Blvd Detroit, MI | 4.0 | 2.5 | 2440 | $2,500 | $1.02 | 3d | 1 | 1.04mi |
| 8951 La Salle Blvd Detroit, MI | 5.0 | 2.5 | 2440 | $2,500 | $1.02 | 16d | 1 | 1.04mi |
| 8951 La Salle Blvd Unit NA Detroit, MI | 4.0 | 2.5 | 2440 | $2,500 | $1.02 | 0d | 1 | 1.04mi |
| 1699 Glynn Ct Detroit, MI | 5.0 | 3.5 | 2542 | $2,500 | $0.98 | 23d | 1 | 1.04mi |
| 2509 Gladstone St Unit NA Detroit, MI | 6.0 | 3.0 | 3008 | $2,000 | $0.66 | 12d | 1 | 1.09mi |
| 2286 Calvert St Detroit, MI | 4.0 | 1.0 | 3402 | $1,450 | $0.43 | 16d | 1 | 1.32mi |
Listing history 21 events
-
2026-06-21days on market $249,000 Active 158 DOM
-
2026-06-18days on market $249,000 Active 155 DOM
-
2026-06-17days on market $249,000 Active 154 DOM
-
2026-06-15days on market $249,000 Active 152 DOM
-
2026-06-13days on market $249,000 Active 150 DOM
-
2026-06-13days on market $249,000 Active 149 DOM
-
2026-06-09days on market $249,000 Active 146 DOM
-
2026-06-08days on market $249,000 Active 145 DOM
-
2026-06-07days on market $249,000 Active 144 DOM
-
2026-06-04days on market $249,000 Active 141 DOM
-
2026-06-03days on market $249,000 Active 140 DOM
-
2026-06-01days on market $249,000 Active 138 DOM
-
2026-05-31days on market $249,000 Active 137 DOM
-
2026-01-14$249,000 Active 857-char remark
Show marketing remark (852 chars)
Located in the historic Virginia Park District of Detroit, this spacious 5-bedroom, 3.2-bath home offers 2,747 sq ft of living space on a corner lot with a 2-car garage. The property is white boxed, meaning the major rough work has been completed and inspected, leaving only cosmetic finishes to bring your vision to life. All rough-in inspections are approved, including plumbing, HVAC, electrical, roof, windows, and exterior doors--saving time and construction costs. The flexible floor plan and generous room sizes make this ideal for an owner-occupant or investor seeking a value-add opportunity in a highly regarded neighborhood. Conveniently located less than 10 minutes from downtown Detroit with easy access to major corridors and city amenities. A rare opportunity to finish a nearly complete home in one of Detroit's most historic districts.
-
2026-01-14$249,000 Active 852-char remark
Show marketing remark (852 chars)
Located in the historic Virginia Park District of Detroit, this spacious 5-bedroom, 3.2-bath home offers 2,747 sq ft of living space on a corner lot with a 2-car garage. The property is white boxed, meaning the major rough work has been completed and inspected, leaving only cosmetic finishes to bring your vision to life. All rough-in inspections are approved, including plumbing, HVAC, electrical, roof, windows, and exterior doors--saving time and construction costs. The flexible floor plan and generous room sizes make this ideal for an owner-occupant or investor seeking a value-add opportunity in a highly regarded neighborhood. Conveniently located less than 10 minutes from downtown Detroit with easy access to major corridors and city amenities. A rare opportunity to finish a nearly complete home in one of Detroit's most historic districts.
-
2026-01-14$249,000 Active
Show marketing remark (852 chars)
Located in the historic Virginia Park District of Detroit, this spacious 5-bedroom, 3.2-bath home offers 2,747 sq ft of living space on a corner lot with a 2-car garage. The property is white boxed, meaning the major rough work has been completed and inspected, leaving only cosmetic finishes to bring your vision to life. All rough-in inspections are approved, including plumbing, HVAC, electrical, roof, windows, and exterior doors--saving time and construction costs. The flexible floor plan and generous room sizes make this ideal for an owner-occupant or investor seeking a value-add opportunity in a highly regarded neighborhood. Conveniently located less than 10 minutes from downtown Detroit with easy access to major corridors and city amenities. A rare opportunity to finish a nearly complete home in one of Detroit's most historic districts.
-
2006-06-14soldstatus $70,000
-
2006-04-03soldstatus $70,000
-
2005-09-28$71,500
-
2004-04-26soldstatus $270,000
-
2003-03-17soldstatus $107,000
ⓘ Source: listings_history table (triggers on properties + properties_extension) + one-shot
backfill from property_details.listing_events for pre-trigger history.
Tax reassessment forecast MI · Partial reset (capped growth)
- Current annual tax
- $8,718 · $726/mo
- Projected year-2 tax
- $8,718 · $726/mo
- Expected delta
- $0/yr ($0/mo · 0.0%)
ⓘ Screening estimate from a state-policy table — verify with the county assessor before closing.
Climate risk First Street
- Flood 1/10 Low FEMA zone X (unshaded) · 0% chance over 30 yrs
- Wildfire 1/10 Low
- Heat 3/10 Moderate 7 d/yr ≥96°F today · 15 d/yr by 30 yrs out
- Wind 2/10 Low
- Air quality 4/10 Moderate 4 unhealthy d/yr today · 6 by 30 yrs out
Nearby sold comps map
Loading sold comps map…
Walkable amenities ~0.75 mi
Loading nearby amenities…
Taxation est. · year 1
- Rental income
- $30,958
- − Mortgage interest
- −$13,948
- − Property taxes
- −$8,718
- − Insurance
- −$1,245
- − Repairs & maintenance
- −$2,477
- − Management
- −$2,477
- − Depreciation
- −$7,244
- Taxable loss
- −$5,149
- Est. tax savings @ 24.0%
- +$1,236
- After-tax cash flow
- $61/yr
For passive investors: Depreciation is non-cash, so a rental often shows a tax loss while cash-flowing — sheltering income. Rental losses are passive: they offset passive income freely, and up to $25,000/yr can offset ordinary (W-2) income if you actively participate and your MAGI is under $100k (phasing out to $0 by $150k); unused losses carry forward. On sale, claimed depreciation is recaptured at up to 25%, and gains may owe capital-gains tax (a 1031 exchange can defer both). Figures are a year-1 estimate at your 24.0% rate — not tax advice; consult a CPA.
Schools (NCES district)
- District
- Detroit Public Schools Community District
- NCES district ID
- 2601103
- Math proficiency
- 10% ▼ -2.00%
- Reading proficiency
- 24% ▲ 6.00%
- Median HH income
- $25,815
- Composite
- 13.06/100
- National rank
- #9564
- State rank
- #499 of 540 in MI
Livability — Detroit
- Score
- 73/100
- State rank
- #218
- US rank
- #5427
Category grades
Schools grade is shown separately in the Schools card above.
Census & demographics
- Census place
- Detroit, MI
- County
- Wayne County · 1,562,939 people
- City population
- 572,865
- Metro
- Detroit-Warren-Dearborn, MI
- Population (ZIP)
- 15,780
- Household income
- $43,627
- Rent vs Own
- Severe rent burden
- 1258.0
Population outlook (Wayne County) Hauer SSP2
- Today (2025)
- 1,675,273 people
- By 2030
- 1,620,300 · -3.3%
- By 2040
- 1,502,341 · -10.3%
- By 2050
- 1,384,039 · -17.4%
- By 2075
- 1,124,592 · -32.9%
- By 2100
- 881,193 · -47.4%
Race, ethnicity, and origin ACS 2023
- Neighborhood character
- Diverse neighborhood (Simpson 0.57)
- Race & ethnicity
- Black 60% White 26% Asian 6% Two or more races 4% Hispanic / Latino 3%
- Common ancestry
- Romanian 3% Slovak 1% Lithuanian 1%
- Foreign-born
- 8% · Canada, Vietnam
- Languages at home
- 90% English-only · Other Indo-European 3% Arabic 2% Spanish 2%
Political lean MEDSL · Wayne
- 2024 margin
- Strong D (+29.0) · D 62.7% · R 33.7% · Other 3.6%
- 2008→2024 swing
- -20.5pp toward R · 2008: 49.5pp · 2024: 29.0pp
- All cycles
- 2024: D+29.0 2020: D+38.1 2016: D+37.3 2012: D+46.9 2008: D+49.5
Not yet ingested
- Civics
- —
Market trends
- HPI YoY
- ▼ -239.24%
- Current HPI
- 145.5509
- Rent YoY
- ▼ -5.13%
- Metro
- Detroit-Warren-Dearborn, MI
- State GDP YoY
- ▲ 1.37%
- F500 in state
- 28
Industry mix (Fortune 500 HQ in MI)
| Industry | F500 HQs | Revenue |
|---|---|---|
| Automotive Parts | 3 | $48B |
|
||
| Automotive | 2 | $372B |
|
||
| Chemicals | 1 | $45B |
|
||
| Automotive Retail | 1 | $29B |
|
||
| Healthcare / Medical Devices | 1 | $23B |
|
||
| Automotive Technology | 1 | $20B |
|
||
Price history
+132.7% since first listed8 events — show timeline
- 2026-01-14 Listed $249,000 MiRealSource-MiMLS
- 2026-01-14 Listed $249,000 REALCOMP
- 2026-01-14 Listed $249,000 SW Michigan MLS
- 2006-06-14 Sold (Public Records) $70,000 Public Records
- 2006-04-03 Sold (MLS) $70,000 REALCOMP
- 2005-09-28 Listed $71,500 REALCOMP
- 2004-04-26 Sold (Public Records) $270,000 Public Records
- 2003-03-17 Sold (Public Records) $107,000 Public Records
Property tax history
+33.2%/yrLatest (2025): $8,718 · +11.1% YoY. Source: county tax records.
Cash-flow waterfall
monthlySold comps — $/sqft
last 12 mo · ≤1 miLoading sold comps…