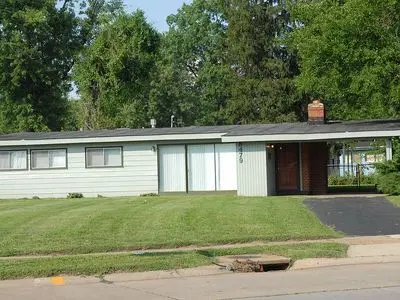
8479 January Ave · Berkeley, MO
Flood risk 1/10 · Minimal
- FEMA flood zone
- X (unshaded)
- Chance of flooding over 30 yrs
- 0.0%
- Est. flood insurance / yr
- $507 – $1,088
Fire risk 1/10 · Minimal
- Est. fire insurance / yr
- $1,054 – $1,958
Heat risk 5/10 · Moderate
- Hot days now (above 106°F)
- 7 days/yr
- Hot days in 30 yrs
- 21 days/yr
Wind risk 2/10 · Minimal
- Chance of severe wind over 30 yrs
- 1.0%
Air-quality risk 3/10 · Minor
- Unhealthy air days now
- 3 days/yr
- Unhealthy air days in 30 yrs
- 5 days/yr
Risk factors via First Street. Map © Google.
Why this score? — see what drove the C+ grade
The composite is a weighted blend of 9 inputs, each scored 0–100. Each bar is that input's sub-score; the figure is the points it added to the 100-point composite (weight × sub-score).
- Cash flow +26.9/30.0
- ARV discount +11.3/15.0
- DSCR +9.3/10.0
- 1% rule +6.5/10.0
- Rent growth +2.9/5.0
- Livability +2.7/5.0
- Condition / age +2.5/5.0
- Schools +1.2/10.0
- Appreciation +0.0/10.0
$125,090
🖨 Deal sheet 📄 Offer letter ✓ Due diligence
Listing remarks
In quiet neighborhood. Completely updated. Large fenced in backyard, Low utilities. No dogs allowed or cats. Great investment property for the first time Investor. It has a wonderful tenant that pays on time and consistent. The tenant has been there eight years. And is handicap. .. New flooring, updated fixtures, stove and refrigerator supply Tenant agrees to pay for and responsible for arranging and paying for all utility services required on the Premises electricity, trash, sewer and cold water and gas which accounts established by tenant directly with the applicable utility companies. Sewer bill will be kept in the name of Property owners. But is the responsibility of the tenant. Tenant
Key facts
- New flooring
- Updated fixtures
- Built 1955
Tags
Neighborhood map
What this means for you Summary
Snapshot
- This is a 3-bed/2.0-bath single-family listed at $125k.
Deal economics
- At list price, monthly cash flow is $347 ($4k/yr) — positive.
- The deal already cash-flows at list — no discount required.
- Meets the 1% rule at list price ($1k rent vs $125k).
- Recommended offer: $121k (3.0% below list) — sets the bar for market timing.
Location & tenants
- Location reads 54/100 on livability (#774 in MO) — a working-class tenant base; expect higher turnover. Strengths: cost of living A+, housing A; Watch: health & safety C-, schools F, crime F.
- Ferguson-Florissant R-II (suburban): math 7% / reading 20% proficiency, ranked #311 of 324 in MO (top 96%) — low school quality limits family demand, transient renter base, plan for 1-2y turnover; 70% free/reduced lunch — lower-income household profile, screen leases tightly.
- Market conditions: Rents rising (+1.6%/yr); 70 active listings in the ZIP; 34 comparable units currently listed for rent nearby; rentals at typical pace (median 24d on market — plan ~3-4 weeks tenant-placement turnaround); lower-income renter base — watch delinquency; 920 units permitted in St. Louis County in 2024 (250 in 5+ unit buildings).
- This rent runs 39% of the median local income ($45k/yr) — at the standard rent-burdened threshold; future hikes will face affordability resistance.
Forward outlook
- Local home prices are declining (-3.0%/yr); year-one equity from $864 of loan paydown is wiped out by about $4k of value loss. Plan a longer hold.
Negotiation context
- It's been on market 35 days — a 3% lower offer ($121k) is reasonable based on typical stale-listing flexibility.
Risks & watch-outs
- Watch-outs: built in 1955 — expect roof / HVAC / electrical / plumbing capex.
- Climate carrying-cost: extreme-heat days projected 7→21/yr by 2055 (HVAC capex compounding) — expect insurance premiums to compound above CPI over the hold.
Questions for the listing agent
- It's been on market 35 days. Have you received any prior offers? Is the seller open to a 3% concession, seller financing, or rate buy-down credit?
- Built in 1955 — when were the roof, HVAC, electrical panel, plumbing, and water heater last replaced?
- Is there a deadline driving the sale (1031 exchange, divorce, estate, relocation)? That informs how much negotiation room exists.
- Schools are F-rated, which usually means shorter tenancies and higher turnover. Who's the typical renter profile here, and what's been the actual vacancy rate?
- Crime grade is F in this area — have there been break-ins, vandalism, or insurance claims at this property in the last 3 years? What carrier currently insures it and at what premium?
- What's the average days-on-market for RENTAL listings here right now (not sales)? A rising rental-DOM trend means longer vacancies and softer asking-rent achievability than the comps imply.
- What's the recent tenant-quality profile in this submarket — average credit score on applications, eviction rate, late-payment / NSF rate, and stable-employment percentage? A property-management company in the area should have these aggregated.
- How much new for-sale + rental construction is in the pipeline within 1–3 miles? Heavy new supply typically softens prices + rents 12–24 months out; constrained supply supports both.
Investment metrics
- 1% rule
- 1.15% ✓
- Cap rate
- 9.62%
- Cash-on-cash
- 11.89%
- DSCR
- 1.53
- GRM
- 7.3
CMA / ARV
- ARV (median comp)
- $136,515
- List price
- $125,090
- Delta
- -8.37%
- Verdict
- FAIR
- Comps
- 20 within 1.0 mi
Show comp detail 12 sales within ~0.75 mi
| Address | Dist | Beds/Ba | Sqft | Sold | Price | $/sf | Match |
|---|---|---|---|---|---|---|---|
| 8406 January Ave | 0.16mi | 3/2.0 | 1,288 (0%) | 2mo | $160,000 | $124 | 91 |
| 8443 Red Fir Dr | 0.20mi | 3/2.0 | 1,288 (0%) | 2mo | $32,000 | $25 | 89 |
| 8418 Midwood Ave | 0.26mi | 3/2.0 | 1,288 (0%) | 2mo | $125,000 | $97 | 86 |
| 6604 Graybirch Dr | 0.35mi | 3/2.0 | 1,288 (0%) | 1mo | $124,900 | $97 | 83 |
| 8513 Midwood Ave | 0.14mi | 3/2.0 | 1,176 (-9%) | 0mo | $94,900 | $81 | 78 |
| 6837 Saint Olaf Dr | 0.36mi | 3/1.0 | 1,140 (-12%) | 2mo | $120,000 | $105 | 58 |
| 6245 Evergreen Blvd | 0.52mi | 4/1.5 (+1) | 1,210 (-6%) | 2mo | $144,900 | $120 | 57 |
| 6801 Knoll Ave | 0.64mi | 3/1.0 | 1,224 (-5%) | 1mo | $104,900 | $86 | 57 |
| 8301 Pepperidge Dr | 0.37mi | 3/1.0 | 1,120 (-13%) | 1mo | $139,900 | $125 | 56 |
| 8302 Woodhurst Dr | 0.47mi | 3/1.0 | 1,120 (-13%) | 1mo | $99,900 | $89 | 52 |
| 8219 Davenport Dr | 0.68mi | 3/1.0 | 1,116 (-13%) | 1mo | $115,000 | $103 | 42 |
| 6219 Tyndall Dr | 0.63mi | 2/1.5 (-1) | 1,128 (-12%) | 2mo | $94,900 | $84 | 41 |
Match score weights: distance 35% · size 25% · config 20% · recency 20%. Top-matched comps best support the ARV.
Projected returns pro-forma
-3.0% appreciation · 1.61% rent growth · sell at horizon
- IRR
- -0.1%
- Equity multiple
- 0.99×
- Total profit
- $-175
- Equity at exit
- $18,651
- IRR
- 8.1%
- Equity multiple
- 1.58×
- Total profit
- $20,295
- Equity at exit
- $10,815
Cash invested: $35,025 (down + closing). Projections, not guarantees.
Landlord ↔ Tenant lean methodology
- Overall (STATE)
- 81 Strongly Landlord-Friendly
- State Missouri
- 81 Strongly Landlord-Friendly · R+10
- County
- — inherits STATE
- City
- — inherits STATE
ZIP-level market 63134
- Rents YoY
- 1.6%
- Active inventory
- 70
- Price-to-rent
- 7.3×
Monthly cashflow live
- Estimated rent
- $1,437 high interval (Pro) →
- Mortgage (P&I)
- −$656
- Tax from tax record
- −$80 /mo · $962/yr
- Insurance
- −$52
- HOA
- −$0
- Vacancy / Maint / Mgmt
- −$302
- Net cashflow
- $347
Break-even live
UW: 25.0% down · 7.5% · 30yr · 1.5% tax · 5.0% vac · 8.0% maint · 8.0% mgmt
Financing live
Cash to close
- Down payment
- $31,272
- Closing costs
- $3,753
- Reserves months
- —
- Total cash needed
- —
Loan-product check · same deal, 3 products live
Conventional
25% down · 7.5% · 30yr
- Down + closing
- —
- Monthly P&I
- —
- Monthly cashflow
- —
- DSCR
- —
- Eligible?
- —
Personal DTI + credit; lowest rate.
DSCR
20% down · 8.5% · 30yr
- Down + closing
- —
- Monthly P&I
- —
- Monthly cashflow
- —
- DSCR
- —
- Eligible?
- —
No personal income docs; deal must DSCR.
Hard money
10% down · 12.0% · 12mo
- Down + closing
- —
- Monthly P&I
- —
- Monthly cashflow
- —
- DSCR
- —
- Eligible?
- —
Short-term bridge; refi at stabilization.
Rent comps 34 comps
| Address | Beds | Baths | Sqft | Rent | $/sqft | DOM | Units | Dist |
|---|---|---|---|---|---|---|---|---|
| 8437 January Ave Saint Louis, MO | 3.0 | 2.0 | 1288 | $1,350 | $1.05 | 44d | 1 | 0.11mi |
| 6698 Amora Ave Berkeley, MO | 2.0–3.0 | 1.5 | 1625 | $1,500 | $0.92 | 44d | 1 | 0.18mi |
| 8439 Alder Ave Saint Louis, MO | 3.0 | 1.5 | 1176 | $1,425 | $1.21 | 24d | 1 | 0.19mi |
| 6452 Evergreen Blvd Saint Louis, MO | 3.0 | 2.0 | 1288 | $1,500 | $1.16 | 24d | 1 | 0.25mi |
| 8418 Bayberry Dr Saint Louis, MO | 3.0 | 2.0 | 1288 | $1,350 | $1.05 | 22d | 1 | 0.29mi |
| 8412 Chalons Ct Saint Louis, MO | 3.0 | 1.0 | 1380 | $1,370 | $0.99 | 24d | 1 | 0.33mi |
| 8330 Woodhurst Dr Saint Louis, MO | 3.0 | 1.0 | 1120 | $1,000 | $0.89 | 8d | 1 | 0.42mi |
| 7025 Richwood Ln Hazelwood, MO | 3.0 | 1.0 | 936 | $1,375 | $1.47 | 18d | 1 | 0.72mi |
| 260 Sadonia Ave Saint Louis, MO | 3.0 | 2.0 | 1088 | $1,623 | $1.49 | 20d | 1 | 0.74mi |
| 263 Sadonia Ave Saint Louis, MO | 3.0 | 2.0 | 888 | $1,350 | $1.52 | 44d | 1 | 0.76mi |
| 6625 Thurston Ave Saint Louis, MO | 2.0 | 1.0 | 939 | $1,300 | $1.38 | 44d | 1 | 0.77mi |
| 6625 Thurston Ave Saint Louis, MO | 2.0 | 1.0 | 939 | $1,400 | $1.49 | 24d | 1 | 0.77mi |
| 6867 Thurston Ave Saint Louis, MO | 3.0 | 2.0 | 1243 | $1,580 | $1.27 | 44d | 1 | 0.78mi |
| 6042 Hancock Ave Berkeley, MO | 3.0 | 1.0 | 1041 | $1,495 | $1.44 | 24d | 1 | 0.85mi |
| 6044 Cascade Dr Saint Louis, MO | 2.0 | 1.0 | 984 | $1,150 | $1.17 | 8d | 1 | 0.90mi |
| 171 Elbring Dr Saint Louis, MO | 3.0 | 1.5 | 1008 | $1,395 | $1.38 | 12d | 1 | 0.90mi |
| 153 Bascom Dr Saint Louis, MO | 3.0 | 1.0 | 1076 | $1,195 | $1.11 | 20d | 1 | 0.93mi |
| 541 Hentschel Pl Saint Louis, MO | 2.0 | 1.0 | 1305 | $1,500 | $1.15 | 4d | 1 | 0.97mi |
| 8507 Tally Ho Dr Hazelwood, MO | 2.0 | 1.5 | 1478 | $1,300 | $0.88 | 44d | 5 | 1.01mi |
| 107 Anistasia Dr Saint Louis, MO | 2.0 | 2.0 | 1030 | $1,400 | $1.36 | 24d | 1 | 1.05mi |
| 46 Bascom Dr Saint Louis, MO | 2.0 | 1.0 | 932 | $1,175 | $1.26 | 44d | 1 | 1.06mi |
| 6156 Wulff Dr Saint Louis, MO | 3.0 | 2.0 | 960 | $1,425 | $1.48 | 11d | 1 | 1.08mi |
| 221 Barto Dr Saint Louis, MO | 3.0 | 2.0 | 958 | $1,295 | $1.35 | 20d | 1 | 1.09mi |
| 1131 N Florissant Rd Saint Louis, MO | 3.0 | 1.0 | 1580 | $1,390 | $0.88 | 24d | 1 | 1.15mi |
| 1275 N Florissant Rd Saint Louis, MO | 2.0 | 1.0 | 1008 | $1,275 | $1.26 | 24d | 1 | 1.15mi |
| 11 Anistasia Dr Saint Louis, MO | 3.0 | 1.5 | 1120 | $1,345 | $1.20 | 24d | 1 | 1.17mi |
| 36 Connolly Dr Saint Louis, MO | 3.0 | 1.0 | 1024 | $1,149 | $1.12 | 24d | 1 | 1.17mi |
| 60 Mayme Dr Saint Louis, MO | 3.0 | 1.0 | 960 | $1,285 | $1.34 | 44d | 1 | 1.25mi |
| 910 Disco Dr Saint Louis, MO | 3.0 | 1.0 | 924 | $1,260 | $1.36 | 16d | 1 | 1.27mi |
| 5 Santa Cruz Dr Florissant, MO | 2.0 | 1.0 | 1410 | $1,411 | $1.00 | 16d | 1 | 1.30mi |
| 1455 S New Florissant Rd Florissant, MO | 4.0 | 1.0 | 1584 | $1,721 | $1.09 | 44d | 1 | 1.38mi |
| 17 Valley Dr Florissant, MO | 2.0 | 2.0 | 1356 | $1,525 | $1.12 | 44d | 1 | 1.45mi |
| 1250 S New Florissant Rd Florissant, MO | 2.0 | 1.0 | 1150 | $1,500 | $1.30 | 15d | 1 | 1.47mi |
| 1465 W Duchesne Dr Florissant, MO | 3.0 | 1.0 | 896 | $1,500 | $1.67 | 44d | 1 | 1.48mi |
Listing history 13 events
-
2026-06-16days on market $125,090 Active 35 DOM
-
2026-06-15days on market $125,090 Active 34 DOM
-
2026-06-13days on market $125,090 Active 32 DOM
-
2026-06-13days on market $125,090 Active 31 DOM
-
2026-06-09days on market $125,090 Active 28 DOM
-
2026-06-08days on market $125,090 Active 27 DOM
-
2026-06-07days on market $125,090 Active 26 DOM
-
2026-06-05days on market $125,090 Active 23 DOM
-
2026-06-03days on market $125,090 Active 22 DOM
-
2026-06-02days on market $125,090 Active 21 DOM
-
2026-06-01days on market $125,090 Active 20 DOM
-
2026-05-31days on market $125,090 Active 19 DOM
-
2026-05-12$125,090 Active 730-char remark
ⓘ Source: listings_history table (triggers on properties + properties_extension) + one-shot
backfill from property_details.listing_events for pre-trigger history.
Tax reassessment forecast MO · Resets to sale price
- Current annual tax
- $962 · $80/mo
- Projected year-2 tax
- $1,213 · $101/mo
- Expected delta
- +$252/yr (+$21/mo · 26.2%)
ⓘ Screening estimate from a state-policy table — verify with the county assessor before closing.
Climate risk First Street
- Flood 1/10 Low FEMA zone X (unshaded) · 0% chance over 30 yrs
- Wildfire 1/10 Low
- Heat 5/10 Major 7 d/yr ≥106°F today · 21 d/yr by 30 yrs out
- Wind 2/10 Low 100% chance of damaging wind over 30 yrs
- Air quality 3/10 Moderate 3 unhealthy d/yr today · 5 by 30 yrs out
Nearby sold comps map
Loading sold comps map…
Walkable amenities ~0.75 mi
Loading nearby amenities…
Taxation est. · year 1
- Rental income
- $17,245
- − Mortgage interest
- −$7,007
- − Property taxes
- −$962
- − Insurance
- −$625
- − Repairs & maintenance
- −$1,380
- − Management
- −$1,380
- − Depreciation
- −$3,639
- Taxable income
- $2,252
- Est. tax owed @ 24.0%
- −$541
- After-tax cash flow
- $3,624/yr
For passive investors: Depreciation is non-cash, so a rental often shows a tax loss while cash-flowing — sheltering income. Rental losses are passive: they offset passive income freely, and up to $25,000/yr can offset ordinary (W-2) income if you actively participate and your MAGI is under $100k (phasing out to $0 by $150k); unused losses carry forward. On sale, claimed depreciation is recaptured at up to 25%, and gains may owe capital-gains tax (a 1031 exchange can defer both). Figures are a year-1 estimate at your 24.0% rate — not tax advice; consult a CPA.
Schools (NCES district)
- District
- Ferguson-Florissant R-II
- NCES district ID
- 2912010
- Math proficiency
- 7% ▼ -9.00%
- Reading proficiency
- 20% ▼ -6.00%
- Median HH income
- $44,610
- Composite
- 11.96/100
- National rank
- #9666
- State rank
- #311 of 324 in MO
Livability — Berkeley
- Score
- 54/100
- State rank
- #774
- US rank
- #23800
Category grades
Schools grade is shown separately in the Schools card above.
Census & demographics
- Census place
- Berkeley, MO
- County
- Saint Louis County · 888,823 people
- City population
- 13,059
- Metro
- St. Louis, MO-IL
- Population (ZIP)
- 13,059
- Household income
- $44,680
- Rent vs Own
- Severe rent burden
- 655.0
Population outlook (St. Louis County) Hauer SSP2
- Today (2025)
- 1,025,227 people
- By 2030
- 1,028,023 · +0.3%
- By 2040
- 1,020,940 · -0.4%
- By 2050
- 1,007,280 · -1.8%
- By 2075
- 987,277 · -3.7%
- By 2100
- 921,984 · -10.1%
Race, ethnicity, and origin ACS 2023
- Neighborhood character
- Predominantly Black (66%)
- Race & ethnicity
- Black 66% White 17% Hispanic / Latino 13% Two or more races 7%
- Hispanic origin (detail)
- Mexican 8%
- Common ancestry
- Lithuanian 1%
- Foreign-born
- 6% · Canada
- Languages at home
- 86% English-only · Spanish 11%
Political lean MEDSL · St. Louis
- 2024 margin
- Strong D (+23.4) · D 60.8% · R 37.4% · Other 1.7%
- 2008→2024 swing
- +3.5pp toward D · 2008: 19.9pp · 2024: 23.4pp
- All cycles
- 2024: D+23.4 2020: D+24.0 2016: D+16.2 2012: D+13.7 2008: D+19.9
Not yet ingested
- Civics
- —
Market trends
- HPI YoY
- ▼ -164.02%
- Current HPI
- 226.9524
- Rent YoY
- ▲ 1.61%
- Metro
- St. Louis, MO-IL
- State GDP YoY
- ▲ 1.84%
- F500 in state
- 20
Industry mix (Fortune 500 HQ in MO)
| Industry | F500 HQs | Revenue |
|---|---|---|
| Healthcare | 1 | $163B |
|
||
| Insurance | 1 | $21B |
|
||
| Industrial Technology | 1 | $17B |
|
||
| Retail | 1 | $16B |
|
||
| Industrial Distribution | 1 | $10B |
|
||
| Utilities | 1 | $9B |
|
||
Property tax history
+2.8%/yrLatest (2022): $962 · +0.7% YoY. Source: county tax records.
Cash-flow waterfall
monthlySold comps — $/sqft
last 12 mo · ≤1 miLoading sold comps…