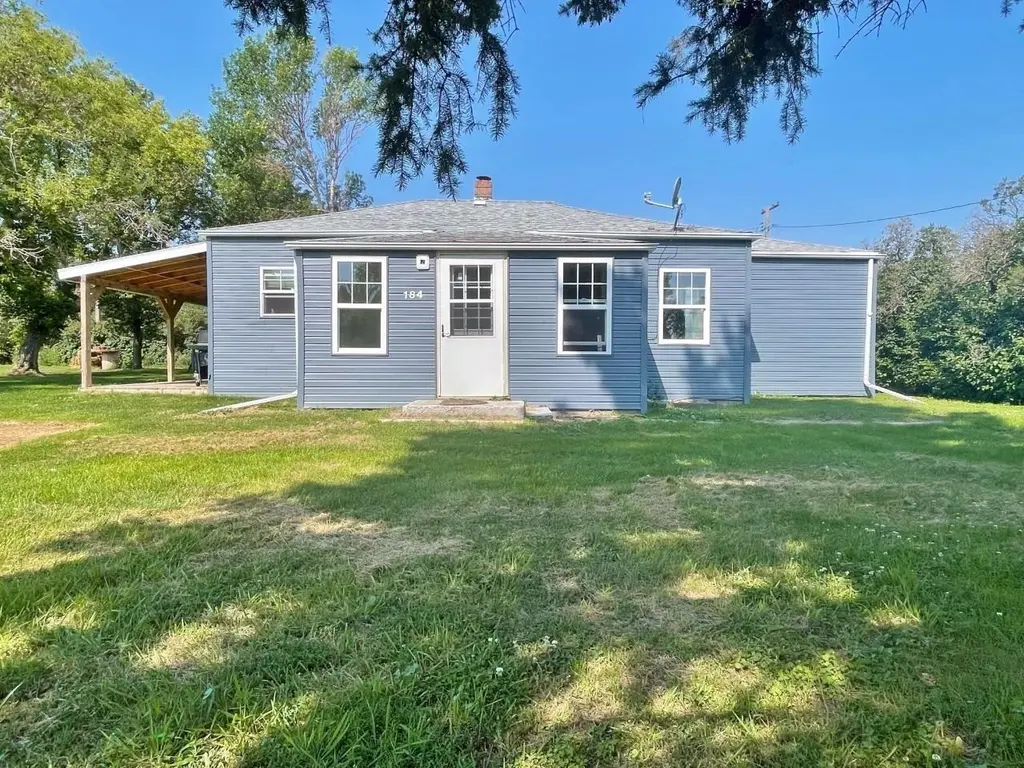
184 Charles St · Kramer, ND
Flood risk 1/10 · Minimal
- FEMA flood zone
- D
- Chance of flooding over 30 yrs
- 0.0%
- Est. flood insurance / yr
- $400 – $4,352
Fire risk 1/10 · Minimal
- Est. fire insurance / yr
- $1,289 – $2,393
Heat risk 1/10 · Minimal
- Hot days now (above 95°F)
- 7 days/yr
- Hot days in 30 yrs
- 12 days/yr
Wind risk 1/10 · Minimal
- Chance of severe wind over 30 yrs
- —
Air-quality risk 5/10 · Moderate
- Unhealthy air days now
- 8 days/yr
- Unhealthy air days in 30 yrs
- 8 days/yr
Risk factors via First Street. Map © Google.
Why this score? — see what drove the C- grade
The composite is a weighted blend of 9 inputs, each scored 0–100. Each bar is that input's sub-score; the figure is the points it added to the 100-point composite (weight × sub-score).
- Cash flow +19.0/30.0
- ARV discount +7.5/15.0
- DSCR +6.0/10.0
- Appreciation +5.0/10.0
- Schools +4.5/10.0
- 1% rule +4.0/10.0
- Livability +3.0/5.0
- Rent growth +2.5/5.0
- Condition / age +2.5/5.0
$109,990
🖨 Deal sheet (PDF) 📄 Offer letter ✓ Due diligence
Key facts
- 0.69 acre lot
- 2 garage spots
- Built 1940
Property features AI
Exterior
- Parking: 2-car garage; Gravel parking
- Utilities: Public water; Public sewer
- Home design: Single-family residence; One story
- Construction: Below-grade finished area present
- Exterior features: Deck; Shed(s)
Interior
- Kitchen: Microwave; Range; Oven; Refrigerator
- Heating & cooling: Electric heating
- Interior features: Microwave; Range; Oven; Refrigerator; Unfinished basement
Neighborhood map
What this means for you Summary
Snapshot
- This is a 2-bed/1.0-bath other listed at $110k.
Deal economics
- At list price, monthly cash flow is $115 ($1k/yr) — positive.
- The deal already cash-flows at list — no discount required.
- To meet the 1% rule (rent ≥ 1% of price), the offer needs to be $99k (9.8% below list).
- Recommended offer: $99k (9.8% below list) — sets the bar for 1% rule.
Location & tenants
- Location reads 59/100 on livability (#281 in ND) — a working-class tenant base; expect higher turnover. Strengths: cost of living A+, housing A+; Watch: crime D+, employment D, amenities F.
- Newburg-United 54 (rural): math 40% / reading 60% proficiency, ranked #49 of 169 in ND (top 29%) — acceptable for families but not a draw, mixed tenant base, ~2y average lease.
- Zoned schools: Newburg-United Elementary School (math 30% / reading 50%, grade F, #135 of 236 statewide, top 57%, 60 students, 42% FRL); Newburg-United High School (math 24% / reading 75%, 26 students, 38% FRL) — zoned schools average 40% FRL vs 24% district-wide (17 pts higher); higher-poverty schools than district average — tighter screening recommended.
- Market conditions: 3 active listings in the ZIP; 10 units permitted in Bottineau County in 2024 (0 in 5+ unit buildings).
Forward outlook
- In year one you build about $4k of equity ($760 loan paydown + $3k appreciation (3.0% local appreciation)).
- Bottineau County population projected at +38% by 2050 — long-run rental-demand tailwind backs the buy-and-hold thesis.
- At projected returns (3.0% appreciation + 3.0% rent growth), your $31k cash investment doubles in ~5 years — after that, you're playing with house money.
- By year 8, paydown + projected appreciation supports a ~$30k cash-out refi (75% LTV) — recoverable capital for the next deal without selling this one.
Negotiation context
- It's been on market 72 days — a 6% lower offer ($103k) is reasonable based on typical stale-listing flexibility.
- 2 sale attempts with the ask held roughly flat each time — persistent listings suggest the price (not the market) is what's stuck; bring a comps-based counter.
- Current owner paid $21k; list at $110k implies a 416% gain — meaningful room to come down on a strong offer.
Risks & watch-outs
- Watch-outs: built in 1940 — expect roof / HVAC / electrical / plumbing capex.
Questions for the listing agent
- It's been on market 72 days. Have you received any prior offers? Is the seller open to a 10% concession, seller financing, or rate buy-down credit?
- Built in 1940 — when were the roof, HVAC, electrical panel, plumbing, and water heater last replaced?
- Why hasn't it sold? Are there any deal-killer items the seller is aware of (foundation, flood, title, zoning, code violations)?
- Is there a deadline driving the sale (1031 exchange, divorce, estate, relocation)? That informs how much negotiation room exists.
- Schools are F-rated, which usually means shorter tenancies and higher turnover. Who's the typical renter profile here, and what's been the actual vacancy rate?
- Crime grade is D in this area — have there been break-ins, vandalism, or insurance claims at this property in the last 3 years? What carrier currently insures it and at what premium?
- What's the average days-on-market for RENTAL listings here right now (not sales)? A rising rental-DOM trend means longer vacancies and softer asking-rent achievability than the comps imply.
- What's the recent tenant-quality profile in this submarket — average credit score on applications, eviction rate, late-payment / NSF rate, and stable-employment percentage? A property-management company in the area should have these aggregated.
- How much new for-sale + rental construction is in the pipeline within 1–3 miles? Heavy new supply typically softens prices + rents 12–24 months out; constrained supply supports both.
Investment metrics
- 1% rule
- 0.90% ✗
- Cap rate
- 7.54%
- Cash-on-cash
- 4.47%
- DSCR
- 1.20
- GRM
- 9.2
CMA / ARV
No comps found within radius.
Projected returns pro-forma
3.0% appreciation · 3.0% rent growth · sell at horizon
- IRR
- 11.7%
- Equity multiple
- 1.67×
- Total profit
- $20,518
- Equity at exit
- $49,456
- IRR
- 13.8%
- Equity multiple
- 3.04×
- Total profit
- $62,759
- Equity at exit
- $76,218
Cash invested: $30,797 (down + closing). Projections, not guarantees.
Landlord ↔ Tenant lean methodology
- Overall (STATE)
- 82 Strongly Landlord-Friendly
- State North Dakota
- 82 Strongly Landlord-Friendly · R+20
- County
- — inherits STATE
- City
- — inherits STATE
ZIP-level market 58748
- Active inventory
- 3
- Price-to-rent
- 9.2×
Monthly cashflow live
- Estimated rent
- $992 medium interval (Pro) →
- Mortgage (P&I)
- −$577
- Tax from tax record
- −$46 /mo · $555/yr
- Insurance
- −$46
- HOA
- −$0
- Vacancy / Maint / Mgmt
- −$208
- Net cashflow
- $115
Break-even live
Sensitivity live
| Price | -10% $177 | -5% $146 | +0% $115 | +5% $84 | +10% $52 |
|---|---|---|---|---|---|
| Rent | -10% $36 | -5% $76 | +0% $115 | +5% $154 | +10% $193 |
| Rate | -1.0pp $170 | -0.5pp $143 | base $115 | +0.5pp $86 | +1.0pp $57 |
UW: 25.0% down · 7.5% · 30yr · 1.5% tax · 5.0% vac · 8.0% maint · 8.0% mgmt
Financing live
Cash to close
- Down payment
- $27,498
- Closing costs
- $3,300
- Reserves months
- —
- Total cash needed
- —
Loan-product check · same deal, 3 products live
Conventional
25% down · 7.5% · 30yr
- Down + closing
- —
- Monthly P&I
- —
- Monthly cashflow
- —
- DSCR
- —
- Eligible?
- —
Personal DTI + credit; lowest rate.
DSCR
20% down · 8.5% · 30yr
- Down + closing
- —
- Monthly P&I
- —
- Monthly cashflow
- —
- DSCR
- —
- Eligible?
- —
No personal income docs; deal must DSCR.
Hard money
10% down · 12.0% · 12mo
- Down + closing
- —
- Monthly P&I
- —
- Monthly cashflow
- —
- DSCR
- —
- Eligible?
- —
Short-term bridge; refi at stabilization.
Listing history 24 events
-
2026-06-21days on market $109,990 Active 72 DOM
-
2026-06-21days on market $109,990 Active 71 DOM
-
2026-06-18days on market $109,990 Active 69 DOM
-
2026-06-17days on market $109,990 Active 68 DOM
-
2026-06-16days on market $109,990 Active 67 DOM
-
2026-06-15days on market $109,990 Active 66 DOM
-
2026-06-13days on market $109,990 Active 64 DOM
-
2026-06-12days on market $109,990 Active 63 DOM
-
2026-06-09days on market $109,990 Active 60 DOM
-
2026-06-08days on market $109,990 Active 59 DOM
-
2026-06-07days on market $109,990 Active 58 DOM
-
2026-06-05days on market $109,990 Active 56 DOM
-
2026-06-04days on market $109,990 Active 54 DOM
-
2026-06-02days on market $109,990 Active 53 DOM
-
2026-06-01days on market $109,990 Active 52 DOM
-
2026-05-31days on market $109,990 Active 51 DOM
-
2026-04-10$109,990 Active
-
2025-07-14price $114,900
-
2025-05-06$119,900 Active
-
2024-09-20price $114,900
-
2021-07-28soldstatus $21,300
-
2016-06-24soldstatus $30,000
-
2015-08-03soldstatus
-
2011-09-21soldstatus
ⓘ Source: listings_history table (triggers on properties + properties_extension) + one-shot
backfill from property_details.listing_events for pre-trigger history.
Tax reassessment forecast ND · Resets to sale price
- Current annual tax
- $555 · $46/mo
- Projected year-2 tax
- $1,078 · $90/mo
- Expected delta
- +$523/yr (+$44/mo · 94.3%)
ⓘ Screening estimate from a state-policy table — verify with the county assessor before closing.
Climate risk First Street
- Flood 1/10 Low FEMA zone D · 0% chance over 30 yrs
- Wildfire 1/10 Low
- Heat 1/10 Low 7 d/yr ≥95°F today · 12 d/yr by 30 yrs out
- Wind 1/10 Low
- Air quality 5/10 Major 8 unhealthy d/yr today · 8 by 30 yrs out
Nearby sold comps map
Loading sold comps map…
Walkable amenities ~0.75 mi
Loading nearby amenities…
Taxation est. · year 1
- Rental income
- $11,903
- − Mortgage interest
- −$6,161
- − Property taxes
- −$555
- − Insurance
- −$550
- − Repairs & maintenance
- −$952
- − Management
- −$952
- − Depreciation
- −$3,200
- Taxable loss
- −$467
- Est. tax savings @ 24.0%
- +$112
- After-tax cash flow
- $1,489/yr
For passive investors: Depreciation is non-cash, so a rental often shows a tax loss while cash-flowing — sheltering income. Rental losses are passive: they offset passive income freely, and up to $25,000/yr can offset ordinary (W-2) income if you actively participate and your MAGI is under $100k (phasing out to $0 by $150k); unused losses carry forward. On sale, claimed depreciation is recaptured at up to 25%, and gains may owe capital-gains tax (a 1031 exchange can defer both). Figures are a year-1 estimate at your 24.0% rate — not tax advice; consult a CPA.
Schools (NCES district)
- District
- Newburg-United 54
- NCES district ID
- 3800825
- Math proficiency
- 40% ▲ 10.00%
- Reading proficiency
- 60% ▲ 10.00%
- Median HH income
- $54,405
- Composite
- 45.18/100
- National rank
- #5787
- State rank
- #49 of 169 in ND
Livability — Kramer
- Score
- 59/100
- State rank
- #281
- US rank
- #20005
Category grades
Schools grade is shown separately in the Schools card above.
Census & demographics
- Census place
- Kramer, ND
- Population (ZIP)
- 149
Population outlook (Bottineau County) Hauer SSP2
- Today (2025)
- 7,367 people
- By 2030
- 7,789 · +5.7%
- By 2040
- 8,818 · +19.7%
- By 2050
- 10,174 · +38.1%
- By 2075
- 15,137 · +105.5%
- By 2100
- 19,942 · +170.7%
Race, ethnicity, and origin ACS 2023
- Neighborhood character
- Predominantly White (95%)
- Race & ethnicity
- White 95% Native American 5%
- Common ancestry
- Portuguese 9% Lithuanian 8% Scottish 7%
- Languages at home
- 99% English-only · Other Indo-European 1%
Political lean MEDSL · Bottineau
- 2024 margin
- Solid R (+55.3) · D 21.5% · R 76.8% · Other 1.7%
- 2008→2024 swing
- -36.2pp toward R · 2008: -19.1pp · 2024: -55.3pp
- All cycles
- 2024: R+55.3 2020: R+50.5 2016: R+50.9 2012: R+31.1 2008: R+19.1
Not yet ingested
- Civics
- —
Market trends
- HPI YoY
- —
- Current HPI
- —
- Rent YoY
- —
- Metro
- —
- State GDP YoY
- ▲ 2.09%
- F500 in state
- 2
Industry mix (Fortune 500 HQ in ND)
| Industry | F500 HQs | Revenue |
|---|---|---|
| Utilities / Construction | 1 | $6B |
|
||
Price history
+266.6% since first listed8 events — show timeline
- 2026-04-10 Listed $109,990 MMLS
- 2025-07-14 Price Changed $114,900 MMLS
- 2025-05-06 Listed $119,900 MMLS
- 2024-09-20 Price Changed $114,900 MMLS
- 2021-07-28 Sold (Public Records) $21,300 Public Records
- 2016-06-24 Sold (Public Records) $30,000 Public Records
- 2015-08-03 Sold (Public Records) — Public Records
- 2011-09-21 Sold (Public Records) — Public Records
Property tax history
+11.5%/yrLatest (2024): $555 · +23.8% YoY. Source: county tax records.
Cash-flow waterfall
monthlySold comps — $/sqft
last 12 mo · ≤1 miLoading sold comps…