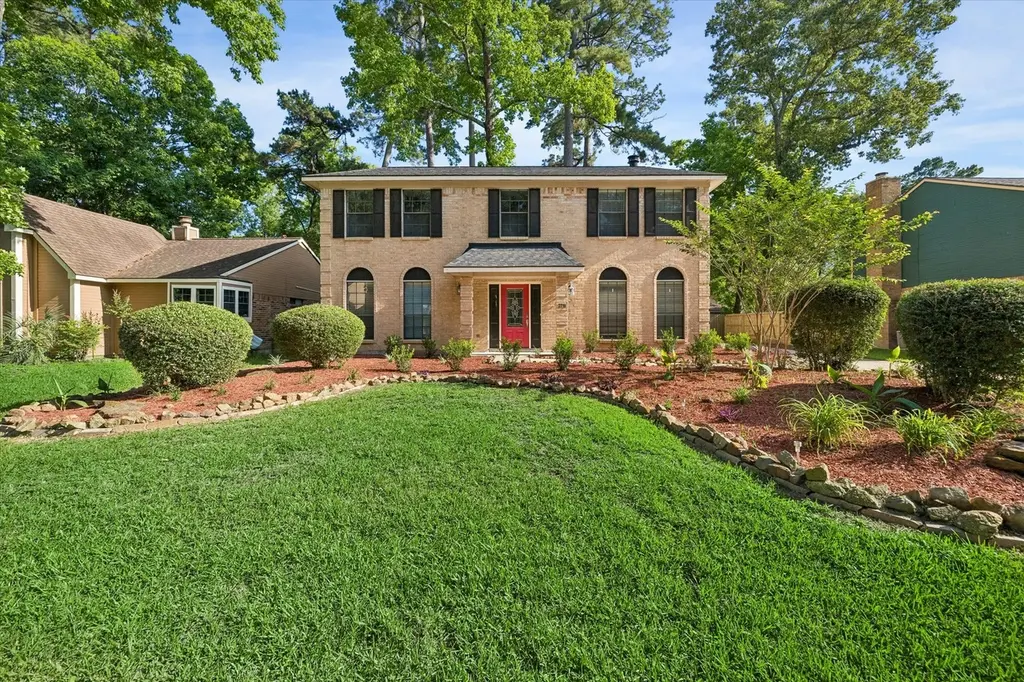
2710 Golden Leaf Dr · Houston, TX
Flood risk 1/10 · Minimal
- FEMA flood zone
- X (unshaded)
- Chance of flooding over 30 yrs
- 0.0%
- Est. flood insurance / yr
- $507 – $1,088
Fire risk 1/10 · Minimal
- Est. fire insurance / yr
- $1,222 – $2,270
Heat risk 8/10 · Major
- Hot days now (above 111°F)
- 7 days/yr
- Hot days in 30 yrs
- 23 days/yr
Wind risk 9/10 · Severe
- Chance of severe wind over 30 yrs
- 99.0%
Air-quality risk 3/10 · Minor
- Unhealthy air days now
- 2 days/yr
- Unhealthy air days in 30 yrs
- 3 days/yr
Risk factors via First Street. Map © Google.
Why this score? — see what drove the D grade
The composite is a weighted blend of 9 inputs, each scored 0–100. Each bar is that input's sub-score; the figure is the points it added to the 100-point composite (weight × sub-score).
- ARV discount +12.6/15.0
- Cash flow +6.7/30.0
- Appreciation +5.2/10.0
- Schools +3.9/10.0
- Livability +3.7/5.0
- 1% rule +2.9/10.0
- Condition / age +2.5/5.0
- Rent growth +2.4/5.0
- DSCR +1.0/10.0
$279,900
🖨 Deal sheet 📄 Offer letter ✓ Due diligence
Listing remarks MLS
BACK ON THE MARKET! New roof, new stove, WDI report and warranty. This beautiful, well-maintained home is located on a cut-de-sac street that connects to the greenbelt. Refrigerator, washer and dryer and playground all convey win the sale. Transferable home warranty being offered by the Seller.
Key facts
- Cul-de-sac street
- Covered patio
- Recent roof
Tags
Property features AI
Finance
- HOA & community: Part of the Sterling association; Annual association fee of $375 covering common areas; Curbs in the community
Exterior
- Parking: Detached garage; Two garage spaces
- Utilities: Public water; Public sewer
- Home design: Residential property; Built in 1983; Slab foundation; Composition roof
- Construction: Brick and wood siding construction
- Exterior features: Fenced backyard; Private yard; Concrete road access; Subdivision setting
Interior
- Kitchen: Dishwasher; Electric range / free-standing range; Microwave; Built-in oven; Garbage disposal
- Bedrooms: Primary bedroom on second level (20x12); Three additional bedrooms on second level (12x12; 13x10; 13x12)
- Flooring: Engineered hardwood; Tile
- Bathrooms: Two full bathrooms; One half bathroom
- Heating & cooling: Central heating (gas); Central electric air conditioning
- Interior features: Breakfast bar; Tub with shower; Ceiling fans; One fireplace; Seven total rooms
- Laundry & utility: Washer hookup; Electric dryer hookup
Neighborhood map
What this means for you Summary
Snapshot
- This is a 4-bed/2.5-bath single-family listed at $280k.
Deal economics
- At list price, monthly cash flow is $-443 ($-5k/yr) — negative.
- To cash-flow at today's rent, offer at most $202k (28.0% below list).
- To meet the 1% rule (rent ≥ 1% of price), the offer needs to be $220k (21.4% below list).
- Recommended offer: $202k (28.0% below list) — sets the bar for cash-flow.
- Cap rate 4.4% vs local median 3.2% in Houston — top-decile yield for the area; either an underpriced asset or a hidden risk that comps aren't pricing in. Stress-test before assuming the spread holds.
Location & tenants
- Location reads 74/100 on livability (#184 in TX, #4,771 nationally) — a middle-class / working-renter tenant base. Strengths: amenities A+, cost of living A+, housing A+; Watch: crime F.
- Humble ISD (urban): math 38% / reading 44% proficiency, ranked #262 of 826 in TX (top 32%) — families likely to look elsewhere, expect single-tenant / working-renter base with shorter leases.
- Zoned schools: Bear Branch El (math 48% / reading 57%, grade C-, #720 of 4,322 statewide, top 17%, 666 students, 20% FRL); Creekwood Middle (math 49% / reading 50%, grade C, #356 of 1,662 statewide, top 23%, 1,149 students, 21% FRL); Kingwood H S (math 60% / reading 71%, grade B, #193 of 1,632 statewide, top 12%, 2,898 students, 16% FRL).
- Zoned-school proficiency averages 56% at this address vs 41% district-wide (+15 pts) — the actual schools serving this property are materially stronger than the Humble ISD average implies; a family-tenant draw the district grade alone would hide.
- Market conditions: Rents soft (-0.6%/yr); 311 active listings in the ZIP; 18 comparable units currently listed for rent nearby; rentals at typical pace (median 24d on market — plan ~3-4 weeks tenant-placement turnaround); solid renter incomes; 29,883 units permitted in Harris County in 2024 (8,621 in 5+ unit buildings).
- This rent runs 31% of the median local income ($84k/yr) — at the standard rent-burdened threshold; future hikes will face affordability resistance.
Forward outlook
- In year one you build about $3k of equity ($2k loan paydown + $1k appreciation (0.5% local appreciation)).
- Harris County population projected at +47% by 2050 — long-run rental-demand tailwind backs the buy-and-hold thesis.
- By year 9, paydown + projected appreciation supports a ~$33k cash-out refi (75% LTV) — recoverable capital for the next deal without selling this one.
Negotiation context
- It's been on market 37 days — a 3% lower offer ($272k) is reasonable based on typical stale-listing flexibility.
- 3 sale attempts since 2y ago with the ask held roughly flat each time — persistent listings suggest the price (not the market) is what's stuck; bring a comps-based counter.
Risks & watch-outs
- Climate carrying-cost: severe wind risk, 99% chance of damaging wind over 30y; extreme-heat days projected 7→23/yr by 2055 (HVAC capex compounding) — expect insurance premiums to compound above CPI over the hold.
Questions for the listing agent
- What do current leases actually rent for vs. the listed asking? Can we see a recent rent roll and the last 12 months of T-12 income?
- It's been on market 37 days. Have you received any prior offers? Is the seller open to a 28% concession, seller financing, or rate buy-down credit?
- What does the HOA fee cover, when was the last increase, and are there any pending special assessments or reserve-fund shortfalls?
- Is there a deadline driving the sale (1031 exchange, divorce, estate, relocation)? That informs how much negotiation room exists.
- Schools are D-rated, which usually means shorter tenancies and higher turnover. Who's the typical renter profile here, and what's been the actual vacancy rate?
- Crime grade is F in this area — have there been break-ins, vandalism, or insurance claims at this property in the last 3 years? What carrier currently insures it and at what premium?
- The area grade is low — what's the realistic commute time and amenity access for the typical tenant pool here? Any planned neighborhood developments (good or bad) we should know about?
- What's the average days-on-market for RENTAL listings here right now (not sales)? A rising rental-DOM trend means longer vacancies and softer asking-rent achievability than the comps imply.
- What's the recent tenant-quality profile in this submarket — average credit score on applications, eviction rate, late-payment / NSF rate, and stable-employment percentage? A property-management company in the area should have these aggregated.
- How much new for-sale + rental construction is in the pipeline within 1–3 miles? Heavy new supply typically softens prices + rents 12–24 months out; constrained supply supports both.
Investment metrics
- 1% rule
- 0.79% ✗
- Cap rate
- 4.39%
- Cash-on-cash
- -6.78%
- DSCR
- 0.70
- GRM
- 10.6
CMA / ARV
- ARV (median comp)
- $315,597
- List price
- $279,900
- Delta
- -11.31%
- Verdict
- UNDERPRICED
- Comps
- 20 within 1.0 mi
Show comp detail 12 sales within ~0.75 mi
| Address | Dist | Beds/Ba | Sqft | Sold | Price | $/sf | Match |
|---|---|---|---|---|---|---|---|
| 2626 Silver Falls Dr | 0.24mi | 4/2.5 | 2,606 (+8%) | 3mo | $295,000 | $113 | 74 |
| 3215 Park Garden Dr | 0.72mi | 4/2.5 | 2,376 (-2%) | 2mo | $319,900 | $135 | 62 |
| 3747 Clear Falls Dr | 0.46mi | 3/3.0 (-1) | 2,251 (-7%) | 1mo | $240,000 | $107 | 59 |
| 4010 Garden Lake Dr | 0.39mi | 4/2.5 | 2,732 (+13%) | 4mo | $330,000 | $121 | 57 |
| 2915 Laurel Fork Dr | 0.41mi | 4/2.0 | 2,145 (-11%) | 4mo | $279,900 | $130 | 57 |
| 3407 Sandy Forks Dr | 0.60mi | 4/2.5 | 2,677 (+11%) | 3mo | $369,995 | $138 | 51 |
| 3211 Park Garden Dr | 0.71mi | 4/2.0 | 2,233 (-8%) | 1mo | $289,999 | $130 | 51 |
| 5322 Creek Shadows Dr | 0.63mi | 3/2.5 (-1) | 2,197 (-9%) | 1mo | $278,000 | $127 | 50 |
| 3302 Holly Green Dr | 0.68mi | 4/2.0 | 2,716 (+12%) | 1mo | $248,900 | $92 | 45 |
| 2311 Fir Grove Dr | 0.70mi | 4/2.5 | 2,741 (+13%) | 2mo | $369,900 | $135 | 44 |
| 5122 Creek Shadows Dr | 0.58mi | 3/2.5 (-1) | 2,072 (-14%) | 0mo | $299,900 | $145 | 44 |
| 5210 Creek Shadows Dr | 0.61mi | 3/2.5 (-1) | 2,072 (-14%) | 4mo | $269,900 | $130 | 39 |
Match score weights: distance 35% · size 25% · config 20% · recency 20%. Top-matched comps best support the ARV.
Projected returns pro-forma
0.48% appreciation · 0.0% rent growth · sell at horizon
- IRR
- -9.7%
- Equity multiple
- 0.54×
- Total profit
- $-36,335
- Equity at exit
- $88,014
- IRR
- -5.7%
- Equity multiple
- 0.39×
- Total profit
- $-48,117
- Equity at exit
- $111,337
Cash invested: $78,372 (down + closing). Projections, not guarantees.
Landlord ↔ Tenant lean methodology
- Overall (STATE)
- 87 Strongly Landlord-Friendly
- State Texas
- 87 Strongly Landlord-Friendly · R+5
- County
- — inherits STATE
- City
- — inherits STATE
ZIP-level market 77339
- Home prices YoY
- 0.2%
- Rents YoY
- -0.6%
- Active inventory
- 311
- Price-to-rent
- 10.6×
Monthly cashflow live
- Estimated rent
- $2,200 high interval (Pro) →
- Mortgage (P&I)
- −$1,468
- Tax from tax record
- −$566 /mo · $6,788/yr
- Insurance
- −$117
- HOA
- −$31
- Vacancy / Maint / Mgmt
- −$462
- Net cashflow
- $-443
Break-even live
UW: 25.0% down · 7.5% · 30yr · 1.5% tax · 5.0% vac · 8.0% maint · 8.0% mgmt
Financing live
Cash to close
- Down payment
- $69,975
- Closing costs
- $8,397
- Reserves months
- —
- Total cash needed
- —
Loan-product check · same deal, 3 products live
Conventional
25% down · 7.5% · 30yr
- Down + closing
- —
- Monthly P&I
- —
- Monthly cashflow
- —
- DSCR
- —
- Eligible?
- —
Personal DTI + credit; lowest rate.
DSCR
20% down · 8.5% · 30yr
- Down + closing
- —
- Monthly P&I
- —
- Monthly cashflow
- —
- DSCR
- —
- Eligible?
- —
No personal income docs; deal must DSCR.
Hard money
10% down · 12.0% · 12mo
- Down + closing
- —
- Monthly P&I
- —
- Monthly cashflow
- —
- DSCR
- —
- Eligible?
- —
Short-term bridge; refi at stabilization.
Rent comps 18 comps
| Address | Beds | Baths | Sqft | Rent | $/sqft | DOM | Units | Dist |
|---|---|---|---|---|---|---|---|---|
| 3918 Forest Village Dr Kingwood, TX | 4.0 | 2.5 | 2354 | $2,350 | $1.00 | 24d | 1 | 0.22mi |
| 3806 Village Oaks Dr Kingwood, TX | 4.0 | 2.5 | 2465 | $2,300 | $0.93 | 22d | 1 | 0.42mi |
| 3007 Birch Creek Dr Humble, TX | 3.0 | 2.0 | 1603 | $1,795 | $1.12 | 24d | 1 | 0.45mi |
| 2222 Riverford Dr Kingwood, TX | 3.0 | 3.0 | 1908 | $1,895 | $0.99 | 24d | 1 | 0.63mi |
| 3303 Sycamore Springs Dr Kingwood, TX | 4.0 | 2.5 | 2010 | $2,006 | $1.00 | 5d | 1 | 0.72mi |
| 2215 Silver Falls Dr Kingwood, TX | 4.0 | 2.0 | 2004 | $2,075 | $1.04 | 43d | 1 | 0.72mi |
| 3334 Birch Creek Dr Kingwood, TX | 5.0 | 3.5 | 2950 | $2,695 | $0.91 | 43d | 1 | 0.76mi |
| 3327 Sycamore Springs Dr Kingwood, TX | 3.0 | 2.0 | 1619 | $1,575 | $0.97 | 18d | 1 | 0.79mi |
| 3327 Sycamore Springs Dr Kingwood, TX | 3.0 | 2.0 | 1619 | $1,683 | $1.04 | 22d | 1 | 0.79mi |
| 4535 Echo Falls Dr Kingwood, TX | 4.0 | 2.5 | 2184 | $2,145 | $0.98 | 1d | 1 | 0.85mi |
| 3619 Maple Glen Dr Kingwood, TX | 4.0 | 2.0 | 2332 | $2,149 | $0.92 | 16d | 1 | 0.93mi |
| 2115 Oak Shores Dr Kingwood, TX | 3.0 | 2.0 | 1590 | $1,800 | $1.13 | 43d | 1 | 0.94mi |
| 3515 Hidden Pines Dr Kingwood, TX | 3.0 | 2.5 | 1986 | $1,850 | $0.93 | 43d | 1 | 1.05mi |
| 3514 Creek Manor Dr Kingwood, TX | 4.0 | 2.5 | 2274 | $1,995 | $0.88 | 43d | 1 | 1.08mi |
| 5706 Straight Way Kingwood, TX | 4.0 | 2.5 | 2346 | $2,095 | $0.89 | 15d | 1 | 1.19mi |
| 5714 Straight Way Kingwood, TX | 3.0 | 2.0 | 1788 | $1,830 | $1.02 | 19d | 1 | 1.21mi |
| 3311 Pleasant Hollow Ln Porter, TX | 5.0 | 3.5 | 3196 | $3,320 | $1.04 | 16d | 1 | 1.45mi |
| 2230 Lakeville Dr Kingwood, TX | 4.0 | 3.0 | 2456 | $2,400 | $0.98 | 43d | 1 | 1.48mi |
HOA detail
- Monthly dues
- $31 · $372/yr
Listing history 25 events
-
2026-06-18days on market $279,900 Active 37 DOM
-
2026-06-17days on market $279,900 Active 36 DOM
-
2026-06-16days on market $279,900 Active 35 DOM
-
2026-06-15days on market $279,900 Active 34 DOM
-
2026-06-13days on market $279,900 Active 32 DOM
-
2026-06-13days on market $279,900 Active 31 DOM
-
2026-06-09days on market $279,900 Active 28 DOM
-
2026-06-08days on market $279,900 Active 27 DOM
-
2026-06-07days on market $279,900 Active 26 DOM
-
2026-06-04days on market $279,900 Active 23 DOM
-
2026-06-03days on market $279,900 Active 22 DOM
-
2026-06-02days on market $279,900 Active 21 DOM
-
2026-06-01days on market $279,900 Active 20 DOM
-
2026-05-31days on market $279,900 Active 19 DOM
-
2026-05-12$279,900 Active 185-char remark
-
2024-04-30soldstatus
-
2024-04-29soldstatus Sold 296-char remark
Show marketing remark (296 chars)
BACK ON THE MARKET! New roof, new stove, WDI report and warranty. This beautiful, well-maintained home is located on a cut-de-sac street that connects to the greenbelt. Refrigerator, washer and dryer and playground all convey win the sale. Transferable home warranty being offered by the Seller.
-
2024-04-07status Pending 296-char remark
Show marketing remark (296 chars)
BACK ON THE MARKET! New roof, new stove, WDI report and warranty. This beautiful, well-maintained home is located on a cut-de-sac street that connects to the greenbelt. Refrigerator, washer and dryer and playground all convey win the sale. Transferable home warranty being offered by the Seller.
-
2024-03-29status Option Pending 296-char remark
Show marketing remark (296 chars)
BACK ON THE MARKET! New roof, new stove, WDI report and warranty. This beautiful, well-maintained home is located on a cut-de-sac street that connects to the greenbelt. Refrigerator, washer and dryer and playground all convey win the sale. Transferable home warranty being offered by the Seller.
-
2024-03-06status Active 296-char remark
Show marketing remark (296 chars)
BACK ON THE MARKET! New roof, new stove, WDI report and warranty. This beautiful, well-maintained home is located on a cut-de-sac street that connects to the greenbelt. Refrigerator, washer and dryer and playground all convey win the sale. Transferable home warranty being offered by the Seller.
-
2024-02-21status Option Pending 296-char remark
Show marketing remark (296 chars)
BACK ON THE MARKET! New roof, new stove, WDI report and warranty. This beautiful, well-maintained home is located on a cut-de-sac street that connects to the greenbelt. Refrigerator, washer and dryer and playground all convey win the sale. Transferable home warranty being offered by the Seller.
-
2024-02-20historical 296-char remark
Show marketing remark (296 chars)
BACK ON THE MARKET! New roof, new stove, WDI report and warranty. This beautiful, well-maintained home is located on a cut-de-sac street that connects to the greenbelt. Refrigerator, washer and dryer and playground all convey win the sale. Transferable home warranty being offered by the Seller.
-
2024-02-12$325,000 Active 296-char remark
Show marketing remark (296 chars)
BACK ON THE MARKET! New roof, new stove, WDI report and warranty. This beautiful, well-maintained home is located on a cut-de-sac street that connects to the greenbelt. Refrigerator, washer and dryer and playground all convey win the sale. Transferable home warranty being offered by the Seller.
-
2024-02-08historical $325,000 296-char remark
Show marketing remark (296 chars)
BACK ON THE MARKET! New roof, new stove, WDI report and warranty. This beautiful, well-maintained home is located on a cut-de-sac street that connects to the greenbelt. Refrigerator, washer and dryer and playground all convey win the sale. Transferable home warranty being offered by the Seller.
-
1999-07-02soldstatus
ⓘ Source: listings_history table (triggers on properties + properties_extension) + one-shot
backfill from property_details.listing_events for pre-trigger history.
Tax reassessment forecast TX · Resets to sale price
- Current annual tax
- $6,788 · $566/mo
- Projected year-2 tax
- $6,788 · $566/mo
- Expected delta
- $0/yr ($0/mo · 0.0%)
ⓘ Screening estimate from a state-policy table — verify with the county assessor before closing.
Climate risk First Street
- Flood 1/10 Low FEMA zone X (unshaded) · 0% chance over 30 yrs
- Wildfire 1/10 Low
- Heat 8/10 Severe 7 d/yr ≥111°F today · 23 d/yr by 30 yrs out
- Wind 9/10 Extreme 99% chance of damaging wind over 30 yrs
- Air quality 3/10 Moderate 2 unhealthy d/yr today · 3 by 30 yrs out
Nearby sold comps map
Loading sold comps map…
Walkable amenities ~0.75 mi
Loading nearby amenities…
Taxation est. · year 1
- Rental income
- $26,400
- − Mortgage interest
- −$15,679
- − Property taxes
- −$6,788
- − Insurance
- −$1,400
- − Repairs & maintenance
- −$2,112
- − Management
- −$2,112
- − HOA
- −$372
- − Depreciation
- −$8,143
- Taxable loss
- −$10,204
- Est. tax savings @ 24.0%
- +$2,449
- After-tax cash flow
- $-2,868/yr
For passive investors: Depreciation is non-cash, so a rental often shows a tax loss while cash-flowing — sheltering income. Rental losses are passive: they offset passive income freely, and up to $25,000/yr can offset ordinary (W-2) income if you actively participate and your MAGI is under $100k (phasing out to $0 by $150k); unused losses carry forward. On sale, claimed depreciation is recaptured at up to 25%, and gains may owe capital-gains tax (a 1031 exchange can defer both). Figures are a year-1 estimate at your 24.0% rate — not tax advice; consult a CPA.
Schools (NCES district)
- District
- Humble ISD
- NCES district ID
- 4823910
- Math proficiency
- 38% ▼ -11.00%
- Reading proficiency
- 44% ▼ -7.00%
- Median HH income
- $83,946
- Composite
- 38.55/100
- National rank
- #4171
- State rank
- #262 of 826 in TX
Livability — Houston
- Score
- 74/100
- State rank
- #184
- US rank
- #4771
Category grades
Schools grade is shown separately in the Schools card above.
Census & demographics
- Census place
- Houston, TX
- County
- Harris County · 4,702,590 people
- City population
- 3,226,434
- Metro
- Houston-The Woodlands-Sugar Land, TX
- Population (ZIP)
- 44,538
- Household income
- $84,102
- Rent vs Own
- Severe rent burden
- 2198.0
Population outlook (Harris County) Hauer SSP2
- Today (2025)
- 5,571,493 people
- By 2030
- 6,089,821 · +9.3%
- By 2040
- 7,142,806 · +28.2%
- By 2050
- 8,185,864 · +46.9%
- By 2075
- 10,574,329 · +89.8%
- By 2100
- 12,109,958 · +117.4%
Race, ethnicity, and origin ACS 2023
- Neighborhood character
- Diverse neighborhood (Simpson 0.58)
- Race & ethnicity
- White 59% Hispanic / Latino 24% Two or more races 13% Black 5% Asian 5%
- Hispanic origin (detail)
- Mexican 17%
- Common ancestry
- Lithuanian 3% Slovak 2% Portuguese 2%
- Foreign-born
- 12% · Canada, China, Jamaica
- Languages at home
- 77% English-only · Spanish 17% Other Indo-European 2% Vietnamese 1%
Political lean MEDSL · Harris
- 2024 margin
- Lean D (+5.5) · D 52.0% · R 46.4% · Other 1.6%
- 2008→2024 swing
- +3.9pp toward D · 2008: 1.6pp · 2024: 5.5pp
- All cycles
- 2024: D+5.5 2020: D+13.3 2016: D+12.4 2012: D+0.1 2008: D+1.6
Not yet ingested
- Civics
- —
Market trends
- HPI YoY
- ▲ 0.48%
- Current HPI
- 233.4147
- Rent YoY
- ▼ -0.59%
- Metro
- Houston-The Woodlands-Sugar Land, TX
- State GDP YoY
- ▲ 3.95%
- F500 in state
- 110
Industry mix (Fortune 500 HQ in TX)
| Industry | F500 HQs | Revenue |
|---|---|---|
| Energy | 16 | $1,198B |
|
||
| Technology | 5 | $198B |
|
||
| Engineering / Construction | 4 | $72B |
|
||
| Energy Services | 3 | $60B |
|
||
| Utilities | 3 | $41B |
|
||
| Healthcare | 2 | $330B |
|
||
Price history
-13.9% since first listed11 events — show timeline
- 2026-05-12 Listed $279,900 HARMLS
- 2024-04-30 Sold (Public Records) — Public Records
- 2024-04-29 Sold (MLS) — HARMLS
- 2024-04-07 Pending — HARMLS
- 2024-03-29 Pending — HARMLS
- 2024-03-06 Relisted — HARMLS
- 2024-02-21 Pending — HARMLS
- 2024-02-20 Listing Removed — HARMLS
- 2024-02-12 Listed $325,000 HARMLS
- 2024-02-08 Coming Soon $325,000 HARMLS
- 1999-07-02 Sold (Public Records) — Public Records
Property tax history
+7.2%/yrLatest (2025): $6,788 · +4.1% YoY. Source: county tax records.
Cash-flow waterfall
monthlySold comps — $/sqft
last 12 mo · ≤1 miLoading sold comps…