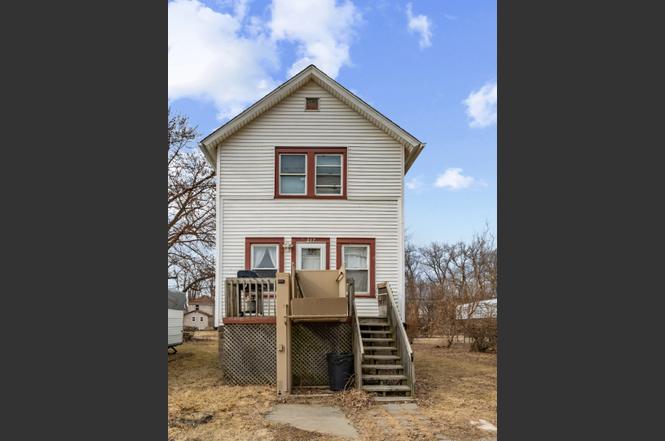
217 12th St · East Moline, IL
Flood risk 6/10 · Moderate
- FEMA flood zone
- X (shaded)
- Chance of flooding over 30 yrs
- 0.73%
- Est. flood insurance / yr
- $507 – $1,088
Fire risk 1/10 · Minimal
- Est. fire insurance / yr
- $804 – $1,492
Heat risk 3/10 · Minor
- Hot days now (above 103°F)
- 7 days/yr
- Hot days in 30 yrs
- 17 days/yr
Wind risk 2/10 · Minimal
- Chance of severe wind over 30 yrs
- —
Air-quality risk 3/10 · Minor
- Unhealthy air days now
- 2 days/yr
- Unhealthy air days in 30 yrs
- 3 days/yr
Risk factors via First Street. Map © Google.
Why this score? — see what drove the B grade
The composite is a weighted blend of 9 inputs, each scored 0–100. Each bar is that input's sub-score; the figure is the points it added to the 100-point composite (weight × sub-score).
- Cash flow +30.0/30.0
- ARV discount +15.0/15.0
- DSCR +10.0/10.0
- 1% rule +9.6/10.0
- Livability +3.1/5.0
- Rent growth +2.5/5.0
- Condition / age +2.5/5.0
- Schools +1.2/10.0
- Appreciation +0.0/10.0
$69,900
🖨 Deal sheet 📄 Offer letter ✓ Due diligence
Listing remarks
Don't miss this 2-bedroom, 1-bath two-story home with great potential! This home features two decks - one in the front and one in the back. Enjoy a nice, level backyard that offers plenty of space for outdoor activities, gardening or pets. The main level offers a living room, full bathroom and eat-in kitchen. For added convenience, the washer and dryer have been relocated from the basement to the main level. Upstairs, you'll find two generously sized bedrooms. Extra storage space in basement. With a little personal touch, this home can truly shine-making it a fantastic opportunity for both homeowners and investors. Some photos are virtually staged.
Key facts
- Extra storage space
- Level backyard
- Two decks
Tags
Property features AI
Finance
- Other: Property assessed/finished area reported by assessor
- HOA & community: No master association fee required
Exterior
- Parking: Gravel driveway (1 parking space total)
- Utilities: Public water; Public sewer
- Home design: Detached single-family home; 2 stories; Fee simple ownership; Over 100 years old; Built before 1978
- Construction: Vinyl siding; Stone foundation
- Exterior features: Deck; Level lot
Interior
- Kitchen: Range; Dishwasher; Refrigerator
- Bedrooms: 2 bedrooms (master and second floor bedroom — second floor); Additional bedrooms listed
- Flooring: Carpet in living room and bedrooms
- Bathrooms: 1 full bathroom
- Heating & cooling: Natural gas heating; Window air conditioning units
- Interior features: 4 total rooms; Unfinished full basement
- Laundry & utility: Laundry room
Neighborhood map
What this means for you Summary
Snapshot
- This is a 2-bed/1.0-bath single-family listed at $70k.
Deal economics
- At list price, monthly cash flow is $382 ($5k/yr) — positive.
- The deal already cash-flows at list — no discount required.
- Meets the 1% rule at list price ($1k rent vs $70k).
- Recommended offer: $64k (9.0% below list) — sets the bar for market timing.
- Cap rate 12.9% vs local median 3.5% in East Moline — top-decile yield for the area; either an underpriced asset or a hidden risk that comps aren't pricing in. Stress-test before assuming the spread holds.
Location & tenants
- Location reads 62/100 on livability (#870 in IL) — a middle-class / working-renter tenant base. Strengths: cost of living A+, housing A+; Watch: crime C-, employment C-, amenities F.
- United Twp Hsd 30 (suburban): math 12% / reading 15% proficiency, ranked #536 of 620 in IL (top 86%) — low school quality limits family demand, transient renter base, plan for 1-2y turnover.
- Zoned schools: United Twp High School (math 12% / reading 15%, grade F, #498 of 693 statewide, top 72%, 1,789 students, 0% FRL).
- Market conditions: 124 active listings in the ZIP; 2 comparable units currently listed for rent nearby; 116 units permitted in Rock Island County in 2024 (50 in 5+ unit buildings).
Forward outlook
- Local home prices are declining (-3.0%/yr); year-one equity from $483 of loan paydown is wiped out by about $2k of value loss. Plan a longer hold.
- Rock Island County population projected at -12% by 2050 — secular population decline; favor cash flow + early exit over multi-decade hold.
- At projected returns (-3.0% appreciation + 3.0% rent growth), your $20k cash investment doubles in ~6 years — after that, you're playing with house money.
Negotiation context
- It's been on market 118 days — a 9% lower offer ($64k) is reasonable based on typical stale-listing flexibility.
- 3 sale attempts since 4y ago; this cycle's ask has dropped $7k (9%) from the opening price — seller is motivated, your offer sets the floor, not the list.
Risks & watch-outs
- Watch-outs: built in 1915 — expect roof / HVAC / electrical / plumbing capex.
- Climate carrying-cost: major flood risk — expect insurance premiums to compound above CPI over the hold.
Questions for the listing agent
- It's been on market 118 days. Have you received any prior offers? Is the seller open to a 9% concession, seller financing, or rate buy-down credit?
- Built in 1915 — when were the roof, HVAC, electrical panel, plumbing, and water heater last replaced?
- Why hasn't it sold? Are there any deal-killer items the seller is aware of (foundation, flood, title, zoning, code violations)?
- Is there a deadline driving the sale (1031 exchange, divorce, estate, relocation)? That informs how much negotiation room exists.
- Schools are F-rated, which usually means shorter tenancies and higher turnover. Who's the typical renter profile here, and what's been the actual vacancy rate?
- What's the average days-on-market for RENTAL listings here right now (not sales)? A rising rental-DOM trend means longer vacancies and softer asking-rent achievability than the comps imply.
- What's the recent tenant-quality profile in this submarket — average credit score on applications, eviction rate, late-payment / NSF rate, and stable-employment percentage? A property-management company in the area should have these aggregated.
- How much new for-sale + rental construction is in the pipeline within 1–3 miles? Heavy new supply typically softens prices + rents 12–24 months out; constrained supply supports both.
Investment metrics
- 1% rule
- 1.46% ✓
- Cap rate
- 12.86%
- Cash-on-cash
- 23.44%
- DSCR
- 2.04
- GRM
- 5.7
CMA / ARV
- ARV (on-the-fly)
- $84,240
- Comps found
- 6
Show comp detail 6 sales within ~0.75 mi
| Address | Dist | Beds/Ba | Sqft | Sold | Price | $/sf | Match |
|---|---|---|---|---|---|---|---|
| 512 Island Ave | 0.36mi | 2/1.0 | 832 (+3%) | 21mo | $54,500 | $66 | 61 |
| 344 22nd St | 0.28mi | 2/1.0 | 703 (-13%) | 14mo | $115,000 | $164 | 53 |
| 2326 3X Ave | 0.36mi | 3/2.0 (+1) | 882 (+9%) | 15mo | $115,500 | $131 | 47 |
| 815 21st St | 0.71mi | 2/1.0 | 720 (-11%) | 5mo | $70,000 | $97 | 44 |
| 1507 10th Ave | 0.68mi | 3/1.0 (+1) | 917 (+13%) | 12mo | $80,500 | $88 | 31 |
| 1026 13th St | 0.72mi | 2/1.0 | 904 (+12%) | 23mo | $93,600 | $104 | 28 |
Match score weights: distance 35% · size 25% · config 20% · recency 20%. Top-matched comps best support the ARV.
Projected returns pro-forma
-3.0% appreciation · 3.0% rent growth · sell at horizon
- IRR
- 16.5%
- Equity multiple
- 1.66×
- Total profit
- $13,000
- Equity at exit
- $10,422
- IRR
- 25.0%
- Equity multiple
- 3.18×
- Total profit
- $42,585
- Equity at exit
- $6,044
Cash invested: $19,572 (down + closing). Projections, not guarantees.
Landlord ↔ Tenant lean methodology
- Overall (STATE)
- 43 Moderately Tenant-Leaning
- State Illinois
- 43 Moderately Tenant-Leaning · D+7
- County
- — inherits STATE
- City
- — inherits STATE
ZIP-level market 61244
- Active inventory
- 124
- Price-to-rent
- 5.7×
Monthly cashflow live
- Estimated rent
- $1,020 medium interval (Pro) →
- Mortgage (P&I)
- −$367
- Tax from tax record
- −$28 /mo · $333/yr
- Insurance
- −$29
- HOA
- −$0
- Vacancy / Maint / Mgmt
- −$214
- Net cashflow
- $382
Break-even live
UW: 25.0% down · 7.5% · 30yr · 1.5% tax · 5.0% vac · 8.0% maint · 8.0% mgmt
Financing live
Cash to close
- Down payment
- $17,475
- Closing costs
- $2,097
- Reserves months
- —
- Total cash needed
- —
Loan-product check · same deal, 3 products live
Conventional
25% down · 7.5% · 30yr
- Down + closing
- —
- Monthly P&I
- —
- Monthly cashflow
- —
- DSCR
- —
- Eligible?
- —
Personal DTI + credit; lowest rate.
DSCR
20% down · 8.5% · 30yr
- Down + closing
- —
- Monthly P&I
- —
- Monthly cashflow
- —
- DSCR
- —
- Eligible?
- —
No personal income docs; deal must DSCR.
Hard money
10% down · 12.0% · 12mo
- Down + closing
- —
- Monthly P&I
- —
- Monthly cashflow
- —
- DSCR
- —
- Eligible?
- —
Short-term bridge; refi at stabilization.
Rent comps 2 comps
| Address | Beds | Baths | Sqft | Rent | $/sqft | DOM | Units | Dist |
|---|---|---|---|---|---|---|---|---|
| 1454 18th St East Moline, IL | 2.0 | 1.5 | 650 | $995 | $1.53 | 21d | 1 | 1.05mi |
| 123 3rd St Unit House Silvis, IL | 2.0 | 1.0 | 1017 | $1,150 | $1.13 | 21d | 1 | 1.27mi |
Listing history 24 events
-
2026-06-18days on market $69,900 Active 118 DOM
-
2026-06-17days on market $69,900 Active 117 DOM
-
2026-06-16days on market $69,900 Active 116 DOM
-
2026-06-15days on market $69,900 Active 115 DOM
-
2026-06-14days on market $69,900 Active 113 DOM
-
2026-06-13days on market $69,900 Active 112 DOM
-
2026-06-10days on market $69,900 Active 110 DOM
-
2026-06-09days on market $69,900 Active 109 DOM
-
2026-06-08days on market $69,900 Active 108 DOM
-
2026-06-07days on market $69,900 Active 107 DOM
-
2026-06-02days on market $69,900 Active 102 DOM
-
2026-06-01days on market $69,900 Active 101 DOM
-
2026-05-31days on market $69,900 Active 100 DOM
-
2026-05-30days on market $69,900 Active 99 DOM
-
2026-04-13price $69,900
-
2026-03-19price $76,500
-
2026-02-20$77,000 Active
-
2022-11-08historical
-
2022-11-08historical
-
2022-05-19Active
-
2022-04-27historical
-
2022-04-27historical
-
2022-04-26Active
-
2021-08-06historical
ⓘ Source: listings_history table (triggers on properties + properties_extension) + one-shot
backfill from property_details.listing_events for pre-trigger history.
Tax reassessment forecast IL · Partial reset (capped growth)
- Current annual tax
- $333 · $28/mo
- Projected year-2 tax
- $960 · $80/mo
- Expected delta
- +$627/yr (+$52/mo · 187.9%)
ⓘ Screening estimate from a state-policy table — verify with the county assessor before closing.
Climate risk First Street
- Flood 6/10 Major FEMA zone X (shaded) · 73% chance over 30 yrs
- Wildfire 1/10 Low
- Heat 3/10 Moderate 7 d/yr ≥103°F today · 17 d/yr by 30 yrs out
- Wind 2/10 Low
- Air quality 3/10 Moderate 2 unhealthy d/yr today · 3 by 30 yrs out
Nearby sold comps map
Loading sold comps map…
Walkable amenities ~0.75 mi
Loading nearby amenities…
Taxation est. · year 1
- Rental income
- $12,239
- − Mortgage interest
- −$3,915
- − Property taxes
- −$333
- − Insurance
- −$350
- − Repairs & maintenance
- −$979
- − Management
- −$979
- − Depreciation
- −$2,033
- Taxable income
- $3,649
- Est. tax owed @ 24.0%
- −$876
- After-tax cash flow
- $3,712/yr
For passive investors: Depreciation is non-cash, so a rental often shows a tax loss while cash-flowing — sheltering income. Rental losses are passive: they offset passive income freely, and up to $25,000/yr can offset ordinary (W-2) income if you actively participate and your MAGI is under $100k (phasing out to $0 by $150k); unused losses carry forward. On sale, claimed depreciation is recaptured at up to 25%, and gains may owe capital-gains tax (a 1031 exchange can defer both). Figures are a year-1 estimate at your 24.0% rate — not tax advice; consult a CPA.
Schools (NCES district)
- District
- United Twp Hsd 30
- NCES district ID
- 1739870
- Math proficiency
- 12% ▼ -5.00%
- Reading proficiency
- 15% ▼ -6.00%
- Median HH income
- $43,647
- Composite
- 11.91/100
- National rank
- #9670
- State rank
- #536 of 620 in IL
Livability — East Moline
- Score
- 62/100
- State rank
- #870
- US rank
- #16964
Category grades
Schools grade is shown separately in the Schools card above.
Census & demographics
- Census place
- East Moline, IL
- County
- Rock Island County · 103,822 people
- City population
- 23,308
- Metro
- Davenport-Moline-Rock Island, IA-IL
- Population (ZIP)
- 23,308
- Household income
- $63,819
- Rent vs Own
- Severe rent burden
- 746.0
Population outlook (Rock Island County) Hauer SSP2
- Today (2025)
- 140,982 people
- By 2030
- 137,705 · -2.3%
- By 2040
- 130,512 · -7.4%
- By 2050
- 123,841 · -12.2%
- By 2075
- 109,851 · -22.1%
- By 2100
- 90,922 · -35.5%
Race, ethnicity, and origin ACS 2023
- Neighborhood character
- Diverse neighborhood (Simpson 0.62)
- Race & ethnicity
- White 55% Hispanic / Latino 19% Black 18% Two or more races 9% Asian 3%
- Hispanic origin (detail)
- Mexican 17%
- Common ancestry
- English 3% Lithuanian 2% Romanian 2%
- Foreign-born
- 13% · Canada, United Kingdom, Philippines
- Languages at home
- 78% English-only · Spanish 12% French/Haitian/Cajun 3% Other Asian/Pacific 2%
Political lean MEDSL · Rock Island
- 2024 margin
- Lean D (+9.6) · D 53.9% · R 44.4% · Other 1.7%
- 2008→2024 swing
- -15.0pp toward R · 2008: 24.6pp · 2024: 9.6pp
- All cycles
- 2024: D+9.6 2020: D+12.1 2016: D+8.4 2012: D+21.9 2008: D+24.6
Not yet ingested
- Civics
- —
Market trends
- HPI YoY
- ▼ -108.05%
- Current HPI
- 154.4012
- Rent YoY
- —
- Metro
- Davenport-Moline-Rock Island, IA-IL
- State GDP YoY
- ▲ 1.59%
- F500 in state
- 60
Industry mix (Fortune 500 HQ in IL)
| Industry | F500 HQs | Revenue |
|---|---|---|
| Insurance | 4 | $201B |
|
||
| Consumer Goods | 4 | $87B |
|
||
| Industrial Machinery | 3 | $64B |
|
||
| Healthcare | 2 | $55B |
|
||
| Retail / Pharmacy | 1 | $148B |
|
||
| Agriculture / Food | 1 | $86B |
|
||
Price history
-9.2% since first listed10 events — show timeline
- 2026-04-13 Price Changed $69,900 MRED as Distributed by MLS Grid
- 2026-03-19 Price Changed $76,500 MRED as Distributed by MLS Grid
- 2026-02-20 Listed $77,000 MRED as Distributed by MLS Grid
- 2022-11-08 Listing Removed — RMLSA as Distributed by MLS Grid
- 2022-11-08 Listing Removed — MRED as Distributed by MLS Grid
- 2022-05-19 Listed — RMLSA as Distributed by MLS Grid
- 2022-04-27 Listing Removed — RMLSA as Distributed by MLS Grid
- 2022-04-27 Listing Removed — MRED as Distributed by MLS Grid
- 2022-04-26 Listed — RMLSA as Distributed by MLS Grid
- 2021-08-06 Listing Removed — RMLSA as Distributed by MLS Grid
Property tax history
+2.0%/yrLatest (2018): $333 · +1.7% YoY. Source: county tax records.
Cash-flow waterfall
monthlySold comps — $/sqft
last 12 mo · ≤1 miLoading sold comps…