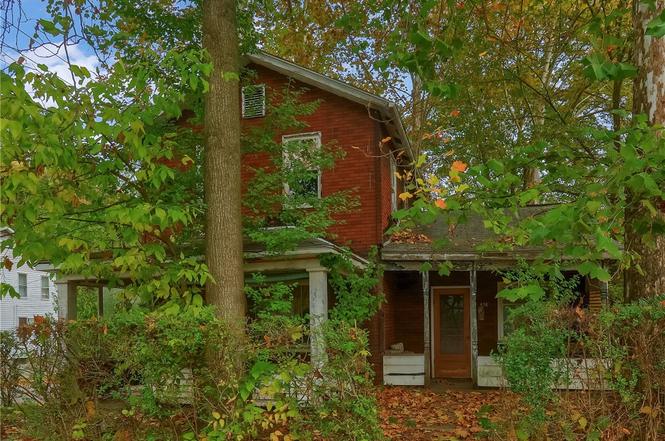
1426 2nd Ave · Beaver Falls, PA
Flood risk 1/10 · Minimal
- FEMA flood zone
- X (unshaded)
- Chance of flooding over 30 yrs
- 0.0%
- Est. flood insurance / yr
- $473 – $860
Fire risk 1/10 · Minimal
- Est. fire insurance / yr
- $511 – $949
Heat risk 4/10 · Minor
- Hot days now (above 97°F)
- 7 days/yr
- Hot days in 30 yrs
- 19 days/yr
Wind risk 2/10 · Minimal
- Chance of severe wind over 30 yrs
- —
Air-quality risk 3/10 · Minor
- Unhealthy air days now
- 2 days/yr
- Unhealthy air days in 30 yrs
- 4 days/yr
Risk factors via First Street. Map © Google.
Why this score? — see what drove the B- grade
The composite is a weighted blend of 9 inputs, each scored 0–100. Each bar is that input's sub-score; the figure is the points it added to the 100-point composite (weight × sub-score).
- Cash flow +30.0/30.0
- 1% rule +10.0/10.0
- DSCR +10.0/10.0
- ARV discount +7.5/15.0
- Livability +4.2/5.0
- Rent growth +3.3/5.0
- Condition / age +2.5/5.0
- Schools +2.2/10.0
- Appreciation +0.0/10.0
$34,900
🖨 Deal sheet 📄 Offer letter ✓ Due diligence
Listing remarks
Opportunity knocks in Beaver Falls! This 3-bedroom, 1-bath home offers strong bones, classic character, and plenty of upside for the savvy investor. Sitting on a nice corner lot with off-street parking and a detached garage, this property is ready for your vision and updates. Inside, you’ll find original wood details, and a layout with tons of potential for a modern redesign. This home is a prime candidate for renovation, flip, or rental. Located just minutes local shops, and Route 18, 1426 2nd Ave offers convenience and accessibility for future tenants or buyers.
Key facts
- Off-street parking
- Corner lot
- Detached garage
Tags
Property features AI
Exterior
- Parking: Detached garage; 4 total parking spaces
- Utilities: Public water; Public sewer
- Home design: 2-story frame home; Asphalt roof; Resale condition
- Construction: Frame construction
- Exterior features: 0.13-acre lot
Interior
- Kitchen: Kitchen on main level (14 x 11)
- Bedrooms: Upper-level bedroom (8 x 8); Upper-level bedroom (11 x 8); Upper-level bedroom (14 x 9)
- Bathrooms: 1 full bathroom
- Heating & cooling: Wood heating
- Interior features: Full basement; 7 total rooms
Neighborhood map
What this means for you Summary
Snapshot
- This is a 3-bed/1.0-bath single-family listed at $35k.
Deal economics
- At list price, monthly cash flow is $759 ($9k/yr) — positive.
- The deal already cash-flows at list — no discount required.
- Meets the 1% rule at list price ($1k rent vs $35k).
- Recommended offer: $31k (12.0% below list) — sets the bar for market timing.
- Cap rate 32.4% vs local median 10.3% in Beaver Falls — top-decile yield for the area; either an underpriced asset or a hidden risk that comps aren't pricing in. Stress-test before assuming the spread holds.
Location & tenants
- Location reads 84/100 on livability (#93 in PA, #675 nationally) — a professional / high-income tenant draw. Strengths: commute A+, cost of living A+, housing A+; Watch: amenities F, employment F.
- Big Beaver Falls Area SD (suburban): math 16% / reading 37% proficiency, ranked #467 of 539 in PA (top 87%) — low school quality limits family demand, transient renter base, plan for 1-2y turnover; 66% free/reduced lunch — lower-income household profile, screen leases tightly.
- Market conditions: Rents rising (+3.1%/yr); 143 active listings in the ZIP; 5 comparable units currently listed for rent nearby; rentals leasing fast (median 13d on market — plan ~1-2 weeks tenant-placement turnaround); 272 units permitted in Beaver County in 2024 (80 in 5+ unit buildings).
Forward outlook
- Local home prices are declining (-3.0%/yr); year-one equity from $241 of loan paydown is wiped out by about $1k of value loss. Plan a longer hold.
- Beaver County population projected at -14% by 2050 — secular population decline; favor cash flow + early exit over multi-decade hold.
- At projected returns (-3.0% appreciation + 3.1% rent growth), your $10k cash investment doubles in ~2 years — after that, you're playing with house money.
Negotiation context
- It's been on market 230 days — a 12% lower offer ($31k) is reasonable based on typical stale-listing flexibility.
- 2 sale attempts with the ask held roughly flat each time — persistent listings suggest the price (not the market) is what's stuck; bring a comps-based counter.
Risks & watch-outs
- Watch-outs: built in 1910 — expect roof / HVAC / electrical / plumbing capex.
Questions for the listing agent
- It's been on market 230 days. Have you received any prior offers? Is the seller open to a 12% concession, seller financing, or rate buy-down credit?
- Built in 1910 — when were the roof, HVAC, electrical panel, plumbing, and water heater last replaced?
- Why hasn't it sold? Are there any deal-killer items the seller is aware of (foundation, flood, title, zoning, code violations)?
- Is there a deadline driving the sale (1031 exchange, divorce, estate, relocation)? That informs how much negotiation room exists.
- Schools are B-rated — typically a magnet for longer-tenancy family renters. What's the average tenant stay here, and is there a school-zone premium baked into asking?
- What's the average days-on-market for RENTAL listings here right now (not sales)? A rising rental-DOM trend means longer vacancies and softer asking-rent achievability than the comps imply.
- What's the recent tenant-quality profile in this submarket — average credit score on applications, eviction rate, late-payment / NSF rate, and stable-employment percentage? A property-management company in the area should have these aggregated.
- How much new for-sale + rental construction is in the pipeline within 1–3 miles? Heavy new supply typically softens prices + rents 12–24 months out; constrained supply supports both.
Investment metrics
- 1% rule
- 3.71% ✓
- Cap rate
- 32.38%
- Cash-on-cash
- 93.15%
- DSCR
- 5.14
- GRM
- 2.2
CMA / ARV
- ARV (on-the-fly)
- $117,040
- Comps found
- 12
Show comp detail 12 sales within ~0.75 mi
| Address | Dist | Beds/Ba | Sqft | Sold | Price | $/sf | Match |
|---|---|---|---|---|---|---|---|
| 1503 3rd Ave | 0.10mi | 3/1.0 | 1,200 (-10%) | 3mo | $48,000 | $40 | 76 |
| 516 17th St | 0.31mi | 3/3.0 | 1,332 (+0%) | 6mo | $35,000 | $26 | 73 |
| 1512 3rd Ave | 0.09mi | 2/1.0 (-1) | 1,238 (-7%) | 9mo | $66,000 | $53 | 72 |
| 420 20th St | 0.39mi | 2/1.5 (-1) | 1,286 (-3%) | 8mo | $113,500 | $88 | 62 |
| 1716 4th Ave | 0.24mi | 2/1.0 (-1) | 1,144 (-14%) | 3mo | $30,000 | $26 | 58 |
| 1815 4th Ave | 0.28mi | 3/2.0 | 1,504 (+13%) | 7mo | $75,000 | $50 | 55 |
| 210 N 16th Ave | 0.69mi | 2/2.0 (-1) | 1,377 (+4%) | 0mo | $200,000 | $145 | 53 |
| 2217 7th Ave Rear | 0.62mi | 3/1.5 | 1,236 (-7%) | 6mo | $137,000 | $111 | 52 |
| 812 2nd Ave | 0.55mi | 3/2.0 | 1,496 (+12%) | 6mo | $22,000 | $15 | 45 |
| 1908 6th Ave | 0.40mi | 2/1.5 (-1) | 1,144 (-14%) | 9mo | $116,000 | $101 | 44 |
| 211 Stuber Rd | 0.73mi | 3/1.5 | 1,502 (+13%) | 3mo | $220,000 | $146 | 40 |
| 1705 N 3rd St | 0.71mi | 3/2.0 | 1,144 (-14%) | 8mo | $224,000 | $196 | 32 |
Match score weights: distance 35% · size 25% · config 20% · recency 20%. Top-matched comps best support the ARV.
Projected returns pro-forma
-3.0% appreciation · 3.07% rent growth · sell at horizon
- IRR
- 94.1%
- Equity multiple
- 5.38×
- Total profit
- $42,782
- Equity at exit
- $5,204
- IRR
- 96.9%
- Equity multiple
- 11.23×
- Total profit
- $99,973
- Equity at exit
- $3,018
Cash invested: $9,772 (down + closing). Projections, not guarantees.
Landlord ↔ Tenant lean methodology
- Overall (STATE)
- 62 Landlord-Friendly
- State Pennsylvania
- 62 Landlord-Friendly · EVEN
- County
- — inherits STATE
- City
- — inherits STATE
ZIP-level market 15010
- Home prices YoY
- -22.6%
- Rents YoY
- 3.1%
- Active inventory
- 143
- Price-to-rent
- 2.2×
Monthly cashflow live
- Estimated rent
- $1,293 high interval (Pro) →
- Mortgage (P&I)
- −$183
- Tax from tax record
- −$66 /mo · $788/yr
- Insurance
- −$15
- HOA
- −$0
- Vacancy / Maint / Mgmt
- −$272
- Net cashflow
- $759
Break-even live
UW: 25.0% down · 7.5% · 30yr · 1.5% tax · 5.0% vac · 8.0% maint · 8.0% mgmt
Financing live
Cash to close
- Down payment
- $8,725
- Closing costs
- $1,047
- Reserves months
- —
- Total cash needed
- —
Loan-product check · same deal, 3 products live
Conventional
25% down · 7.5% · 30yr
- Down + closing
- —
- Monthly P&I
- —
- Monthly cashflow
- —
- DSCR
- —
- Eligible?
- —
Personal DTI + credit; lowest rate.
DSCR
20% down · 8.5% · 30yr
- Down + closing
- —
- Monthly P&I
- —
- Monthly cashflow
- —
- DSCR
- —
- Eligible?
- —
No personal income docs; deal must DSCR.
Hard money
10% down · 12.0% · 12mo
- Down + closing
- —
- Monthly P&I
- —
- Monthly cashflow
- —
- DSCR
- —
- Eligible?
- —
Short-term bridge; refi at stabilization.
Rent comps 5 comps
| Address | Beds | Baths | Sqft | Rent | $/sqft | DOM | Units | Dist |
|---|---|---|---|---|---|---|---|---|
| 1503 3rd Ave Beaver Falls, PA | 3.0 | 1.0 | 1200 | $1,350 | $1.12 | 1d | 1 | 0.11mi |
| 1613 4th Ave Beaver Falls, PA | 2.0 | 1.0 | 1016 | $1,200 | $1.18 | 1d | 1 | 0.20mi |
| 1459 4th St New Brighton, PA | 3.0 | 2.0 | 1312 | $1,625 | $1.24 | 14d | 1 | 0.87mi |
| 418 Darlington Rd Beaver Falls, PA | 2.0 | 1.5 | 975 | $1,350 | $1.38 | 12d | 1 | 1.32mi |
| 904 Penn Ave Unit 1 New Brighton, PA | 2.0 | 1.0 | 1300 | $995 | $0.77 | 17d | 1 | 1.39mi |
Listing history 17 events
-
2026-06-18days on market $34,900 Active 230 DOM
-
2026-06-17days on market $34,900 Active 229 DOM
-
2026-06-16days on market $34,900 Active 228 DOM
-
2026-06-15days on market $34,900 Active 227 DOM
-
2026-06-13days on market $34,900 Active 225 DOM
-
2026-06-13days on market $34,900 Active 224 DOM
-
2026-06-09days on market $34,900 Active 221 DOM
-
2026-06-08days on market $34,900 Active 220 DOM
-
2026-06-07days on market $34,900 Active 219 DOM
-
2026-06-05days on market $34,900 Active 216 DOM
-
2026-06-03days on market $34,900 Active 215 DOM
-
2026-06-02days on market $34,900 Active 214 DOM
-
2026-06-01days on market $34,900 Active 213 DOM
-
2026-05-31days on market $34,900 Active 212 DOM
-
2026-05-19status Active
-
2026-05-01historical Contingent
-
2025-10-31$34,900 Active
ⓘ Source: listings_history table (triggers on properties + properties_extension) + one-shot
backfill from property_details.listing_events for pre-trigger history.
Tax reassessment forecast PA · Partial reset (capped growth)
- Current annual tax
- $788 · $66/mo
- Projected year-2 tax
- $788 · $66/mo
- Expected delta
- $0/yr ($0/mo · 0.0%)
ⓘ Screening estimate from a state-policy table — verify with the county assessor before closing.
Climate risk First Street
- Flood 1/10 Low FEMA zone X (unshaded) · 0% chance over 30 yrs
- Wildfire 1/10 Low
- Heat 4/10 Moderate 7 d/yr ≥97°F today · 19 d/yr by 30 yrs out
- Wind 2/10 Low
- Air quality 3/10 Moderate 2 unhealthy d/yr today · 4 by 30 yrs out
Nearby sold comps map
Loading sold comps map…
Walkable amenities ~0.75 mi
Loading nearby amenities…
Taxation est. · year 1
- Rental income
- $15,520
- − Mortgage interest
- −$1,955
- − Property taxes
- −$788
- − Insurance
- −$174
- − Repairs & maintenance
- −$1,242
- − Management
- −$1,242
- − Depreciation
- −$1,015
- Taxable income
- $9,105
- Est. tax owed @ 24.0%
- −$2,185
- After-tax cash flow
- $6,918/yr
For passive investors: Depreciation is non-cash, so a rental often shows a tax loss while cash-flowing — sheltering income. Rental losses are passive: they offset passive income freely, and up to $25,000/yr can offset ordinary (W-2) income if you actively participate and your MAGI is under $100k (phasing out to $0 by $150k); unused losses carry forward. On sale, claimed depreciation is recaptured at up to 25%, and gains may owe capital-gains tax (a 1031 exchange can defer both). Figures are a year-1 estimate at your 24.0% rate — not tax advice; consult a CPA.
Schools (NCES district)
- District
- Big Beaver Falls Area SD
- NCES district ID
- 4203630
- Math proficiency
- 16% ▼ -11.00%
- Reading proficiency
- 37% ▼ -15.00%
- Median HH income
- $35,686
- Composite
- 21.85/100
- National rank
- #8241
- State rank
- #467 of 539 in PA
Livability — Beaver Falls
- Score
- 84/100
- State rank
- #93
- US rank
- #675
Category grades
Schools grade is shown separately in the Schools card above.
Census & demographics
- Census place
- Beaver Falls, PA
- County
- Beaver County · 116,001 people
- City population
- 28,542
- Metro
- Pittsburgh, PA
- Population (ZIP)
- 28,542
- Household income
- $71,200
- Rent vs Own
- Severe rent burden
- 519.0
Population outlook (Beaver County) Hauer SSP2
- Today (2025)
- 164,976 people
- By 2030
- 161,449 · -2.1%
- By 2040
- 151,752 · -8.0%
- By 2050
- 141,155 · -14.4%
- By 2075
- 118,142 · -28.4%
- By 2100
- 91,740 · -44.4%
Race, ethnicity, and origin ACS 2023
- Neighborhood character
- Predominantly White (85%)
- Race & ethnicity
- White 85% Black 9% Two or more races 4% Hispanic / Latino 1%
- Common ancestry
- Romanian 5% Slovak 2% Iranian 1%
- Foreign-born
- 2% · Canada
- Languages at home
- 98% English-only · Spanish 1%
Political lean MEDSL · Beaver
- 2024 margin
- Strong R (+20.7) · D 39.2% · R 59.9%
- 2008→2024 swing
- -17.9pp toward R · 2008: -2.8pp · 2024: -20.7pp
- All cycles
- 2024: R+20.7 2020: R+17.7 2016: R+20.1 2012: R+6.6 2008: R+2.8
Not yet ingested
- Civics
- —
Market trends
- HPI YoY
- ▼ -76.25%
- Current HPI
- 261.2703
- Rent YoY
- ▲ 3.07%
- Metro
- Pittsburgh, PA
- State GDP YoY
- ▲ 1.68%
- F500 in state
- 34
Industry mix (Fortune 500 HQ in PA)
| Industry | F500 HQs | Revenue |
|---|---|---|
| Healthcare | 2 | $309B |
|
||
| Insurance | 2 | $27B |
|
||
| Telecommunications / Media | 1 | $124B |
|
||
| Industrial Distribution | 1 | $22B |
|
||
| Financial Services | 1 | $20B |
|
||
| Chemicals / Materials | 1 | $18B |
|
||
Price history
3 events — show timeline
- 2026-05-19 Relisted — West Penn MLS
- 2026-05-01 Contingent — West Penn MLS
- 2025-10-31 Listed $34,900 West Penn MLS
Property tax history
-4.0%/yrLatest (2026): $788 · +0.0% YoY. Source: county tax records.
Cash-flow waterfall
monthlySold comps — $/sqft
last 12 mo · ≤1 miLoading sold comps…