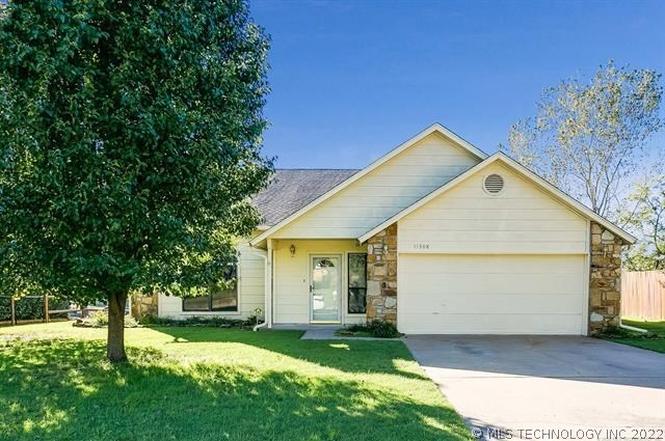
11308 S Ash St · Jenks, OK
Flood risk 1/10 · Minimal
- FEMA flood zone
- X (unshaded)
- Chance of flooding over 30 yrs
- 0.0%
- Est. flood insurance / yr
- $473 – $860
Fire risk 6/10 · Moderate
- Est. fire insurance / yr
- $2,463 – $4,575
Heat risk 6/10 · Moderate
- Hot days now (above 111°F)
- 7 days/yr
- Hot days in 30 yrs
- 18 days/yr
Wind risk 3/10 · Minor
- Chance of severe wind over 30 yrs
- 4.0%
Air-quality risk 2/10 · Minimal
- Unhealthy air days now
- 1 days/yr
- Unhealthy air days in 30 yrs
- 1 days/yr
Risk factors via First Street. Map © Google.
Why this score? — see what drove the D grade
The composite is a weighted blend of 9 inputs, each scored 0–100. Each bar is that input's sub-score; the figure is the points it added to the 100-point composite (weight × sub-score).
- Cash flow +14.0/30.0
- ARV discount +10.1/15.0
- DSCR +4.2/10.0
- Livability +3.6/5.0
- 1% rule +3.5/10.0
- Rent growth +3.3/5.0
- Schools +3.2/10.0
- Condition / age +2.5/5.0
- Appreciation +0.0/10.0
$260,000
🖨 Deal sheet (PDF) 📄 Offer letter ✓ Due diligence
Listing remarks MLS
Charming, Well Maintained 3 bed, 2 bath, 2 car in Jenks School District. Vaulted ceilings, updated colors, living & dining open. Granite kitchen & master bath freshly painted. Coated air ducts, fireplace are both wood burning & gas. Pergola in back & covered porch. Desirable neighborhood.
Key facts
- Gas fireplace
- Pergola
- Storage space
Tags
Property features AI
Exterior
- Home design: House
- Exterior features: Lot approximately 9,191 sq ft
Neighborhood map
What this means for you Summary
Snapshot
- This is a 3-bed/2.0-bath single-family listed at $260k.
Deal economics
- At list price, monthly cash flow is $32 ($390/yr) — positive.
- The deal already cash-flows at list — no discount required.
- To meet the 1% rule (rent ≥ 1% of price), the offer needs to be $220k (15.4% below list).
- Recommended offer: $220k (15.4% below list) — sets the bar for 1% rule.
- Cap rate 6.4% vs local median 3.5% in Jenks — top-decile yield for the area; either an underpriced asset or a hidden risk that comps aren't pricing in. Stress-test before assuming the spread holds.
Location & tenants
- Location reads 71/100 on livability (#33 in OK) — a middle-class / working-renter tenant base. Strengths: employment A+, housing A+, crime A; Watch: amenities F, commute F, health & safety F.
- Jenks (suburban): math 34% / reading 35% proficiency, ranked #27 of 270 in OK (top 10%) — families likely to look elsewhere, expect single-tenant / working-renter base with shorter leases.
- Zoned schools: Jenks West Es (math 46% / reading 35%, grade F, #98 of 845 statewide, top 12%, 1,998 students, 0% FRL); Jenks Ms (math 22% / reading 30%, grade F, #79 of 345 statewide, top 24%, 1,831 students, 0% FRL); Jenks Hs (math 40% / reading 49%, grade F, #15 of 447 statewide, top 4%, 3,547 students, 0% FRL) — zoned schools average 0% FRL vs 28% district-wide (28 pts lower); this property's tenant base skews higher-income than the district average.
- Market conditions: Rents rising (+3.2%/yr); 262 active listings in the ZIP; 4 comparable units currently listed for rent nearby; rentals at typical pace (median 18d on market — plan ~3-4 weeks tenant-placement turnaround); solid renter incomes; 2,818 units permitted in Tulsa County in 2024 (518 in 5+ unit buildings).
Forward outlook
- Local home prices are declining (-3.0%/yr); year-one equity from $2k of loan paydown is wiped out by about $8k of value loss. Plan a longer hold.
- Tulsa County population projected at +30% by 2050 — long-run rental-demand tailwind backs the buy-and-hold thesis.
Negotiation context
- It's been on market 216 days — a 12% lower offer ($229k) is reasonable based on typical stale-listing flexibility.
- 6 sale attempts since 35y ago with the ask held roughly flat each time — persistent listings suggest the price (not the market) is what's stuck; bring a comps-based counter.
- Current owner paid $175k; 49% above their basis — modest negotiation headroom, anchor on the comps not their cost.
Risks & watch-outs
- Climate carrying-cost: major wildfire risk; extreme-heat days projected 7→18/yr by 2055 (HVAC capex compounding) — expect insurance premiums to compound above CPI over the hold.
Questions for the listing agent
- It's been on market 216 days. Have you received any prior offers? Is the seller open to a 15% concession, seller financing, or rate buy-down credit?
- Why hasn't it sold? Are there any deal-killer items the seller is aware of (foundation, flood, title, zoning, code violations)?
- Is there a deadline driving the sale (1031 exchange, divorce, estate, relocation)? That informs how much negotiation room exists.
- The area grade is low — what's the realistic commute time and amenity access for the typical tenant pool here? Any planned neighborhood developments (good or bad) we should know about?
- What's the average days-on-market for RENTAL listings here right now (not sales)? A rising rental-DOM trend means longer vacancies and softer asking-rent achievability than the comps imply.
- What's the recent tenant-quality profile in this submarket — average credit score on applications, eviction rate, late-payment / NSF rate, and stable-employment percentage? A property-management company in the area should have these aggregated.
- How much new for-sale + rental construction is in the pipeline within 1–3 miles? Heavy new supply typically softens prices + rents 12–24 months out; constrained supply supports both.
Investment metrics
- 1% rule
- 0.85% ✗
- Cap rate
- 6.44%
- Cash-on-cash
- 0.54%
- DSCR
- 1.02
- GRM
- 9.9
CMA / ARV
- ARV (on-the-fly)
- $276,120
- Comps found
- 12
Show comp detail 12 sales within ~0.75 mi
| Address | Dist | Beds/Ba | Sqft | Sold | Price | $/sf | Match |
|---|---|---|---|---|---|---|---|
| 211 W 114th Ct S | 0.18mi | 3/2.0 | 1,724 (-3%) | 1mo | $280,000 | $162 | 86 |
| 119 Fox Run Cir | 0.23mi | 3/2.0 | 1,792 (+1%) | 12mo | $210,000 | $117 | 77 |
| 22 Fox Run Cir | 0.14mi | 3/2.0 | 1,722 (-3%) | 18mo | $245,000 | $142 | 74 |
| 11701 S Forest Ct | 0.56mi | 3/2.0 | 1,762 (-0%) | 0mo | $300,000 | $170 | 73 |
| 74 Fox Run Cir | 0.15mi | 3/2.0 | 1,597 (-10%) | 10mo | $238,000 | $149 | 69 |
| 11702 S Gum Ave | 0.65mi | 3/2.0 | 1,731 (-2%) | 1mo | $270,000 | $156 | 65 |
| 197 Fox Run Cir | 0.28mi | 3/2.0 | 1,619 (-8%) | 16mo | $205,000 | $127 | 60 |
| 11709 S Forest Ct | 0.58mi | 3/2.0 | 1,709 (-3%) | 12mo | $263,000 | $154 | 57 |
| 11735 S Holley St S | 0.74mi | 3/2.0 | 1,811 (+2%) | 15mo | $301,000 | $166 | 49 |
| 11722 S Gum Ave | 0.75mi | 3/2.0 | 1,652 (-7%) | 7mo | $249,900 | $151 | 48 |
| 224 E 118th St | 0.63mi | 4/2.0 (+1) | 2,014 (+14%) | 2mo | $365,900 | $182 | 41 |
| 11718 S Gum Ave | 0.73mi | 3/3.0 | 1,602 (-10%) | 13mo | $270,000 | $169 | 35 |
Match score weights: distance 35% · size 25% · config 20% · recency 20%. Top-matched comps best support the ARV.
Projected returns pro-forma
-3.0% appreciation · 3.2% rent growth · sell at horizon
- IRR
- -15.2%
- Equity multiple
- 0.46×
- Total profit
- $-39,643
- Equity at exit
- $38,767
- IRR
- -6.4%
- Equity multiple
- 0.59×
- Total profit
- $-30,126
- Equity at exit
- $22,480
Cash invested: $72,800 (down + closing). Projections, not guarantees.
Landlord ↔ Tenant lean methodology
- Overall (STATE)
- 83 Strongly Landlord-Friendly
- State Oklahoma
- 83 Strongly Landlord-Friendly · R+20
- County
- — inherits STATE
- City
- — inherits STATE
ZIP-level market 74037
- Home prices YoY
- -23.3%
- Rents YoY
- 3.2%
- Active inventory
- 262
- Price-to-rent
- 9.9×
Monthly cashflow live
- Estimated rent
- $2,199 medium interval (Pro) →
- Mortgage (P&I)
- −$1,363
- Tax from tax record
- −$233 /mo · $2,796/yr
- Insurance
- −$108
- HOA
- −$0
- Vacancy / Maint / Mgmt
- −$462
- Net cashflow
- $32
Break-even live
Sensitivity live
| Price | -10% $180 | -5% $106 | +0% $32 | +5% $-41 | +10% $-115 |
|---|---|---|---|---|---|
| Rent | -10% $-141 | -5% $-54 | +0% $32 | +5% $119 | +10% $206 |
| Rate | -1.0pp $163 | -0.5pp $99 | base $32 | +0.5pp $-35 | +1.0pp $-103 |
UW: 25.0% down · 7.5% · 30yr · 1.5% tax · 5.0% vac · 8.0% maint · 8.0% mgmt
Financing live
Cash to close
- Down payment
- $65,000
- Closing costs
- $7,800
- Reserves months
- —
- Total cash needed
- —
Loan-product check · same deal, 3 products live
Conventional
25% down · 7.5% · 30yr
- Down + closing
- —
- Monthly P&I
- —
- Monthly cashflow
- —
- DSCR
- —
- Eligible?
- —
Personal DTI + credit; lowest rate.
DSCR
20% down · 8.5% · 30yr
- Down + closing
- —
- Monthly P&I
- —
- Monthly cashflow
- —
- DSCR
- —
- Eligible?
- —
No personal income docs; deal must DSCR.
Hard money
10% down · 12.0% · 12mo
- Down + closing
- —
- Monthly P&I
- —
- Monthly cashflow
- —
- DSCR
- —
- Eligible?
- —
Short-term bridge; refi at stabilization.
Rent comps 4 comps
| Address | Beds | Baths | Sqft | Rent | $/sqft | DOM | Units | Dist |
|---|---|---|---|---|---|---|---|---|
| 11323 S Ash St Jenks, OK | 4.0 | 2.5 | 2309 | $2,150 | $0.93 | 25d | 1 | 0.06mi |
| 806 W 118th St S Jenks, OK | 3.0 | 3.0 | 1950 | $2,299 | $1.18 | 3d | 1 | 0.75mi |
| 1224 W 112th Dr S Jenks, OK | 3.0 | 3.0 | 1818 | $1,950 | $1.07 | 17d | 1 | 0.82mi |
| 11906 S Juniper Ct Jenks, OK | 3.0 | 2.0 | 1799 | $2,200 | $1.22 | 3d | 1 | 1.03mi |
Listing history 21 events
-
2026-06-03days on market $260,000 Active 216 DOM
-
2026-06-02days on market $260,000 Active 215 DOM
-
2026-06-01days on market $260,000 Active 214 DOM
-
2026-05-31days on market $260,000 Active 213 DOM
-
2025-10-30$260,000 Active
-
2020-05-05soldstatus $175,000
-
2020-04-30soldstatus $175,000 Closed 313-char remark
Show marketing remark (313 chars)
Charming, Well Maintained 3 bed, 2 bath, 2 car in Jenks School District. Vaulted ceilings, updated colors, living & dining open. Granite kitchen & master bath freshly painted. Coated air ducts, fireplace are both wood burning & gas. Pergola in back & covered porch. Desirable neighborhood.
-
2020-03-30status Pending 313-char remark
Show marketing remark (313 chars)
Charming, Well Maintained 3 bed, 2 bath, 2 car in Jenks School District. Vaulted ceilings, updated colors, living & dining open. Granite kitchen & master bath freshly painted. Coated air ducts, fireplace are both wood burning & gas. Pergola in back & covered porch. Desirable neighborhood.
-
2020-01-27$178,000 Active 313-char remark
Show marketing remark (313 chars)
Charming, Well Maintained 3 bed, 2 bath, 2 car in Jenks School District. Vaulted ceilings, updated colors, living & dining open. Granite kitchen & master bath freshly painted. Coated air ducts, fireplace are both wood burning & gas. Pergola in back & covered porch. Desirable neighborhood.
-
2017-11-13soldstatus $148,500 Closed 260-char remark
Show marketing remark (260 chars)
Super-clean two story home with brand-new carpet & interior paint. Large vaulted great room, eat-in kitchen, master suite on main floor; two beds and a full bath upstairs. Fantastic outdoor living under the back pergola. Nice-sized lot with mature trees!
-
2017-11-13soldstatus $148,500
Show marketing remark (260 chars)
Super-clean two story home with brand-new carpet & interior paint. Large vaulted great room, eat-in kitchen, master suite on main floor; two beds and a full bath upstairs. Fantastic outdoor living under the back pergola. Nice-sized lot with mature trees!
-
2017-10-23status Pending 260-char remark
Show marketing remark (260 chars)
Super-clean two story home with brand-new carpet & interior paint. Large vaulted great room, eat-in kitchen, master suite on main floor; two beds and a full bath upstairs. Fantastic outdoor living under the back pergola. Nice-sized lot with mature trees!
-
2017-10-19$150,000 Active 260-char remark
Show marketing remark (260 chars)
Super-clean two story home with brand-new carpet & interior paint. Large vaulted great room, eat-in kitchen, master suite on main floor; two beds and a full bath upstairs. Fantastic outdoor living under the back pergola. Nice-sized lot with mature trees!
-
2000-02-03soldstatus $103,000
-
2000-01-31soldstatus $102,900
-
2000-01-05historical
-
1999-12-11$104,900
-
1999-12-10historical
-
1999-07-15$104,900
-
1991-10-02soldstatus $72,500
-
1991-07-05$75,000
ⓘ Source: listings_history table (triggers on properties + properties_extension) + one-shot
backfill from property_details.listing_events for pre-trigger history.
Tax reassessment forecast OK · Resets to sale price
- Current annual tax
- $2,796 · $233/mo
- Projected year-2 tax
- $2,796 · $233/mo
- Expected delta
- $0/yr ($0/mo · 0.0%)
ⓘ Screening estimate from a state-policy table — verify with the county assessor before closing.
Climate risk First Street
- Flood 1/10 Low FEMA zone X (unshaded) · 0% chance over 30 yrs
- Wildfire 6/10 Major
- Heat 6/10 Major 7 d/yr ≥111°F today · 18 d/yr by 30 yrs out
- Wind 3/10 Moderate 4% chance of damaging wind over 30 yrs
- Air quality 2/10 Low 1 unhealthy d/yr today · 1 by 30 yrs out
Nearby sold comps map
Loading sold comps map…
Walkable amenities ~0.75 mi
Loading nearby amenities…
Taxation est. · year 1
- Rental income
- $26,389
- − Mortgage interest
- −$14,564
- − Property taxes
- −$2,796
- − Insurance
- −$1,300
- − Repairs & maintenance
- −$2,111
- − Management
- −$2,111
- − Depreciation
- −$7,564
- Taxable loss
- −$4,057
- Est. tax savings @ 24.0%
- +$974
- After-tax cash flow
- $1,363/yr
For passive investors: Depreciation is non-cash, so a rental often shows a tax loss while cash-flowing — sheltering income. Rental losses are passive: they offset passive income freely, and up to $25,000/yr can offset ordinary (W-2) income if you actively participate and your MAGI is under $100k (phasing out to $0 by $150k); unused losses carry forward. On sale, claimed depreciation is recaptured at up to 25%, and gains may owe capital-gains tax (a 1031 exchange can defer both). Figures are a year-1 estimate at your 24.0% rate — not tax advice; consult a CPA.
Schools (NCES district)
- District
- Jenks
- NCES district ID
- 4015720
- Math proficiency
- 34% ▼ -9.00%
- Reading proficiency
- 35% ▼ -8.00%
- Median HH income
- $66,291
- Composite
- 31.5/100
- National rank
- #5973
- State rank
- #27 of 270 in OK
Livability — Jenks
- Score
- 71/100
- State rank
- #33
- US rank
- #7270
Category grades
Schools grade is shown separately in the Schools card above.
Census & demographics
- Census place
- Jenks, OK
- County
- Tulsa County · 640,811 people
- City population
- 24,547
- Metro
- Tulsa, OK
- Population (ZIP)
- 24,547
- Household income
- $103,942
- Rent vs Own
- Severe rent burden
- 233.0
Population outlook (Tulsa County) Hauer SSP2
- Today (2025)
- 723,846 people
- By 2030
- 766,033 · +5.8%
- By 2040
- 851,386 · +17.6%
- By 2050
- 938,389 · +29.6%
- By 2075
- 1,166,011 · +61.1%
- By 2100
- 1,350,277 · +86.5%
Race, ethnicity, and origin ACS 2023
- Neighborhood character
- Diverse neighborhood (Simpson 0.58)
- Race & ethnicity
- White 64% Two or more races 14% Asian 11% Hispanic / Latino 8% Native American 6% Black 3%
- Hispanic origin (detail)
- Mexican 4% Puerto Rican 2%
- Common ancestry
- Slovak 3% Italian 3% Lithuanian 2%
- Foreign-born
- 10% · Philippines, Canada, China
- Languages at home
- 86% English-only · Other Asian/Pacific 6% Spanish 4% Russian/Polish/Slavic 1%
Political lean MEDSL · Tulsa
- 2024 margin
- R (+15.2) · D 41.3% · R 56.5% · Other 2.2%
- 2008→2024 swing
- +9.2pp toward D · 2008: -24.5pp · 2024: -15.2pp
- All cycles
- 2024: R+15.2 2020: R+15.6 2016: R+22.9 2012: R+27.4 2008: R+24.5
Not yet ingested
- Civics
- —
Market trends
- HPI YoY
- ▼ -62.99%
- Current HPI
- 207.6174
- Rent YoY
- ▲ 3.20%
- Metro
- Tulsa, OK
- State GDP YoY
- ▲ 1.55%
- F500 in state
- 6
Industry mix (Fortune 500 HQ in OK)
| Industry | F500 HQs | Revenue |
|---|---|---|
| Energy | 3 | $48B |
|
||
Price history
+246.7% since first listed17 events — show timeline
- 2025-10-30 Listed $260,000 ForSaleByOwner.com
- 2020-05-05 Sold (Public Records) $175,000 Public Records
- 2020-04-30 Sold (MLS) $175,000 MLS Technology, Inc.
- 2020-03-30 Pending — MLS Technology, Inc.
- 2020-01-27 Listed $178,000 MLS Technology, Inc.
- 2017-11-13 Sold (Public Records) $148,500 Public Records
- 2017-11-13 Sold (MLS) $148,500 MLS Technology, Inc.
- 2017-10-23 Pending — MLS Technology, Inc.
- 2017-10-19 Listed $150,000 MLS Technology, Inc.
- 2000-02-03 Sold (Public Records) $103,000 Public Records
- 2000-01-31 Sold (MLS) $102,900 MLS Technology, Inc.
- 2000-01-05 Listing Removed — MLS Technology, Inc.
- 1999-12-11 Listed $104,900 MLS Technology, Inc.
- 1999-12-10 Listing Removed — MLS Technology, Inc.
- 1999-07-15 Listed $104,900 MLS Technology, Inc.
- 1991-10-02 Sold (Public Records) $72,500 Public Records
- 1991-07-05 Listed $75,000 MLS Technology, Inc.
Property tax history
+4.6%/yrLatest (2025): $2,796 · +4.1% YoY. Source: county tax records.
Cash-flow waterfall
monthlySold comps — $/sqft
last 12 mo · ≤1 miLoading sold comps…