 Fourplex
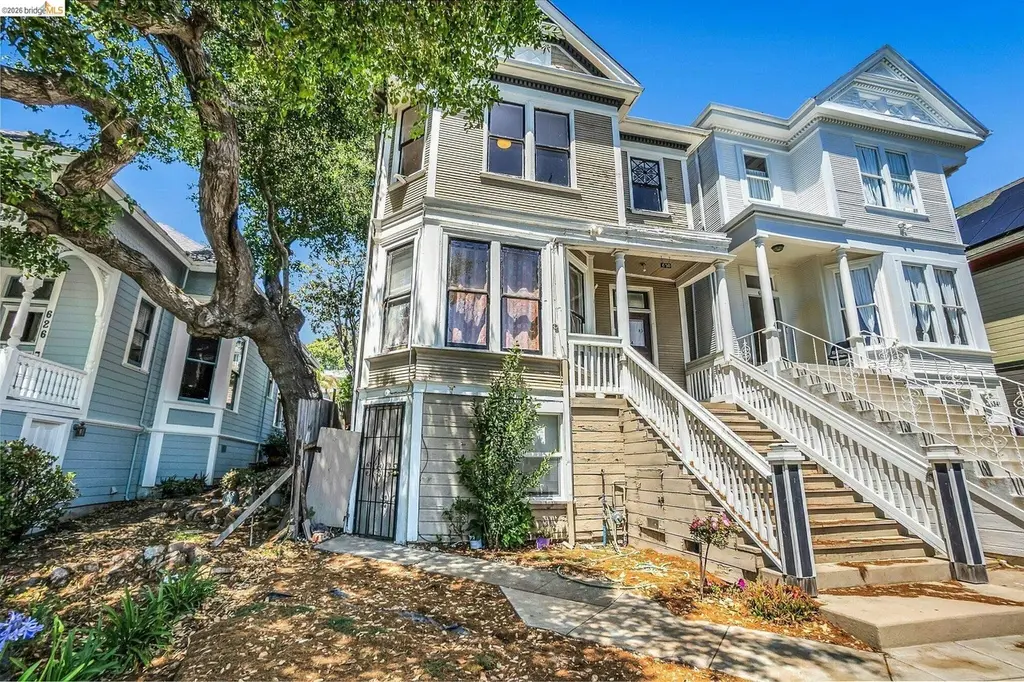
630 York · Vallejo, CA
Flood risk 1/10 · Minimal
- FEMA flood zone
- X (unshaded)
- Chance of flooding over 30 yrs
- 0.0%
- Est. flood insurance / yr
- $507 – $1,088
Fire risk 1/10 · Minimal
- Est. fire insurance / yr
- $659 – $1,223
Heat risk 4/10 · Minor
- Hot days now (above 93°F)
- 7 days/yr
- Hot days in 30 yrs
- 14 days/yr
Wind risk 1/10 · Minimal
- Chance of severe wind over 30 yrs
- —
Air-quality risk 8/10 · Major
- Unhealthy air days now
- 13 days/yr
- Unhealthy air days in 30 yrs
- 13 days/yr
Risk factors via First Street. Map © Google.
Why this score? — see what drove the D grade
The composite is a weighted blend of 9 inputs, each scored 0–100. Each bar is that input's sub-score; the figure is the points it added to the 100-point composite (weight × sub-score).
- Cash flow +15.7/30.0
- ARV discount +7.5/15.0
- DSCR +4.8/10.0
- 1% rule +3.9/10.0
- Livability +3.4/5.0
- Rent growth +2.7/5.0
- Schools +2.6/10.0
- Condition / age +2.5/5.0
- Appreciation +0.0/10.0
$720,000
🖨 Deal sheet (PDF) 📄 Offer letter ✓ Due diligence
Multi-family units
County records classify this as Multi-Family (2-4 Unit). Listing-text estimate: 4 units. confirmed
Listing remarks MLS
Ideal location for commuters. Walking distance to downtown, the Ferry to San Francisco and the beautiful Vallejo waterfront.
Key facts
- 3,250 sq ft lot
- Garage
- Built 1900
Property features AI
Exterior
- Parking: 2 off-street parking spaces; Alley access; Garage faces rear; Unassigned spaces
- Utilities: Public water; Public sewer
- Home design: Residential income property (quadruplex); Built in 1900
- Construction: Lap siding
- Exterior features: Back yard; Rectangular lot
Interior
- Kitchen: Gas water heater
- Flooring: Laminate flooring
- Bathrooms: Four units each with 1 bathroom
- Heating & cooling: Wall furnace heating; Ceiling fans
- Interior features: Formal entry; Unfinished basement
Neighborhood map
What this means for you Summary
Snapshot
- This is a 1×2bd/1ba + 3×1bd/1ba units multifamily listed at $720k.
Deal economics
- At list price, monthly cash flow is $318 ($4k/yr) — positive. Per door: $80/mo.
- The deal already cash-flows at list — no discount required.
- To meet the 1% rule (rent ≥ 1% of price), the offer needs to be $643k (10.6% below list).
- Recommended offer: $643k (10.6% below list) — sets the bar for 1% rule.
- Cap rate 6.8% vs local median 3.1% in Vallejo — top-decile yield for the area; either an underpriced asset or a hidden risk that comps aren't pricing in. Stress-test before assuming the spread holds.
Location & tenants
- Location reads 67/100 on livability (#304 in CA) — a middle-class / working-renter tenant base. Strengths: commute A+, housing A+, health & safety A+; Watch: crime F, cost of living F.
- Vallejo City Unified (urban): math 20% / reading 30% proficiency, ranked #1,124 of 1,400 in CA (top 80%) — low school quality limits family demand, transient renter base, plan for 1-2y turnover; 62% free/reduced lunch — lower-income household profile, screen leases tightly.
- Zoned schools: Cave Language Academy (411 students, 68% FRL); Hogan Middle (867 students, 85% FRL); Vallejo High (math 10% / reading 50%, grade F, #723 of 1,170 statewide, top 64%, 1,335 students, 80% FRL) — zoned schools average 78% FRL vs 62% district-wide (16 pts higher); higher-poverty schools than district average — tighter screening recommended.
- Market conditions: Rents flat; 179 active listings in the ZIP; 1,472 units permitted in Solano County in 2024 (131 in 5+ unit buildings).
- At $6,434/mo this rent would consume 118% of the median local household income ($65k/yr) (locally 2972% of renters already pay >50% of income on rent) — very limited rent-growth headroom before tenants either downsize or default.
Forward outlook
- Local home prices are declining (-3.0%/yr); year-one equity from $5k of loan paydown is wiped out by about $22k of value loss. Plan a longer hold.
- Solano County population projected at +15% by 2050 — modest demand growth; plan on rents tracking national, not racing it.
Negotiation context
- It's been on market 17 days — a 2% lower offer ($709k) is reasonable based on typical stale-listing flexibility.
- 3 sale attempts since 11y ago with the ask held roughly flat each time — persistent listings suggest the price (not the market) is what's stuck; bring a comps-based counter.
- Current owner paid $345k; list at $720k implies a 109% gain — meaningful room to come down on a strong offer.
Risks & watch-outs
- Watch-outs: built in 1900 — expect roof / HVAC / electrical / plumbing capex.
Questions for the listing agent
- Can we see the unit-by-unit rent roll, current vacancy, and any below-market leases? What's the average tenancy length?
- What capital expenditures (roof, boiler, parking lot, exteriors) have been made in the last 5 years, and what's planned in the next 2?
- Built in 1900 — when were the roof, HVAC, electrical panel, plumbing, and water heater last replaced?
- Is there a deadline driving the sale (1031 exchange, divorce, estate, relocation)? That informs how much negotiation room exists.
- Schools are D-rated, which usually means shorter tenancies and higher turnover. Who's the typical renter profile here, and what's been the actual vacancy rate?
- Crime grade is F in this area — have there been break-ins, vandalism, or insurance claims at this property in the last 3 years? What carrier currently insures it and at what premium?
- The area grade is low — what's the realistic commute time and amenity access for the typical tenant pool here? Any planned neighborhood developments (good or bad) we should know about?
- What's the average days-on-market for RENTAL listings here right now (not sales)? A rising rental-DOM trend means longer vacancies and softer asking-rent achievability than the comps imply.
- What's the recent tenant-quality profile in this submarket — average credit score on applications, eviction rate, late-payment / NSF rate, and stable-employment percentage? A property-management company in the area should have these aggregated.
- How much new apartment / multifamily construction is in the pipeline within 1–3 miles? Heavy new supply (>2% of stock underway) typically softens rents 12–24 months out; light construction supports rent growth.
Investment metrics
- 1% rule
- 0.89% ✗
- Cap rate
- 6.82%
- Cash-on-cash
- 1.89%
- DSCR
- 1.08
- GRM
- 9.3
CMA / ARV
No comps found within radius.
Projected returns pro-forma
-3.0% appreciation · 0.71% rent growth · sell at horizon
- IRR
- -15.8%
- Equity multiple
- 0.45×
- Total profit
- $-110,940
- Equity at exit
- $107,354
- IRR
- -11.8%
- Equity multiple
- 0.37×
- Total profit
- $-127,458
- Equity at exit
- $62,252
Cash invested: $201,600 (down + closing). Projections, not guarantees.
Landlord ↔ Tenant lean methodology
- Overall (STATE)
- 18 Strongly Tenant-Friendly
- State California
- 18 Strongly Tenant-Friendly · D+13
- County
- — inherits STATE
- City
- — inherits STATE
ZIP-level market 94590
- Rents YoY
- 0.7%
- Active inventory
- 179
- Price-to-rent
- 34.5×
Monthly cashflow live
- Estimated rent
- $6,434 high interval (Pro) →
- Mortgage (P&I)
- −$3,776
- Tax from tax record
- −$689 /mo · $8,268/yr
- Insurance
- −$300
- HOA
- −$0
- Vacancy / Maint / Mgmt
- −$1,351
- Net cashflow
- $318
Break-even live
Sensitivity live
| Price | -10% $726 | -5% $522 | +0% $318 | +5% $114 | +10% $-90 |
|---|---|---|---|---|---|
| Rent | -10% $-190 | -5% $64 | +0% $318 | +5% $572 | +10% $826 |
| Rate | -1.0pp $681 | -0.5pp $501 | base $318 | +0.5pp $131 | +1.0pp $-58 |
4-unit breakdown (identical units grouped — click to expand)
| Units | Beds | Baths | Est. rent |
|---|---|---|---|
| 1× unit | 2 | 1 | $1,738 |
| 3× units | 1 | 1 | $4,695 |
| #2 | 1 | 1 | $1,565 |
| #3 | 1 | 1 | $1,565 |
| #4 | 1 | 1 | $1,565 |
| Total (4 units) | $6,434 | ||
UW: 25.0% down · 7.5% · 30yr · 1.5% tax · 5.0% vac · 8.0% maint · 8.0% mgmt
Financing live
Cash to close
- Down payment
- $180,000
- Closing costs
- $21,600
- Reserves months
- —
- Total cash needed
- —
Loan-product check · same deal, 3 products live
Conventional
25% down · 7.5% · 30yr
- Down + closing
- —
- Monthly P&I
- —
- Monthly cashflow
- —
- DSCR
- —
- Eligible?
- —
Personal DTI + credit; lowest rate.
DSCR
20% down · 8.5% · 30yr
- Down + closing
- —
- Monthly P&I
- —
- Monthly cashflow
- —
- DSCR
- —
- Eligible?
- —
No personal income docs; deal must DSCR.
Hard money
10% down · 12.0% · 12mo
- Down + closing
- —
- Monthly P&I
- —
- Monthly cashflow
- —
- DSCR
- —
- Eligible?
- —
Short-term bridge; refi at stabilization.
Listing history 12 events
-
2026-06-22days on market $720,000 Active 17 DOM
-
2026-06-18days on market $720,000 Active 14 DOM
-
2026-06-17days on market $720,000 Active 13 DOM
-
2026-06-16days on market $720,000 Active 12 DOM
-
2026-06-15days on market $720,000 Active 11 DOM
-
2026-06-14days on market $720,000 Active 9 DOM
-
2026-06-10days on market $720,000 Active 6 DOM
-
2026-06-09days on market $720,000 Active 5 DOM
-
2026-06-08days on market $720,000 Active 4 DOM
-
2026-06-07days on market $720,000 Active 3 DOM
-
2026-06-05remarks 691-char remark
-
2026-06-05$720,000 Active 1 DOM
ⓘ Source: listings_history table (triggers on properties + properties_extension) + one-shot
backfill from property_details.listing_events for pre-trigger history.
Tax reassessment forecast CA · Resets to sale price
- Current annual tax
- $8,268 · $689/mo
- Projected year-2 tax
- $8,268 · $689/mo
- Expected delta
- $0/yr ($0/mo · 0.0%)
ⓘ Screening estimate from a state-policy table — verify with the county assessor before closing.
Climate risk First Street
- Flood 1/10 Low FEMA zone X (unshaded) · 0% chance over 30 yrs
- Wildfire 1/10 Low
- Heat 4/10 Moderate 7 d/yr ≥93°F today · 14 d/yr by 30 yrs out
- Wind 1/10 Low
- Air quality 8/10 Severe 13 unhealthy d/yr today · 13 by 30 yrs out
Nearby sold comps map
Loading sold comps map…
Walkable amenities ~0.75 mi
Loading nearby amenities…
Taxation est. · year 1
- Rental income
- $77,208
- − Mortgage interest
- −$40,331
- − Property taxes
- −$8,268
- − Insurance
- −$3,600
- − Repairs & maintenance
- −$6,177
- − Management
- −$6,177
- − Depreciation
- −$20,945
- Taxable loss
- −$8,290
- Est. tax savings @ 24.0%
- +$1,990
- After-tax cash flow
- $5,806/yr
For passive investors: Depreciation is non-cash, so a rental often shows a tax loss while cash-flowing — sheltering income. Rental losses are passive: they offset passive income freely, and up to $25,000/yr can offset ordinary (W-2) income if you actively participate and your MAGI is under $100k (phasing out to $0 by $150k); unused losses carry forward. On sale, claimed depreciation is recaptured at up to 25%, and gains may owe capital-gains tax (a 1031 exchange can defer both). Figures are a year-1 estimate at your 24.0% rate — not tax advice; consult a CPA.
Schools (NCES district)
- District
- Vallejo City Unified
- NCES district ID
- 0640740
- Math proficiency
- 20% ▬ 0.00%
- Reading proficiency
- 30% ▬ 0.00%
- Median HH income
- $59,919
- Composite
- 26.02/100
- National rank
- #12743
- State rank
- #1124 of 1400 in CA
Livability — Vallejo
- Score
- 67/100
- State rank
- #304
- US rank
- #10215
Category grades
Schools grade is shown separately in the Schools card above.
Census & demographics
- Census place
- Vallejo, CA
- County
- Solano County · 433,239 people
- City population
- 125,311
- Metro
- Vallejo, CA
- Population (ZIP)
- 37,128
- Household income
- $65,290
- Rent vs Own
- Severe rent burden
- 2972.0
Population outlook (Solano County) Hauer SSP2
- Today (2025)
- 478,685 people
- By 2030
- 497,974 · +4.0%
- By 2040
- 528,515 · +10.4%
- By 2050
- 549,115 · +14.7%
- By 2075
- 587,229 · +22.7%
- By 2100
- 571,378 · +19.4%
Race, ethnicity, and origin ACS 2023
- Neighborhood character
- Highly diverse neighborhood (Simpson 0.77)
- Race & ethnicity
- Hispanic / Latino 32% White 26% Black 21% Two or more races 14% Asian 13% Native American 1%
- Hispanic origin (detail)
- Mexican 23%
- Common ancestry
- Lithuanian 2% Italian 1% Romanian 1%
- Foreign-born
- 25% · Canada, South Korea, China
- Languages at home
- 65% English-only · Spanish 21% Tagalog/Filipino 9% Other Indo-European 1%
Political lean MEDSL · Solano
- 2024 margin
- Strong D (+23.0) · D 60.0% · R 37.1% · Other 2.9%
- 2008→2024 swing
- -5.6pp toward R · 2008: 28.6pp · 2024: 23.0pp
- All cycles
- 2024: D+23.0 2020: D+30.3 2016: D+30.5 2012: D+28.1 2008: D+28.6
Not yet ingested
- Civics
- —
Market trends
- HPI YoY
- ▼ -530.45%
- Current HPI
- 321.0365
- Rent YoY
- ▲ 0.71%
- Metro
- Vallejo, CA
- State GDP YoY
- ▲ 3.21%
- F500 in state
- 116
Industry mix (Fortune 500 HQ in CA)
| Industry | F500 HQs | Revenue |
|---|---|---|
| Technology | 27 | $1,492B |
|
||
| Financial Services | 3 | $174B |
|
||
| Retail | 3 | $44B |
|
||
| Insurance | 3 | $26B |
|
||
| Media / Entertainment | 2 | $115B |
|
||
| Pharmaceuticals / Biotech | 2 | $62B |
|
||
Price history
+69.4% since first listed9 events — show timeline
- 2026-06-04 Listed $720,000 bridgeMLS, Bay East AOR, or Contra Costa AOR
- 2015-12-31 Sold (Public Records) $345,000 Public Records
- 2015-12-31 Sold (MLS) $345,000 bridgeMLS, Bay East AOR, or Contra Costa AOR
- 2015-11-16 Pending — bridgeMLS, Bay East AOR, or Contra Costa AOR
- 2015-09-12 Price Changed $375,000 bridgeMLS, Bay East AOR, or Contra Costa AOR
- 2015-08-06 Price Changed $399,888 bridgeMLS, Bay East AOR, or Contra Costa AOR
- 2015-07-09 Listed $425,000 bridgeMLS, Bay East AOR, or Contra Costa AOR
- 2015-07-08 Listing Removed — bridgeMLS, Bay East AOR, or Contra Costa AOR
- 2015-07-08 Listed — bridgeMLS, Bay East AOR, or Contra Costa AOR
Property tax history
+3.8%/yrLatest (2025): $8,268 · +6.4% YoY. Source: county tax records.
Cash-flow waterfall
monthlySold comps — $/sqft
last 12 mo · ≤1 miLoading sold comps…