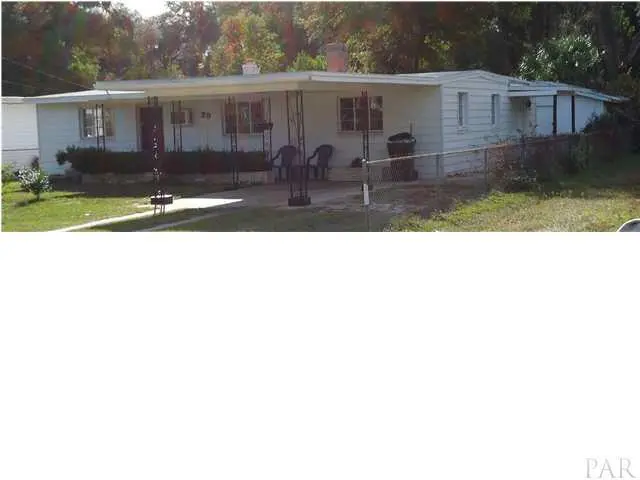
29 Cloverland Ct · West Pensacola, FL
Flood risk 9/10 · Severe
- FEMA flood zone
- X (unshaded)
- Chance of flooding over 30 yrs
- 0.99%
- Est. flood insurance / yr
- $507 – $1,088
Fire risk 1/10 · Minimal
- Est. fire insurance / yr
- $947 – $1,759
Heat risk 10/10 · Severe
- Hot days now (above 105°F)
- 7 days/yr
- Hot days in 30 yrs
- 23 days/yr
Wind risk 9/10 · Severe
- Chance of severe wind over 30 yrs
- 99.0%
Air-quality risk 1/10 · Minimal
- Unhealthy air days now
- 0 days/yr
- Unhealthy air days in 30 yrs
- 0 days/yr
Risk factors via First Street. Map © Google.
Why this score? — see what drove the B- grade
The composite is a weighted blend of 9 inputs, each scored 0–100. Each bar is that input's sub-score; the figure is the points it added to the 100-point composite (weight × sub-score).
- Cash flow +27.8/30.0
- ARV discount +12.4/15.0
- DSCR +9.8/10.0
- 1% rule +6.5/10.0
- Rent growth +3.7/5.0
- Schools +3.6/10.0
- Livability +3.3/5.0
- Condition / age +2.5/5.0
- Appreciation +0.0/10.0
$150,000
🖨 Deal sheet 📄 Offer letter ✓ Due diligence
Listing remarks MLS
Extremely well maintained home that is great for entertaining. Hardwood floors in the family room. Fireplace and indoor brick BBQ is very well layed out. The kitchen is very functional with refrigerator and microwave to convey. This home has a very fresh look with new interior paint and very clean exterior. The back yard has a brick patio that is awesome for family cookouts. It is fenced and pet ready. The landscaping shows pride in ownership. This home will surprise you with it's charm. Move in ready!!!
Key facts
- 6,599 sq ft lot
- 2 parking spots
- Built 1954
Property features AI
Finance
- HOA & community: No homeowners association
Exterior
- Parking: Total 2 parking spaces; Covered parking including 1 covered space and 1 carport; Guest parking and RV access/parking; Front entrance parking
- Utilities: Public water; Public sewer; Copper wiring with circuit breakers; Cable available
- Home design: Single-story block construction; One-level entry; Resale home with renovations; Insulated walls; Has fireplace
- Construction: Block construction; Slab foundation; Composition (shingle) roof; Building area approx. 1,276 square feet
- Exterior features: Private spa; Located on a cul-de-sac; Paved, county-maintained road access
Interior
- Kitchen: Updated kitchen (updates ~1 year) with new oven range hood, ceramic tile backsplash, countertops and shelving installed 2026; Dishwasher; Microwave; Refrigerator
- Bedrooms: Primary bedroom on the first floor (approx. 13' x 13'); Second bedroom on the first floor (approx. 11' x 10'); Third bedroom on the first floor (approx. 13' x 7')
- Flooring: Tile; Laminate
- Bathrooms: One full bathroom (new ceiling exhaust fan installed 2026)
- Heating & cooling: Heating via space heater and fireplace; Ceiling fans for cooling
- Interior features: Ceiling fans; High-speed internet; Some blinds and some drapes
- Laundry & utility: Washer and dryer included; Washer/Dryer hookups; Electric water heater
Neighborhood map
What this means for you Summary
Snapshot
- This is a 4-bed/1.0-bath single-family listed at $150k.
Deal economics
- At list price, monthly cash flow is $392 ($5k/yr) — positive.
- The deal already cash-flows at list — no discount required.
- Meets the 1% rule at list price ($2k rent vs $150k).
- Cap rate 10.0% vs local median 7.7% in West Pensacola — meaningfully above typical; check what's discounted (condition, days-on-market, listing class) to confirm the premium yield is real.
Location & tenants
- Location reads 66/100 on livability (#629 in FL) — a middle-class / working-renter tenant base. Strengths: cost of living A+, housing A+, health & safety B+; Watch: crime D, schools F, amenities F.
- Escambia (suburban): math 40% / reading 45% proficiency, ranked #56 of 73 in FL (top 77%) — families likely to look elsewhere, expect single-tenant / working-renter base with shorter leases.
- Market conditions: Rents rising fast (+4.9%/yr); 198 active listings in the ZIP; 11 comparable units currently listed for rent nearby; rentals at typical pace (median 24d on market — plan ~3-4 weeks tenant-placement turnaround); lower-income renter base — watch delinquency; 1,479 units permitted in Escambia County in 2024 (0 in 5+ unit buildings).
- At $1,729/mo this rent would consume 46% of the median local household income ($45k/yr) (locally 1458% of renters already pay >50% of income on rent) — very limited rent-growth headroom before tenants either downsize or default.
Forward outlook
- Local home prices are declining (-3.0%/yr); year-one equity from $1k of loan paydown is wiped out by about $4k of value loss. Plan a longer hold.
- Escambia County population projected at +13% by 2050 — modest demand growth; plan on rents tracking national, not racing it.
- At projected returns (-3.0% appreciation + 4.9% rent growth), your $42k cash investment doubles in ~9 years — after that, you're playing with house money.
Negotiation context
- Only 1 days on market — expect competitive offers; lowballing is unlikely to land.
- Current owner paid $35k; list at $150k implies a 329% gain — meaningful room to come down on a strong offer.
Risks & watch-outs
- Watch-outs: flood insurance adds $66/mo; built in 1954 — expect roof / HVAC / electrical / plumbing capex.
- Climate carrying-cost: severe flood risk; severe wind risk, 99% chance of damaging wind over 30y; extreme-heat days projected 7→23/yr by 2055 (HVAC capex compounding) — expect insurance premiums to compound above CPI over the hold.
Questions for the listing agent
- Built in 1954 — when were the roof, HVAC, electrical panel, plumbing, and water heater last replaced?
- What's the actual annual flood-insurance premium (NFIP or private), and is the property in a SFHA with mandatory coverage?
- Is there a deadline driving the sale (1031 exchange, divorce, estate, relocation)? That informs how much negotiation room exists.
- Schools are F-rated, which usually means shorter tenancies and higher turnover. Who's the typical renter profile here, and what's been the actual vacancy rate?
- Crime grade is D in this area — have there been break-ins, vandalism, or insurance claims at this property in the last 3 years? What carrier currently insures it and at what premium?
- What's the average days-on-market for RENTAL listings here right now (not sales)? A rising rental-DOM trend means longer vacancies and softer asking-rent achievability than the comps imply.
- What's the recent tenant-quality profile in this submarket — average credit score on applications, eviction rate, late-payment / NSF rate, and stable-employment percentage? A property-management company in the area should have these aggregated.
- How much new for-sale + rental construction is in the pipeline within 1–3 miles? Heavy new supply typically softens prices + rents 12–24 months out; constrained supply supports both.
Investment metrics
- 1% rule
- 1.15% ✓
- Cap rate
- 9.96%
- Cash-on-cash
- 13.10%
- DSCR
- 1.58
- GRM
- 7.2
CMA / ARV
- ARV (on-the-fly)
- $168,432
- Comps found
- 12
Show comp detail 12 sales within ~0.75 mi
| Address | Dist | Beds/Ba | Sqft | Sold | Price | $/sf | Match |
|---|---|---|---|---|---|---|---|
| 117 Aquamarine Ave | 0.20mi | 3/1.0 (-1) | 1,243 (-3%) | 1mo | $82,500 | $66 | 80 |
| 832 S Madison Dr | 0.51mi | 4/1.0 | 1,290 (+1%) | 9mo | $131,000 | $102 | 67 |
| 923 S Madison Dr | 0.35mi | 4/2.0 | 1,368 (+7%) | 2mo | $180,000 | $132 | 66 |
| 6 Georgia Dr | 0.43mi | 4/2.0 | 1,206 (-6%) | 3mo | $157,000 | $130 | 64 |
| 10 Tennessee Dr | 0.46mi | 3/2.0 (-1) | 1,318 (+3%) | 1mo | $260,000 | $197 | 63 |
| 203 Opal Ave | 0.26mi | 3/1.0 (-1) | 1,412 (+11%) | 9mo | $80,000 | $57 | 57 |
| 3403 W Hernandez | 0.65mi | 3/1.0 (-1) | 1,280 (+0%) | 9mo | $147,000 | $115 | 56 |
| 3907 W Blount St | 0.60mi | 3/1.0 (-1) | 1,160 (-9%) | 7mo | $150,000 | $129 | 46 |
| 3400 W Hernandez St | 0.64mi | 3/2.5 (-1) | 1,327 (+4%) | 11mo | $225,000 | $170 | 43 |
| 1719 Larry Ave | 0.73mi | 3/1.5 (-1) | 1,215 (-5%) | 11mo | $190,000 | $156 | 42 |
| 3807 W Moreno St | 0.57mi | 4/2.0 | 1,452 (+14%) | 8mo | $210,000 | $145 | 40 |
| 1026 Northview Dr | 0.66mi | 3/1.5 (-1) | 1,422 (+11%) | 10mo | $203,000 | $143 | 35 |
Match score weights: distance 35% · size 25% · config 20% · recency 20%. Top-matched comps best support the ARV.
Projected returns pro-forma
-3.0% appreciation · 4.92% rent growth · sell at horizon
- IRR
- 2.5%
- Equity multiple
- 1.10×
- Total profit
- $4,050
- Equity at exit
- $22,365
- IRR
- 13.7%
- Equity multiple
- 2.19×
- Total profit
- $50,148
- Equity at exit
- $12,969
Cash invested: $42,000 (down + closing). Projections, not guarantees.
Landlord ↔ Tenant lean methodology
- Overall (STATE)
- 87 Strongly Landlord-Friendly
- State Florida
- 87 Strongly Landlord-Friendly · R+3
- County
- — inherits STATE
- City
- — inherits STATE
ZIP-level market 32505
- Home prices YoY
- -26.5%
- Rents YoY
- 4.9%
- Active inventory
- 198
- Price-to-rent
- 7.2×
Monthly cashflow live
- Estimated rent
- $1,729 high interval (Pro) →
- Mortgage (P&I)
- −$787
- Tax from tax record
- −$58 /mo · $699/yr
- Insurance
- −$62
- Flood insurance flood zone
- −$66 /mo · $798/yr
- HOA
- −$0
- Vacancy / Maint / Mgmt
- −$363
- Net cashflow
- $392
Break-even live
UW: 25.0% down · 7.5% · 30yr · 1.5% tax · 5.0% vac · 8.0% maint · 8.0% mgmt
Financing live
Cash to close
- Down payment
- $37,500
- Closing costs
- $4,500
- Reserves months
- —
- Total cash needed
- —
Loan-product check · same deal, 3 products live
Conventional
25% down · 7.5% · 30yr
- Down + closing
- —
- Monthly P&I
- —
- Monthly cashflow
- —
- DSCR
- —
- Eligible?
- —
Personal DTI + credit; lowest rate.
DSCR
20% down · 8.5% · 30yr
- Down + closing
- —
- Monthly P&I
- —
- Monthly cashflow
- —
- DSCR
- —
- Eligible?
- —
No personal income docs; deal must DSCR.
Hard money
10% down · 12.0% · 12mo
- Down + closing
- —
- Monthly P&I
- —
- Monthly cashflow
- —
- DSCR
- —
- Eligible?
- —
Short-term bridge; refi at stabilization.
Rent comps 11 comps
| Address | Beds | Baths | Sqft | Rent | $/sqft | DOM | Units | Dist |
|---|---|---|---|---|---|---|---|---|
| 3417 W Fisher St Unit C Pensacola, FL | 3.0 | 2.0 | 1106 | $1,350 | $1.22 | 23d | 1 | 0.65mi |
| 3418 Luke St Pensacola, FL | 4.0 | 2.0 | 1620 | $1,800 | $1.11 | 23d | 1 | 0.65mi |
| 221 Edison Dr Pensacola, FL | 3.0 | 1.0 | 1500 | $1,598 | $1.07 | 23d | 1 | 0.88mi |
| 101 Vanderbilt Rd Pensacola, FL | 3.0 | 2.0 | 1104 | $1,850 | $1.68 | 21d | 1 | 0.90mi |
| 852 Garnet St Pensacola, FL | 3.0 | 1.5 | 1150 | $1,150 | $1.00 | 13d | 1 | 0.95mi |
| 4519 Martha Ave Pensacola, FL | 3.0 | 1.0 | 1104 | $1,600 | $1.45 | 23d | 1 | 1.12mi |
| 3296 Two Sisters Way Pensacola, FL | 4.0 | 2.5 | 1856 | $1,795 | $0.97 | 23d | 1 | 1.23mi |
| 2802 W Gonzalez St Pensacola, FL | 3.0 | 2.0 | 1824 | $1,600 | $0.88 | 23d | 1 | 1.24mi |
| 3740 Frontera Cir Pensacola, FL | 3.0 | 1.0 | 1024 | $1,295 | $1.26 | 23d | 1 | 1.29mi |
| 3216 Two Sisters Way Pensacola, FL | 3.0 | 2.0 | 1117 | $1,700 | $1.52 | 23d | 1 | 1.30mi |
| 2108 W Bobe St Pensacola, FL | 4.0 | 2.0 | 1752 | $2,100 | $1.20 | 23d | 1 | 1.41mi |
Listing history 7 events
-
2026-06-01statusdays on market $150,000 Active 1 DOM
-
2026-05-31days on market $150,000 Coming Soon 12 DOM
-
2026-05-31days on market $150,000 Coming Soon 11 DOM
-
2026-05-19historical $150,000
-
2012-07-16soldstatus $35,000
-
2012-07-11soldstatus $35,000 516-char remark
Show marketing remark (516 chars)
Extremely well maintained home that is great for entertaining. Hardwood floors in the family room. Fireplace and indoor brick BBQ is very well layed out. The kitchen is very functional with refrigerator and microwave to convey. This home has a very fresh look with new interior paint and very clean exterior. The back yard has a brick patio that is awesome for family cookouts. It is fenced and pet ready. The landscaping shows pride in ownership. This home will surprise you with it's charm. Move in ready!!!
-
2011-11-03$45,000 516-char remark
Show marketing remark (516 chars)
Extremely well maintained home that is great for entertaining. Hardwood floors in the family room. Fireplace and indoor brick BBQ is very well layed out. The kitchen is very functional with refrigerator and microwave to convey. This home has a very fresh look with new interior paint and very clean exterior. The back yard has a brick patio that is awesome for family cookouts. It is fenced and pet ready. The landscaping shows pride in ownership. This home will surprise you with it's charm. Move in ready!!!
ⓘ Source: listings_history table (triggers on properties + properties_extension) + one-shot
backfill from property_details.listing_events for pre-trigger history.
Tax reassessment forecast FL · Resets to sale price
- Current annual tax
- $699 · $58/mo
- Projected year-2 tax
- $1,245 · $104/mo
- Expected delta
- +$546/yr (+$46/mo · 78.2%)
ⓘ Screening estimate from a state-policy table — verify with the county assessor before closing.
Climate risk First Street
- Flood 9/10 Extreme FEMA zone X (unshaded) · 99% chance over 30 yrs
- Wildfire 1/10 Low
- Heat 10/10 Extreme 7 d/yr ≥105°F today · 23 d/yr by 30 yrs out
- Wind 9/10 Extreme 99% chance of damaging wind over 30 yrs
- Air quality 1/10 Low 0 unhealthy d/yr today · 0 by 30 yrs out
Nearby sold comps map
Loading sold comps map…
Walkable amenities ~0.75 mi
Loading nearby amenities…
Taxation est. · year 1
- Rental income
- $20,746
- − Mortgage interest
- −$8,402
- − Property taxes
- −$699
- − Insurance
- −$1,547
- − Repairs & maintenance
- −$1,660
- − Management
- −$1,660
- − Depreciation
- −$4,364
- Taxable income
- $2,414
- Est. tax owed @ 24.0%
- −$579
- After-tax cash flow
- $4,124/yr
For passive investors: Depreciation is non-cash, so a rental often shows a tax loss while cash-flowing — sheltering income. Rental losses are passive: they offset passive income freely, and up to $25,000/yr can offset ordinary (W-2) income if you actively participate and your MAGI is under $100k (phasing out to $0 by $150k); unused losses carry forward. On sale, claimed depreciation is recaptured at up to 25%, and gains may owe capital-gains tax (a 1031 exchange can defer both). Figures are a year-1 estimate at your 24.0% rate — not tax advice; consult a CPA.
Schools (NCES district)
- District
- Escambia
- NCES district ID
- 1200510
- Math proficiency
- 40% ▼ -9.00%
- Reading proficiency
- 45% ▼ -4.00%
- Median HH income
- $44,649
- Composite
- 36.04/100
- National rank
- #4773
- State rank
- #56 of 73 in FL
Livability — West Pensacola
- Score
- 66/100
- State rank
- #629
- US rank
- #12275
Category grades
Schools grade is shown separately in the Schools card above.
Census & demographics
- Census place
- West Pensacola, FL
- County
- Escambia County · 301,722 people
- Metro
- Pensacola-Ferry Pass-Brent, FL
- Population (ZIP)
- 27,877
- Household income
- $44,783
- Rent vs Own
- Severe rent burden
- 1458.0
Population outlook (Escambia County) Hauer SSP2
- Today (2025)
- 334,637 people
- By 2030
- 345,779 · +3.3%
- By 2040
- 364,828 · +9.0%
- By 2050
- 378,514 · +13.1%
- By 2075
- 403,220 · +20.5%
- By 2100
- 386,125 · +15.4%
Race, ethnicity, and origin ACS 2023
- Neighborhood character
- Diverse neighborhood (Simpson 0.66)
- Race & ethnicity
- Black 48% White 32% Hispanic / Latino 11% Two or more races 9% Asian 2%
- Hispanic origin (detail)
- Mexican 5% Cuban 2%
- Common ancestry
- Slovak 2% Italian 1% Serbian 1%
- Foreign-born
- 9% · Canada, Vietnam
- Languages at home
- 87% English-only · Spanish 9% Other Indo-European 1% Vietnamese 1%
Political lean MEDSL · Escambia
- 2024 margin
- R (+19.5) · D 39.7% · R 59.2% · Other 1.1%
- 2008→2024 swing
- -0.2pp no change · 2008: -19.3pp · 2024: -19.5pp
- All cycles
- 2024: R+19.5 2020: R+15.1 2016: R+20.6 2012: R+20.6 2008: R+19.3
Not yet ingested
- Civics
- —
Market trends
- HPI YoY
- ▼ -74.10%
- Current HPI
- 205.45
- Rent YoY
- ▲ 4.92%
- Metro
- Pensacola-Ferry Pass-Brent, FL
- State GDP YoY
- ▲ 3.28%
- F500 in state
- 36
Industry mix (Fortune 500 HQ in FL)
| Industry | F500 HQs | Revenue |
|---|---|---|
| Industrial Technology | 2 | $29B |
|
||
| Insurance | 2 | $17B |
|
||
| Retail | 1 | $60B |
|
||
| Technology Distribution | 1 | $58B |
|
||
| Homebuilding | 1 | $35B |
|
||
| Technology Manufacturing | 1 | $35B |
|
||
Price history
+233.3% since first listed4 events — show timeline
- 2026-05-19 Coming Soon $150,000 PARMLS
- 2012-07-16 Sold (Public Records) $35,000 Public Records
- 2012-07-11 Sold (MLS) $35,000 PARMLS
- 2011-11-03 Listed $45,000 PARMLS
Property tax history
+2.9%/yrLatest (2025): $699 · +27.3% YoY. Source: county tax records.
Cash-flow waterfall
monthlySold comps — $/sqft
last 12 mo · ≤1 miLoading sold comps…