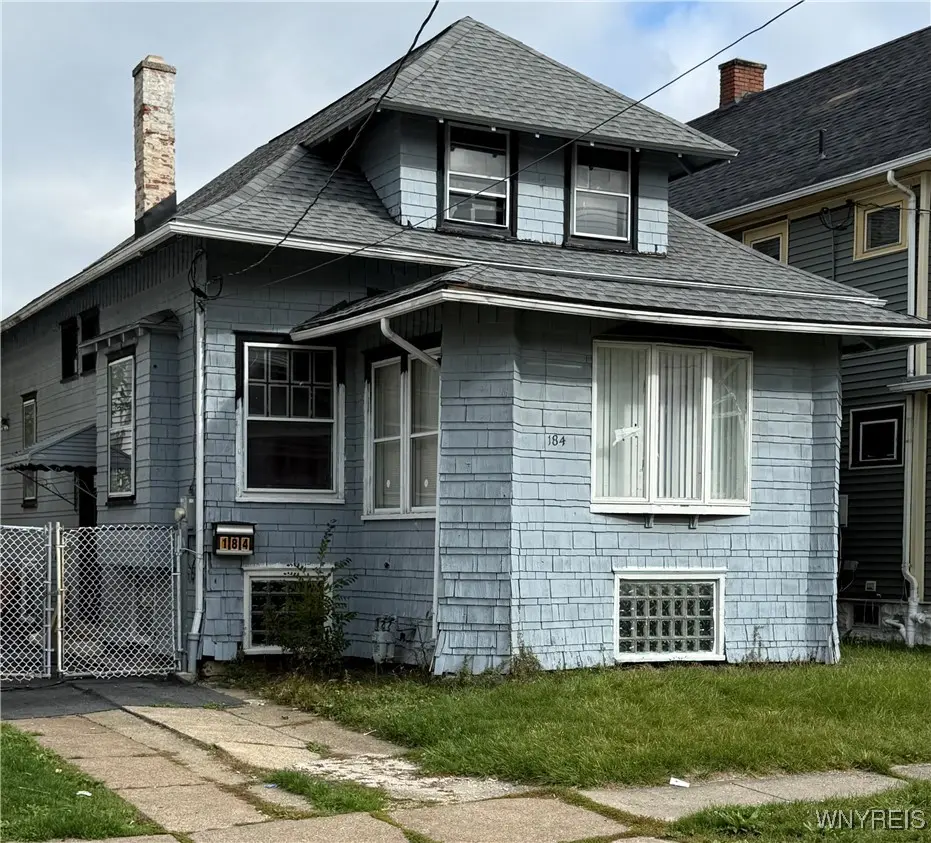
184 Rodney Ave · Buffalo, NY
Flood risk 1/10 · Minimal
- FEMA flood zone
- X (unshaded)
- Chance of flooding over 30 yrs
- 0.0%
- Est. flood insurance / yr
- $473 – $860
Fire risk 1/10 · Minimal
- Est. fire insurance / yr
- $691 – $1,283
Heat risk 2/10 · Minimal
- Hot days now (above 93°F)
- 7 days/yr
- Hot days in 30 yrs
- 14 days/yr
Wind risk 1/10 · Minimal
- Chance of severe wind over 30 yrs
- —
Air-quality risk 3/10 · Minor
- Unhealthy air days now
- 2 days/yr
- Unhealthy air days in 30 yrs
- 3 days/yr
Risk factors via First Street. Map © Google.
Why this score? — see what drove the B grade
The composite is a weighted blend of 9 inputs, each scored 0–100. Each bar is that input's sub-score; the figure is the points it added to the 100-point composite (weight × sub-score).
- Cash flow +27.8/30.0
- ARV discount +15.0/15.0
- DSCR +9.8/10.0
- 1% rule +7.6/10.0
- Rent growth +4.0/5.0
- Livability +3.9/5.0
- Schools +3.3/10.0
- Condition / age +2.5/5.0
- Appreciation +0.0/10.0
$134,999
🖨 Deal sheet (PDF) 📄 Offer letter ✓ Due diligence
Listing remarks MLS
Welcome to 184 Rodney Ave! Located close to Fillmore in Masten District. Near Bus line, Shopping/Food Marts, ECMC and the 33 expressway giving you access to Downtown in minutes. The home is currently Vacant, This would be a great investment property or a very nice place for you to live .
Key facts
- 3,808 sq ft lot
- Built 1920
- Listed 152 days
Neighborhood map
What this means for you Summary
Snapshot
- This is a 3-bed/1.0-bath single-family listed at $135k.
Deal economics
- At list price, monthly cash flow is $412 ($5k/yr) — positive.
- The deal already cash-flows at list — no discount required.
- Meets the 1% rule at list price ($2k rent vs $135k).
- Recommended offer: $119k (12.0% below list) — sets the bar for market timing.
- Cap rate 10.0% vs local median 8.0% in Buffalo — meaningfully above typical; check what's discounted (condition, days-on-market, listing class) to confirm the premium yield is real.
Location & tenants
- Location reads 77/100 on livability (#195 in NY, #3,011 nationally) — a middle-class / working-renter tenant base. Strengths: commute A+, housing A+, health & safety A+; Watch: crime F, employment D-.
- Buffalo City School District (urban): math 41% / reading 40% proficiency, ranked #535 of 590 in NY (top 91%) — families likely to look elsewhere, expect single-tenant / working-renter base with shorter leases; 75% free/reduced lunch — lower-income household profile, screen leases tightly.
- Zoned schools: International School (math 8% / reading 17%, grade F, #2,048 of 2,108 statewide, top 97%, 981 students, 92% FRL); Hutchinson Central Technical High School (math 96% / reading 32%, grade B-, #807 of 1,100 statewide, top 73%, 1,175 students, 78% FRL).
- Market conditions: Rents rising fast (+5.8%/yr); 92 active listings in the ZIP; 31 comparable units currently listed for rent nearby; rentals at typical pace (median 26d on market — plan ~3-4 weeks tenant-placement turnaround); 42% of comp listings sitting > 30 days — soft ceiling on asking rent; 1,244 units permitted in Erie County in 2024 (563 in 5+ unit buildings).
- This rent runs 35% of the median local income ($58k/yr) — at the standard rent-burdened threshold; future hikes will face affordability resistance.
Forward outlook
- Local home prices are declining (-3.0%/yr); year-one equity from $933 of loan paydown is wiped out by about $4k of value loss. Plan a longer hold.
- At projected returns (-3.0% appreciation + 5.8% rent growth), your $38k cash investment doubles in ~8 years — after that, you're playing with house money.
Negotiation context
- It's been on market 152 days — a 12% lower offer ($119k) is reasonable based on typical stale-listing flexibility.
Risks & watch-outs
- Watch-outs: built in 1920 — expect roof / HVAC / electrical / plumbing capex.
Questions for the listing agent
- It's been on market 152 days. Have you received any prior offers? Is the seller open to a 12% concession, seller financing, or rate buy-down credit?
- Built in 1920 — when were the roof, HVAC, electrical panel, plumbing, and water heater last replaced?
- Why hasn't it sold? Are there any deal-killer items the seller is aware of (foundation, flood, title, zoning, code violations)?
- Is there a deadline driving the sale (1031 exchange, divorce, estate, relocation)? That informs how much negotiation room exists.
- Crime grade is F in this area — have there been break-ins, vandalism, or insurance claims at this property in the last 3 years? What carrier currently insures it and at what premium?
- What's the average days-on-market for RENTAL listings here right now (not sales)? A rising rental-DOM trend means longer vacancies and softer asking-rent achievability than the comps imply.
- What's the recent tenant-quality profile in this submarket — average credit score on applications, eviction rate, late-payment / NSF rate, and stable-employment percentage? A property-management company in the area should have these aggregated.
- How much new for-sale + rental construction is in the pipeline within 1–3 miles? Heavy new supply typically softens prices + rents 12–24 months out; constrained supply supports both.
Investment metrics
- 1% rule
- 1.26% ✓
- Cap rate
- 9.96%
- Cash-on-cash
- 13.09%
- DSCR
- 1.58
- GRM
- 6.6
CMA / ARV
- ARV (median comp)
- $168,253
- List price
- $134,999
- Delta
- -19.76%
- Verdict
- UNDERPRICED
- Comps
- 20 within 1.0 mi
Show comp detail 12 sales within ~0.75 mi
| Address | Dist | Beds/Ba | Sqft | Sold | Price | $/sf | Match |
|---|---|---|---|---|---|---|---|
| 18 Wade Ave | 0.17mi | 4/1.0 (+1) | 1,370 (+0%) | 9mo | $180,000 | $131 | 79 |
| 190 Victoria Ave | 0.18mi | 4/1.5 (+1) | 1,305 (-4%) | 0mo | $200,000 | $153 | 77 |
| 28 Victoria Ave | 0.15mi | 4/1.5 (+1) | 1,320 (-3%) | 5mo | $160,000 | $121 | 77 |
| 67 Wade Ave | 0.07mi | 4/2.0 (+1) | 1,375 (+1%) | 13mo | $182,000 | $132 | 76 |
| 86 Wade Ave | 0.07mi | 3/1.0 | 1,276 (-7%) | 18mo | $200,000 | $157 | 71 |
| 374 Dewey Ave | 0.35mi | 3/1.5 | 1,304 (-4%) | 10mo | $238,000 | $183 | 66 |
| 40 Federal Ave | 0.49mi | 4/1.0 (+1) | 1,375 (+1%) | 11mo | $152,000 | $111 | 62 |
| 22 Fairfield Ave | 0.36mi | 3/1.0 | 1,512 (+11%) | 6mo | $220,000 | $146 | 60 |
| 138 Greenfield St | 0.52mi | 3/1.0 | 1,468 (+8%) | 7mo | $385,000 | $262 | 58 |
| 170 E Morris Ave Unit N | 0.43mi | 2/1.0 (-1) | 1,203 (-12%) | 10mo | $208,000 | $173 | 46 |
| 149 Greenfield St | 0.51mi | 3/1.0 | 1,540 (+13%) | 17mo | $350,000 | $227 | 40 |
| 92 Fernhill Ave | 0.74mi | 3/1.0 | 1,494 (+9%) | 13mo | $215,000 | $144 | 39 |
Match score weights: distance 35% · size 25% · config 20% · recency 20%. Top-matched comps best support the ARV.
Projected returns pro-forma
-3.0% appreciation · 5.81% rent growth · sell at horizon
- IRR
- 6.2%
- Equity multiple
- 1.25×
- Total profit
- $9,357
- Equity at exit
- $20,129
- IRR
- 17.9%
- Equity multiple
- 2.68×
- Total profit
- $63,580
- Equity at exit
- $11,672
Cash invested: $37,800 (down + closing). Projections, not guarantees.
Landlord ↔ Tenant lean methodology
- Overall (STATE)
- 15 Strongly Tenant-Friendly
- State New York
- 15 Strongly Tenant-Friendly · D+10
- County
- — inherits STATE
- City
- — inherits STATE
ZIP-level market 14214
- Rents YoY
- 5.8%
- Active inventory
- 92
- Price-to-rent
- 6.6×
Monthly cashflow live
- Estimated rent
- $1,703 high interval (Pro) →
- Mortgage (P&I)
- −$708
- Tax est. 1.5%
- −$169 /mo · $2,025/yr
- Insurance
- −$56
- HOA
- −$0
- Vacancy / Maint / Mgmt
- −$358
- Net cashflow
- $412
Break-even live
Sensitivity live
| Price | -10% $506 | -5% $459 | +0% $412 | +5% $366 | +10% $319 |
|---|---|---|---|---|---|
| Rent | -10% $278 | -5% $345 | +0% $412 | +5% $480 | +10% $547 |
| Rate | -1.0pp $480 | -0.5pp $447 | base $412 | +0.5pp $377 | +1.0pp $342 |
UW: 25.0% down · 7.5% · 30yr · 1.5% tax · 5.0% vac · 8.0% maint · 8.0% mgmt
Financing live
Cash to close
- Down payment
- $33,750
- Closing costs
- $4,050
- Reserves months
- —
- Total cash needed
- —
Loan-product check · same deal, 3 products live
Conventional
25% down · 7.5% · 30yr
- Down + closing
- —
- Monthly P&I
- —
- Monthly cashflow
- —
- DSCR
- —
- Eligible?
- —
Personal DTI + credit; lowest rate.
DSCR
20% down · 8.5% · 30yr
- Down + closing
- —
- Monthly P&I
- —
- Monthly cashflow
- —
- DSCR
- —
- Eligible?
- —
No personal income docs; deal must DSCR.
Hard money
10% down · 12.0% · 12mo
- Down + closing
- —
- Monthly P&I
- —
- Monthly cashflow
- —
- DSCR
- —
- Eligible?
- —
Short-term bridge; refi at stabilization.
Rent comps 31 comps
| Address | Beds | Baths | Sqft | Rent | $/sqft | DOM | Units | Dist |
|---|---|---|---|---|---|---|---|---|
| 76 Vernon Pl Unit Lower Buffalo, NY | 3.0 | 1.0 | 1190 | $1,445 | $1.21 | 16d | 1 | 0.42mi |
| 76 Vernon Pl Unit Upper Buffalo, NY | 3.0 | 1.0 | 1190 | $1,595 | $1.34 | 16d | 1 | 0.42mi |
| 140 Parkridge Ave Buffalo, NY | 3.0 | 1.0 | 990 | $1,500 | $1.52 | 45d | 1 | 0.69mi |
| 89 Lasalle Ave Buffalo, NY | 1.0–4.0 | 1.0–4.0 | 1024 | $2,291 | $2.24 | 3d | 10 | 0.75mi |
| 90 Sussex St Unit 2 Buffalo, NY | 2.0 | 1.0 | 1000 | $1,000 | $1.00 | 45d | 1 | 0.76mi |
| 92 Lasalle Ave Unit 1 Buffalo, NY | 2.0 | 1.0 | 1000 | $1,150 | $1.15 | 45d | 1 | 0.84mi |
| 40 Lisbon Ave Unit Upper Buffalo, NY | 2.0 | 1.0 | 1057 | $1,500 | $1.42 | 13d | 1 | 0.96mi |
| 26 Custer St Buffalo, NY | 2.0 | 1.0 | 1000 | $1,300 | $1.30 | 45d | 1 | 1.02mi |
| 263 Minnesota Ave Unit Upper Buffalo, NY | 3.0 | 1.0 | 1242 | $1,500 | $1.21 | 16d | 1 | 1.04mi |
| 121 Humboldt Pkwy Unit B Buffalo, NY | 2.0 | 1.0 | 1265 | $1,750 | $1.38 | 45d | 1 | 1.05mi |
| 117 Humboldt Pkwy Unit A Buffalo, NY | 3.0 | 1.0 | 1105 | $2,300 | $2.08 | 45d | 1 | 1.05mi |
| 107 Humboldt Pkwy Unit A Buffalo, NY | 2.0 | 1.0 | 1172 | $1,995 | $1.70 | 45d | 1 | 1.06mi |
| 2 Agassiz Cir Unit A Buffalo, NY | 2.0 | 1.0 | 1076 | $2,150 | $2.00 | 25d | 1 | 1.09mi |
| 2 Agassiz Cir Unit B Buffalo, NY | 2.0 | 1.0 | 983 | $2,050 | $2.09 | 25d | 1 | 1.09mi |
| 222 Lisbon Ave Buffalo, NY | 4.0 | 1.0 | 1300 | $1,400 | $1.08 | 25d | 1 | 1.10mi |
| 222 Lisbon Ave Unit Upper Buffalo, NY | 3.0 | 1.0 | 1400 | $1,400 | $1.00 | 45d | 1 | 1.10mi |
| 220 Dartmouth Ave Buffalo, NY | 2.0 | 1.0 | 1000 | $1,100 | $1.10 | 25d | 1 | 1.10mi |
| 163 Carmel Rd Buffalo, NY | 3.0 | 1.0 | 1400 | $1,800 | $1.29 | 4d | 1 | 1.12mi |
| 265 Lisbon Ave Unit 2 Buffalo, NY | 3.0 | 1.0 | 1200 | $1,400 | $1.17 | 45d | 1 | 1.13mi |
| 74 Dorris Ave Buffalo, NY | 3.0 | 1.0 | 1200 | $1,450 | $1.21 | 45d | 1 | 1.19mi |
| 97 Davidson Ave Buffalo, NY | 3.0 | 1.0 | 925 | $1,495 | $1.62 | 3d | 1 | 1.28mi |
| 17 Proctor Ave Unit 1 Buffalo, NY | 2.0 | 1.0 | 900 | $1,100 | $1.22 | 45d | 1 | 1.29mi |
| 60 Englewood Ave Buffalo, NY | 4.0 | 1.0 | 1400 | $1,650 | $1.18 | 3d | 1 | 1.31mi |
| 179 Donaldson Rd Buffalo, NY | 3.0 | 1.0 | 1152 | $1,350 | $1.17 | 5d | 1 | 1.31mi |
| 27 Henley Rd Buffalo, NY | 2.0 | 1.0 | 1200 | $1,299 | $1.08 | 16d | 1 | 1.33mi |
| 71 Gerald Ave Buffalo, NY | 2.0 | 1.0 | 1773 | $1,100 | $0.62 | 45d | 1 | 1.44mi |
| 184 Butler Ave Unit 1545840P Buffalo, NY | 4.0 | 1.0 | 1496 | $3,226 | $2.16 | 16d | 1 | 1.45mi |
| 189 Westminster Ave Buffalo, NY | 4.0 | 1.5 | 1065 | $1,595 | $1.50 | 12d | 1 | 1.46mi |
| 414 Taunton Pl Unit Lowet Buffalo, NY | 3.0 | 1.0 | 1232 | $1,700 | $1.38 | 16d | 1 | 1.47mi |
| 102 Florida St Buffalo, NY | 3.0 | 1.0 | 1296 | $1,650 | $1.27 | 45d | 1 | 1.48mi |
| 307 Sterling Ave Buffalo, NY | 3.0 | 1.0 | 1632 | $1,800 | $1.10 | 5d | 1 | 1.49mi |
Listing history 16 events
-
2026-06-21days on market $134,999 Active 152 DOM
-
2026-06-18days on market $134,999 Active 149 DOM
-
2026-06-17days on market $134,999 Active 148 DOM
-
2026-06-16days on market $134,999 Active 147 DOM
-
2026-06-15days on market $134,999 Active 146 DOM
-
2026-06-13days on market $134,999 Active 144 DOM
-
2026-06-13days on market $134,999 Active 143 DOM
-
2026-06-10days on market $134,999 Active 141 DOM
-
2026-06-09days on market $134,999 Active 140 DOM
-
2026-06-08days on market $134,999 Active 139 DOM
-
2026-06-07days on market $134,999 Active 138 DOM
-
2026-06-03days on market $134,999 Active 134 DOM
-
2026-06-02days on market $134,999 Active 133 DOM
-
2026-06-01days on market $134,999 Active 132 DOM
-
2026-05-31days on market $134,999 Active 131 DOM
-
2026-01-20$134,999 Active 289-char remark
Show marketing remark (289 chars)
Welcome to 184 Rodney Ave! Located close to Fillmore in Masten District. Near Bus line, Shopping/Food Marts, ECMC and the 33 expressway giving you access to Downtown in minutes. The home is currently Vacant, This would be a great investment property or a very nice place for you to live .
ⓘ Source: listings_history table (triggers on properties + properties_extension) + one-shot
backfill from property_details.listing_events for pre-trigger history.
Climate risk First Street
- Flood 1/10 Low FEMA zone X (unshaded) · 0% chance over 30 yrs
- Wildfire 1/10 Low
- Heat 2/10 Low 7 d/yr ≥93°F today · 14 d/yr by 30 yrs out
- Wind 1/10 Low
- Air quality 3/10 Moderate 2 unhealthy d/yr today · 3 by 30 yrs out
Nearby sold comps map
Loading sold comps map…
Walkable amenities ~0.75 mi
Loading nearby amenities…
Taxation est. · year 1
- Rental income
- $20,434
- − Mortgage interest
- −$7,562
- − Property taxes
- −$2,025
- − Insurance
- −$675
- − Repairs & maintenance
- −$1,635
- − Management
- −$1,635
- − Depreciation
- −$3,927
- Taxable income
- $2,975
- Est. tax owed @ 24.0%
- −$714
- After-tax cash flow
- $4,233/yr
For passive investors: Depreciation is non-cash, so a rental often shows a tax loss while cash-flowing — sheltering income. Rental losses are passive: they offset passive income freely, and up to $25,000/yr can offset ordinary (W-2) income if you actively participate and your MAGI is under $100k (phasing out to $0 by $150k); unused losses carry forward. On sale, claimed depreciation is recaptured at up to 25%, and gains may owe capital-gains tax (a 1031 exchange can defer both). Figures are a year-1 estimate at your 24.0% rate — not tax advice; consult a CPA.
Schools (NCES district)
- District
- Buffalo City School District
- NCES district ID
- 3605850
- Math proficiency
- 41% ▲ 11.00%
- Reading proficiency
- 40% ▲ 7.00%
- Median HH income
- $31,665
- Composite
- 33.17/100
- National rank
- #5544
- State rank
- #535 of 590 in NY
Livability — Buffalo
- Score
- 77/100
- State rank
- #195
- US rank
- #3011
Category grades
Schools grade is shown separately in the Schools card above.
Census & demographics
- Census place
- Buffalo, NY
- County
- Erie County · 714,559 people
- City population
- 440,021
- Metro
- Buffalo-Cheektowaga, NY
- Population (ZIP)
- 21,314
- Household income
- $58,228
- Rent vs Own
- Severe rent burden
- 1820.0
Population outlook (Erie County) Hauer SSP2
- Today (2025)
- 933,037 people
- By 2030
- 935,181 · +0.2%
- By 2040
- 928,531 · -0.5%
- By 2050
- 905,725 · -2.9%
- By 2075
- 834,037 · -10.6%
- By 2100
- 708,033 · -24.1%
Race, ethnicity, and origin ACS 2023
- Neighborhood character
- Diverse neighborhood (Simpson 0.67)
- Race & ethnicity
- White 47% Black 31% Asian 11% Hispanic / Latino 7% Two or more races 6%
- Hispanic origin (detail)
- Puerto Rican 3%
- Common ancestry
- Romanian 5% Lithuanian 2% Scotch-Irish 1%
- Foreign-born
- 14% · Canada, China
- Languages at home
- 81% English-only · Other Indo-European 7% Spanish 4% Other Asian/Pacific 1%
Political lean MEDSL · Erie
- 2024 margin
- Lean D (+9.7) · D 54.8% · R 45.2%
- 2008→2024 swing
- -7.9pp toward R · 2008: 17.5pp · 2024: 9.7pp
- All cycles
- 2024: D+9.7 2020: D+14.7 2016: D+4.8 2012: D+15.6 2008: D+17.5
Not yet ingested
- Civics
- —
Market trends
- HPI YoY
- ▼ -282.52%
- Current HPI
- 373.377
- Rent YoY
- ▲ 5.81%
- Metro
- Buffalo-Cheektowaga, NY
- State GDP YoY
- ▲ 2.60%
- F500 in state
- 92
Industry mix (Fortune 500 HQ in NY)
| Industry | F500 HQs | Revenue |
|---|---|---|
| Financial Services | 10 | $950B |
|
||
| Consumer Goods | 9 | $162B |
|
||
| Insurance | 4 | $225B |
|
||
| Telecommunications | 2 | $144B |
|
||
| Pharmaceuticals | 2 | $112B |
|
||
| Media / Entertainment | 2 | $69B |
|
||
Price history
1 event — show timeline
- 2026-01-20 Listed $134,999 WNYREIS
Property tax history
+6.6%/yrLatest (2025): $207 · +0.0% YoY. Source: county tax records.
Cash-flow waterfall
monthlySold comps — $/sqft
last 12 mo · ≤1 miLoading sold comps…