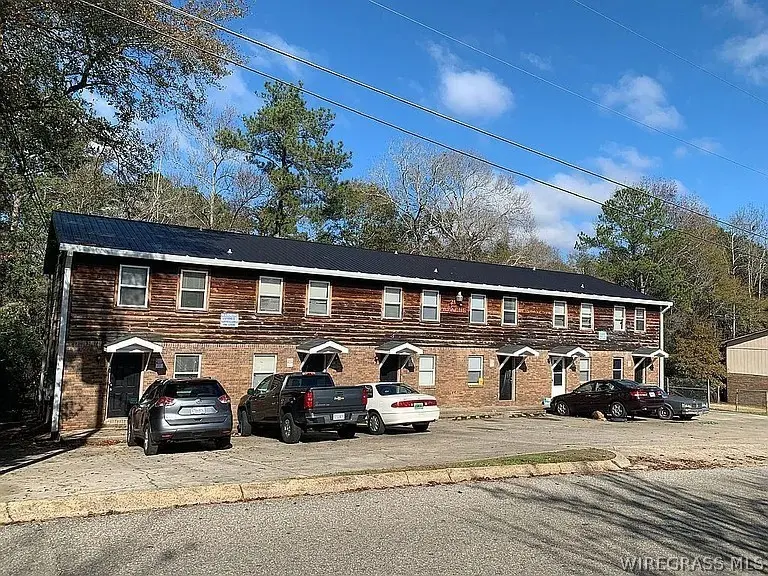
 Fourplex
210 Apache Dr · Enterprise, AL
Flood risk 1/10 · Minimal
- FEMA flood zone
- X (unshaded)
- Chance of flooding over 30 yrs
- 0.0%
- Est. flood insurance / yr
- $507 – $1,088
Fire risk 3/10 · Minor
- Est. fire insurance / yr
- $916 – $1,700
Heat risk 8/10 · Major
- Hot days now (above 106°F)
- 7 days/yr
- Hot days in 30 yrs
- 19 days/yr
Wind risk 8/10 · Major
- Chance of severe wind over 30 yrs
- 99.0%
Air-quality risk 2/10 · Minimal
- Unhealthy air days now
- 0 days/yr
- Unhealthy air days in 30 yrs
- 1 days/yr
Risk factors via First Street. Map © Google.
Why this score? — see what drove the C- grade
The composite is a weighted blend of 9 inputs, each scored 0–100. Each bar is that input's sub-score; the figure is the points it added to the 100-point composite (weight × sub-score).
- Cash flow +20.1/30.0
- ARV discount +7.5/15.0
- DSCR +6.4/10.0
- 1% rule +5.3/10.0
- Schools +4.3/10.0
- Rent growth +3.5/5.0
- Livability +3.2/5.0
- Condition / age +2.5/5.0
- Appreciation +0.0/10.0
$520,500
🖨 Deal sheet (PDF) 📄 Offer letter ✓ Due diligence
Multi-family units
County records classify this as Multi-Family (5+ Unit). Listing-text estimate: 4 units. estimate disagrees with records
5+ unit building — per-unit beds/baths from public records are typically unavailable; the breakdown below (if shown) is an estimate from the listing text.
Listing remarks
CHAIN LINK & WOOD 1,2,3,4 HAVE BEEN RENOVATED RECENTLY , PAINT, LIGHT FIXTURES AND FANS. UNIT 5 IS IN GOOD SHAPE BUT NOT RENOVATED; LONG TIME TENANT IN IT. UNIT 6 JUST RECENTLY RENOVATED. UNIT 1 HAS ALL TILE DOWN STAIRS AND CARPET AND TILE UPSTAIRS, 2-5 HAS CARPET AND LINOLEUM, & 6 HAS FLOATING WOOD FLOOR AND TILE DOWN STAIRS, CARPET AND TILE UPSTAIRS. STORAGE IN BACK OF UNIT, #5 HAS RECENTLY INSTALLED INSIDE/OUTSIDE AC, RECENTLY INSTALLED OUTSIDE AC UNIT ON #1-5. ALL OCCUPIED,
Key facts
- Built 1980
- Listed 54 days
Property features AI
Exterior
- Parking: No parking listed
- Utilities: Public water; Public sewer; Cable available
- Home design: Residential income property; Two levels
- Construction: Brick construction; Slab foundation
- Exterior features: City lot
Interior
- Kitchen: Dishwasher; Electric range; Disposal; Plumbed for ice maker; Refrigerator
- Bedrooms: Multiple 2-bedroom units (each unit listed as 2 bedrooms)
- Flooring: Brick flooring
- Bathrooms: Multiple 1-bathroom units (each unit listed as 1 bathroom)
- Heating & cooling: Central heating; Hot water heating; Electric heating; Ceiling fan(s)
- Interior features: Eat-in kitchen
- Laundry & utility: Electric water heater
Neighborhood map
What this means for you Summary
Snapshot
- This is a 4 × 3-bed/?-bath units multifamily listed at $520k.
Deal economics
- At list price, monthly cash flow is $646 ($8k/yr) — positive. Per door: $162/mo.
- The deal already cash-flows at list — no discount required.
- Meets the 1% rule at list price ($5k rent vs $520k).
- Recommended offer: $505k (3.0% below list) — sets the bar for market timing.
- Cap rate 7.8% vs local median 4.1% in Enterprise — top-decile yield for the area; either an underpriced asset or a hidden risk that comps aren't pricing in. Stress-test before assuming the spread holds.
Location & tenants
- Location reads 65/100 on livability (#127 in AL) — a middle-class / working-renter tenant base. Strengths: cost of living A+, housing A+; Watch: health & safety D, crime F, amenities F.
- Enterprise City (town): math 40% / reading 60% proficiency, ranked #12 of 129 in AL (top 9%) — acceptable for families but not a draw, mixed tenant base, ~2y average lease.
- Market conditions: Rents rising (+3.9%/yr); 444 active listings in the ZIP; solid renter incomes; 137 units permitted in Coffee County in 2024 (0 in 5+ unit buildings).
- At $5,371/mo this rent would consume 85% of the median local household income ($76k/yr) (locally 1126% of renters already pay >50% of income on rent) — very limited rent-growth headroom before tenants either downsize or default.
Forward outlook
- Local home prices are declining (-3.0%/yr); year-one equity from $4k of loan paydown is wiped out by about $16k of value loss. Plan a longer hold.
Negotiation context
- It's been on market 55 days — a 3% lower offer ($505k) is reasonable based on typical stale-listing flexibility.
- 4 sale attempts since 14y ago with the ask held roughly flat each time — persistent listings suggest the price (not the market) is what's stuck; bring a comps-based counter.
Risks & watch-outs
- Climate carrying-cost: severe wind risk, 99% chance of damaging wind over 30y; extreme-heat days projected 7→19/yr by 2055 (HVAC capex compounding) — expect insurance premiums to compound above CPI over the hold.
Questions for the listing agent
- It's been on market 55 days. Have you received any prior offers? Is the seller open to a 3% concession, seller financing, or rate buy-down credit?
- Can we see the unit-by-unit rent roll, current vacancy, and any below-market leases? What's the average tenancy length?
- What capital expenditures (roof, boiler, parking lot, exteriors) have been made in the last 5 years, and what's planned in the next 2?
- Is there a deadline driving the sale (1031 exchange, divorce, estate, relocation)? That informs how much negotiation room exists.
- Crime grade is F in this area — have there been break-ins, vandalism, or insurance claims at this property in the last 3 years? What carrier currently insures it and at what premium?
- What's the average days-on-market for RENTAL listings here right now (not sales)? A rising rental-DOM trend means longer vacancies and softer asking-rent achievability than the comps imply.
- What's the recent tenant-quality profile in this submarket — average credit score on applications, eviction rate, late-payment / NSF rate, and stable-employment percentage? A property-management company in the area should have these aggregated.
- How much new apartment / multifamily construction is in the pipeline within 1–3 miles? Heavy new supply (>2% of stock underway) typically softens rents 12–24 months out; light construction supports rent growth.
Investment metrics
- 1% rule
- 1.03% ✓
- Cap rate
- 7.78%
- Cash-on-cash
- 5.32%
- DSCR
- 1.24
- GRM
- 8.1
CMA / ARV
- ARV (median comp)
- $205,000
- List price
- $520,500
- Delta
- 153.90%
- Verdict
- OVERPRICED
- Comps
- 1 within 2.0 mi
Projected returns pro-forma
-3.0% appreciation · 3.92% rent growth · sell at horizon
- IRR
- -7.0%
- Equity multiple
- 0.74×
- Total profit
- $-38,099
- Equity at exit
- $77,608
- IRR
- 3.7%
- Equity multiple
- 1.28×
- Total profit
- $41,112
- Equity at exit
- $45,003
Cash invested: $145,740 (down + closing). Projections, not guarantees.
Landlord ↔ Tenant lean methodology
- Overall (STATE)
- 90 Strongly Landlord-Friendly
- State Alabama
- 90 Strongly Landlord-Friendly · R+15
- County
- — inherits STATE
- City
- — inherits STATE
ZIP-level market 36330
- Home prices YoY
- -19.4%
- Rents YoY
- 3.9%
- Active inventory
- 444
- Price-to-rent
- 32.3×
Monthly cashflow live
- Estimated rent
- $5,371 medium interval (Pro) →
- Mortgage (P&I)
- −$2,730
- Tax est. 1.5%
- −$651 /mo · $7,808/yr
- Insurance
- −$217
- HOA
- −$0
- Vacancy / Maint / Mgmt
- −$1,128
- Net cashflow
- $646
Break-even live
Sensitivity live
| Price | -10% $1,006 | -5% $826 | +0% $646 | +5% $466 | +10% $286 |
|---|---|---|---|---|---|
| Rent | -10% $222 | -5% $434 | +0% $646 | +5% $858 | +10% $1,070 |
| Rate | -1.0pp $908 | -0.5pp $778 | base $646 | +0.5pp $511 | +1.0pp $374 |
4-unit breakdown (identical units grouped — click to expand)
| Units | Beds | Baths | Est. rent |
|---|---|---|---|
| 4× units | 3 | — | $5,372 |
| #1 | 3 | — | $1,343 |
| #2 | 3 | — | $1,343 |
| #3 | 3 | — | $1,343 |
| #4 | 3 | — | $1,343 |
| Total (4 units) | $5,371 | ||
UW: 25.0% down · 7.5% · 30yr · 1.5% tax · 5.0% vac · 8.0% maint · 8.0% mgmt
Financing live
Cash to close
- Down payment
- $130,125
- Closing costs
- $15,615
- Reserves months
- —
- Total cash needed
- —
Loan-product check · same deal, 3 products live
Conventional
25% down · 7.5% · 30yr
- Down + closing
- —
- Monthly P&I
- —
- Monthly cashflow
- —
- DSCR
- —
- Eligible?
- —
Personal DTI + credit; lowest rate.
DSCR
20% down · 8.5% · 30yr
- Down + closing
- —
- Monthly P&I
- —
- Monthly cashflow
- —
- DSCR
- —
- Eligible?
- —
No personal income docs; deal must DSCR.
Hard money
10% down · 12.0% · 12mo
- Down + closing
- —
- Monthly P&I
- —
- Monthly cashflow
- —
- DSCR
- —
- Eligible?
- —
Short-term bridge; refi at stabilization.
Listing history 22 events
-
2026-06-21days on market $520,500 Active 55 DOM
-
2026-06-19days on market $520,500 Active 53 DOM
-
2026-06-18days on market $520,500 Active 52 DOM
-
2026-06-17days on market $520,500 Active 51 DOM
-
2026-06-16days on market $520,500 Active 50 DOM
-
2026-06-15days on market $520,500 Active 49 DOM
-
2026-06-14days on market $520,500 Active 47 DOM
-
2026-06-12days on market $520,500 Active 46 DOM
-
2026-06-09days on market $520,500 Active 43 DOM
-
2026-06-08days on market $520,500 Active 42 DOM
-
2026-06-07days on market $520,500 Active 41 DOM
-
2026-06-05days on market $520,500 Active 38 DOM
-
2026-06-03days on market $520,500 Active 37 DOM
-
2026-06-02days on market $520,500 Active 36 DOM
-
2026-06-01days on market $520,500 Active 35 DOM
-
2026-05-31days on market $520,500 Active 34 DOM
-
2026-05-30days on market $520,500 Active 33 DOM
-
2026-04-27$520,500 Active 494-char remark
-
2023-11-29historical $850
-
2023-11-02$850
-
2012-05-26$199,999
-
2012-05-26$199,999
ⓘ Source: listings_history table (triggers on properties + properties_extension) + one-shot
backfill from property_details.listing_events for pre-trigger history.
Climate risk First Street
- Flood 1/10 Low FEMA zone X (unshaded) · 0% chance over 30 yrs
- Wildfire 3/10 Moderate
- Heat 8/10 Severe 7 d/yr ≥106°F today · 19 d/yr by 30 yrs out
- Wind 8/10 Severe 99% chance of damaging wind over 30 yrs
- Air quality 2/10 Low 0 unhealthy d/yr today · 1 by 30 yrs out
Nearby sold comps map
Loading sold comps map…
Walkable amenities ~0.75 mi
Loading nearby amenities…
Taxation est. · year 1
- Rental income
- $64,452
- − Mortgage interest
- −$29,156
- − Property taxes
- −$7,808
- − Insurance
- −$2,602
- − Repairs & maintenance
- −$5,156
- − Management
- −$5,156
- − Depreciation
- −$15,142
- Taxable loss
- −$568
- Est. tax savings @ 24.0%
- +$136
- After-tax cash flow
- $7,889/yr
For passive investors: Depreciation is non-cash, so a rental often shows a tax loss while cash-flowing — sheltering income. Rental losses are passive: they offset passive income freely, and up to $25,000/yr can offset ordinary (W-2) income if you actively participate and your MAGI is under $100k (phasing out to $0 by $150k); unused losses carry forward. On sale, claimed depreciation is recaptured at up to 25%, and gains may owe capital-gains tax (a 1031 exchange can defer both). Figures are a year-1 estimate at your 24.0% rate — not tax advice; consult a CPA.
Schools (NCES district)
- District
- Enterprise City
- NCES district ID
- 0101320
- Math proficiency
- 40% ▼ -20.00%
- Reading proficiency
- 60% ▲ 4.00%
- Median HH income
- $51,311
- Composite
- 42.83/100
- National rank
- #3136
- State rank
- #12 of 129 in AL
Livability — Enterprise
- Score
- 65/100
- State rank
- #127
- US rank
- #12953
Category grades
Schools grade is shown separately in the Schools card above.
Census & demographics
- Census place
- Enterprise, AL
- County
- Coffee County · 39,557 people
- City population
- 39,557
- Metro
- Enterprise, AL
- Population (ZIP)
- 39,557
- Household income
- $75,765
- Rent vs Own
- Severe rent burden
- 1126.0
Population outlook (Coffee County) Hauer SSP2
- Today (2025)
- 53,133 people
- By 2030
- 53,832 · +1.3%
- By 2040
- 54,504 · +2.6%
- By 2050
- 54,289 · +2.2%
- By 2075
- 51,175 · -3.7%
- By 2100
- 46,793 · -11.9%
Race, ethnicity, and origin ACS 2023
- Neighborhood character
- Diverse neighborhood (Simpson 0.56)
- Race & ethnicity
- White 63% Black 17% Hispanic / Latino 13% Two or more races 9% Asian 1%
- Hispanic origin (detail)
- Mexican 6% Puerto Rican 3%
- Common ancestry
- Italian 3% Lithuanian 2% Serbian 2%
- Foreign-born
- 6% · Canada, Vietnam, South Korea
- Languages at home
- 89% English-only · Spanish 8% German/W. Germanic 2%
Political lean MEDSL · Coffee
- 2024 margin
- Solid R (+57.9) · D 20.7% · R 78.6%
- 2008→2024 swing
- -9.0pp toward R · 2008: -48.9pp · 2024: -57.9pp
- All cycles
- 2024: R+57.9 2020: R+53.1 2016: R+56.7 2012: R+49.4 2008: R+48.9
Not yet ingested
- Civics
- —
Market trends
- HPI YoY
- ▼ -44.44%
- Current HPI
- 184.0163
- Rent YoY
- ▲ 3.92%
- Metro
- Enterprise, AL
- State GDP YoY
- ▲ 2.94%
- F500 in state
- 4
Industry mix (Fortune 500 HQ in AL)
| Industry | F500 HQs | Revenue |
|---|---|---|
| Financial Services | 1 | $8B |
|
||
| Healthcare | 1 | $5B |
|
||
Price history
+160.3% since first listed5 events — show timeline
- 2026-04-27 Listed $520,500 WBR
- 2023-11-29 Rental Removed $850 APPFOLIO
- 2023-11-02 Listed for Rent $850 APPFOLIO
- 2012-05-26 Listed $199,999 MAAR
- 2012-05-26 Listed $199,999 WBR
Property tax history
+3.4%/yrLatest (2025): $525 · +6.5% YoY. Source: county tax records.
Cash-flow waterfall
monthlySold comps — $/sqft
last 12 mo · ≤1 miLoading sold comps…