 🏗️ New Construction
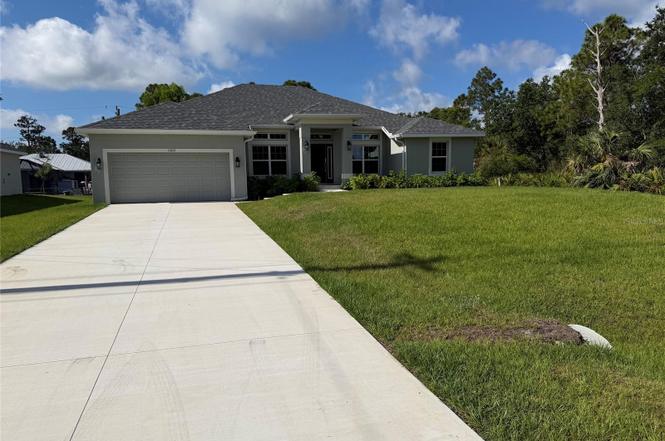
17433 Edgewater Dr · Port Charlotte, FL
Flood risk 9/10 · Severe
- FEMA flood zone
- AE
- Chance of flooding over 30 yrs
- 0.99%
- Est. flood insurance / yr
- $1,737 – $8,500
Fire risk 3/10 · Minor
- Est. fire insurance / yr
- $947 – $1,759
Heat risk 10/10 · Severe
- Hot days now (above 107°F)
- 7 days/yr
- Hot days in 30 yrs
- 28 days/yr
Wind risk 10/10 · Severe
- Chance of severe wind over 30 yrs
- 99.0%
Air-quality risk 3/10 · Minor
- Unhealthy air days now
- 2 days/yr
- Unhealthy air days in 30 yrs
- 3 days/yr
Risk factors via First Street. Map © Google.
Why this score? — see what drove the D- grade
The composite is a weighted blend of 9 inputs, each scored 0–100. Each bar is that input's sub-score; the figure is the points it added to the 100-point composite (weight × sub-score).
- Cash flow +11.7/30.0
- ARV discount +7.5/15.0
- Schools +4.6/10.0
- DSCR +3.5/10.0
- 1% rule +3.4/10.0
- Livability +3.2/5.0
- Condition / age +2.5/5.0
- Rent growth +2.1/5.0
- Appreciation +0.0/10.0
$344,800
🖨 Deal sheet (PDF) 📄 Offer letter ✓ Due diligence
Listing remarks MLS
Nice lot located close to schools, beaches, restaurants, Charlotte Sports Park and much much more! Can be purchased separately or as a double lot with 17439 Edgewater Drive price per lot $19,900
Key facts
- Granite in kitchen
- High ceilings
- Granite in baths
Tags
Property features AI
Finance
- Other: Lot approximately 0.23 acres (80 x 127); Living area reported by builder; Total building area reported by builder; Permit number CRC1330146
Exterior
- Parking: Attached garage (2 spaces)
- Utilities: Public water; Septic sewer; Cable available; Electricity available
- Home design: Single family residence; New construction (projected completion June 30, 2025); One story; North-facing
- Construction: Block and stucco construction; Shingle roof; Slab and stem wall foundation; Builder: Adams Homes; Model: 2169 A; Under construction
- Exterior features: French doors; Hurricane shutters; Irrigation equipment; Asphalt road access
Interior
- Kitchen: Dishwasher; Microwave; Range
- Bedrooms: 4 bedrooms
- Flooring: Carpet; Ceramic tile
- Bathrooms: 2 full bathrooms
- Heating & cooling: Central heating; Central air conditioning
- Interior features: High ceilings; In-wall pest system; Kitchen and family room combined; Split-bedroom layout; Stone countertops; Tray ceilings; Walk-in closets
- Laundry & utility: Washer hookup; Electric dryer hookup
Neighborhood map
What this means for you Summary
Snapshot
- This is a 4-bed/2.0-bath land listed at $345k.
Deal economics
- At list price, monthly cash flow is $-526 ($-6k/yr) — negative.
- To cash-flow at today's rent, offer at most $269k (22.1% below list).
- To meet the 1% rule (rent ≥ 1% of price), the offer needs to be $289k (16.2% below list).
- Recommended offer: $269k (22.1% below list) — sets the bar for cash-flow.
- Cap rate 5.9% vs local median 4.2% in Port Charlotte — top-decile yield for the area; either an underpriced asset or a hidden risk that comps aren't pricing in. Stress-test before assuming the spread holds.
Location & tenants
- Location reads 65/100 on livability (#655 in FL) — a middle-class / working-renter tenant base. Strengths: cost of living A+, housing A+; Watch: employment D, amenities F, commute F.
- Charlotte (suburban): math 54% / reading 54% proficiency, ranked #22 of 73 in FL (top 30%) — acceptable for families but not a draw, mixed tenant base, ~2y average lease.
- Zoned schools: Meadow Park Elementary School (math 61% / reading 56%, grade B-, #735 of 2,144 statewide, top 35%, 701 students, 59% FRL); Murdock Middle School (math 50% / reading 45%, grade C-, #288 of 571 statewide, top 51%, 577 students, 56% FRL); Port Charlotte High School (math 23% / reading 38%, grade F, #434 of 667 statewide, top 66%, 1,649 students, 43% FRL) — zoned schools at 53% FRL track the district average.
- Market conditions: Rents soft (-1.6%/yr); 963 active listings in the ZIP; 15 comparable units currently listed for rent nearby; rentals at typical pace (median 23d on market — plan ~3-4 weeks tenant-placement turnaround); 4,585 units permitted in Charlotte County in 2024 (703 in 5+ unit buildings).
- At $2,891/mo this rent would consume 55% of the median local household income ($63k/yr) (locally 501% of renters already pay >50% of income on rent) — very limited rent-growth headroom before tenants either downsize or default.
Forward outlook
- Local home prices are declining (-3.0%/yr); year-one equity from $2k of loan paydown is wiped out by about $10k of value loss. Plan a longer hold.
- Charlotte County population projected at +24% by 2050 — long-run rental-demand tailwind backs the buy-and-hold thesis.
Negotiation context
- It's been on market 417 days — a 12% lower offer ($303k) is reasonable based on typical stale-listing flexibility.
- 6 sale attempts since 9y ago; this cycle's ask has dropped $45k (11%) from the opening price — seller is motivated, your offer sets the floor, not the list.
- Current owner paid $20k; list at $345k implies a 1633% gain — meaningful room to come down on a strong offer.
Risks & watch-outs
- Watch-outs: flood insurance adds $427/mo.
- Climate carrying-cost: in FEMA flood zone AE (mandatory federal flood insurance); severe wind risk, 99% chance of damaging wind over 30y; extreme-heat days projected 7→28/yr by 2055 (HVAC capex compounding) — expect insurance premiums to compound above CPI over the hold.
Questions for the listing agent
- What do current leases actually rent for vs. the listed asking? Can we see a recent rent roll and the last 12 months of T-12 income?
- It's been on market 417 days. Have you received any prior offers? Is the seller open to a 22% concession, seller financing, or rate buy-down credit?
- What's the actual annual flood-insurance premium (NFIP or private), and is the property in a SFHA with mandatory coverage?
- Why hasn't it sold? Are there any deal-killer items the seller is aware of (foundation, flood, title, zoning, code violations)?
- Is there a deadline driving the sale (1031 exchange, divorce, estate, relocation)? That informs how much negotiation room exists.
- Schools are D-rated, which usually means shorter tenancies and higher turnover. Who's the typical renter profile here, and what's been the actual vacancy rate?
- The area grade is low — what's the realistic commute time and amenity access for the typical tenant pool here? Any planned neighborhood developments (good or bad) we should know about?
- What's the average days-on-market for RENTAL listings here right now (not sales)? A rising rental-DOM trend means longer vacancies and softer asking-rent achievability than the comps imply.
- What's the recent tenant-quality profile in this submarket — average credit score on applications, eviction rate, late-payment / NSF rate, and stable-employment percentage? A property-management company in the area should have these aggregated.
- How much new for-sale + rental construction is in the pipeline within 1–3 miles? Heavy new supply typically softens prices + rents 12–24 months out; constrained supply supports both.
Investment metrics
- 1% rule
- 0.84% ✗
- Cap rate
- 5.95%
- Cash-on-cash
- -1.23%
- DSCR
- 0.95
- GRM
- 9.9
CMA / ARV
No comps found within radius.
Projected returns pro-forma
-3.0% appreciation · 0.0% rent growth · sell at horizon
- IRR
- -31.6%
- Equity multiple
- -0.01×
- Total profit
- $-97,509
- Equity at exit
- $51,411
- IRR
- -62.4%
- Equity multiple
- -0.65×
- Total profit
- $-159,508
- Equity at exit
- $29,812
Cash invested: $96,544 (down + closing). Projections, not guarantees.
Landlord ↔ Tenant lean methodology
- Overall (STATE)
- 87 Strongly Landlord-Friendly
- State Florida
- 87 Strongly Landlord-Friendly · R+3
- County
- — inherits STATE
- City
- — inherits STATE
ZIP-level market 33948
- Home prices YoY
- -14.9%
- Rents YoY
- -1.6%
- Active inventory
- 963
- Price-to-rent
- 9.9×
Monthly cashflow live
- Estimated rent
- $2,891 high interval (Pro) →
- Mortgage (P&I)
- −$1,808
- Tax est. 1.5%
- −$431 /mo · $5,172/yr
- Insurance
- −$144
- Flood insurance flood zone
- −$427 /mo · $5,118/yr
- HOA
- −$0
- Vacancy / Maint / Mgmt
- −$607
- Net cashflow
- $-526
Break-even live
Sensitivity live
| Price | -10% $-287 | -5% $-406 | +0% $-526 | +5% $-645 | +10% $-764 |
|---|---|---|---|---|---|
| Rent | -10% $-754 | -5% $-640 | +0% $-526 | +5% $-411 | +10% $-297 |
| Rate | -1.0pp $-352 | -0.5pp $-438 | base $-526 | +0.5pp $-615 | +1.0pp $-706 |
UW: 25.0% down · 7.5% · 30yr · 1.5% tax · 5.0% vac · 8.0% maint · 8.0% mgmt
Financing live
Cash to close
- Down payment
- $86,200
- Closing costs
- $10,344
- Reserves months
- —
- Total cash needed
- —
Loan-product check · same deal, 3 products live
Conventional
25% down · 7.5% · 30yr
- Down + closing
- —
- Monthly P&I
- —
- Monthly cashflow
- —
- DSCR
- —
- Eligible?
- —
Personal DTI + credit; lowest rate.
DSCR
20% down · 8.5% · 30yr
- Down + closing
- —
- Monthly P&I
- —
- Monthly cashflow
- —
- DSCR
- —
- Eligible?
- —
No personal income docs; deal must DSCR.
Hard money
10% down · 12.0% · 12mo
- Down + closing
- —
- Monthly P&I
- —
- Monthly cashflow
- —
- DSCR
- —
- Eligible?
- —
Short-term bridge; refi at stabilization.
Rent comps 15 comps
| Address | Beds | Baths | Sqft | Rent | $/sqft | DOM | Units | Dist |
|---|---|---|---|---|---|---|---|---|
| 17154 Galleon Ter Port Charlotte, FL | 3.0 | 2.0 | 1451 | $1,895 | $1.31 | 23d | 1 | 0.53mi |
| 4306 Joseph St Port Charlotte, FL | 4.0 | 2.0 | 1636 | $2,600 | $1.59 | 15d | 1 | 0.57mi |
| 17424 Poston Ave Port Charlotte, FL | 4.0 | 2.0 | 1833 | $1,925 | $1.05 | 15d | 1 | 0.58mi |
| 17377 Lake Worth Blvd Port Charlotte, FL | 3.0 | 2.0 | 1522 | $5,900 | $3.88 | 15d | 1 | 0.59mi |
| 3153 Jody St Port Charlotte, FL | 4.0 | 2.0 | 1650 | $1,945 | $1.18 | 23d | 1 | 0.74mi |
| 17146 Marydale Rd Port Charlotte, FL | 3.0 | 2.0 | 2031 | $5,000 | $2.46 | 15d | 1 | 0.79mi |
| 18312 Driggers Ave Port Charlotte, FL | 3.0 | 2.0 | 1428 | $5,400 | $3.78 | 23d | 1 | 0.90mi |
| 18353 Grace Ave Port Charlotte, FL | 3.0 | 2.0 | 1658 | $2,100 | $1.27 | 23d | 1 | 0.94mi |
| 4088 Gingold St Port Charlotte, FL | 3.0 | 2.0 | 2810 | $4,800 | $1.71 | 23d | 1 | 0.97mi |
| 18310 Burkholder Cir Port Charlotte, FL | 3.0 | 2.0 | 1753 | $3,250 | $1.85 | 23d | 1 | 1.10mi |
| 17411 Reaper Ave Port Charlotte, FL | 3.0 | 2.0 | 2388 | $2,400 | $1.01 | 23d | 1 | 1.10mi |
| 18058 Avonsdale Cir Port Charlotte, FL | 3.0 | 2.0 | 1453 | $4,000 | $2.75 | 23d | 1 | 1.12mi |
| 4232 Swensson St Port Charlotte, FL | 4.0 | 2.5 | 2054 | $2,245 | $1.09 | 15d | 1 | 1.20mi |
| 18423 Elgin Ave Port Charlotte, FL | 4.0 | 2.0 | 1636 | $2,200 | $1.34 | 23d | 1 | 1.24mi |
| 18608 Alphonse Cir Port Charlotte, FL | 3.0 | 2.0 | 1441 | $4,000 | $2.78 | 23d | 1 | 1.29mi |
Listing history 24 events
-
2026-06-05statusdays on market $344,800 Pending 417 DOM
-
2026-06-02days on market $344,800 Active 415 DOM
-
2026-06-01days on market $344,800 Active 414 DOM
-
2026-05-31days on market $344,800 Active 413 DOM
-
2026-05-30days on market $344,800 Active 412 DOM
-
2026-05-01price $344,800
-
2026-04-30status Active
-
2026-03-30status Pending
-
2026-02-27status Active
-
2026-01-08status Pending
-
2025-11-26price $360,400
-
2025-11-26price $364,400
-
2025-01-24price $369,400
-
2025-01-22$389,400 Active
-
2021-06-25soldstatus $19,900 Closed 194-char remark
Show marketing remark (194 chars)
Nice lot located close to schools, beaches, restaurants, Charlotte Sports Park and much much more! Can be purchased separately or as a double lot with 17439 Edgewater Drive price per lot $19,900
-
2021-06-24soldstatus $39,800
-
2021-05-21status Pending 194-char remark
Show marketing remark (194 chars)
Nice lot located close to schools, beaches, restaurants, Charlotte Sports Park and much much more! Can be purchased separately or as a double lot with 17439 Edgewater Drive price per lot $19,900
-
2021-03-29$19,900 Active 194-char remark
Show marketing remark (194 chars)
Nice lot located close to schools, beaches, restaurants, Charlotte Sports Park and much much more! Can be purchased separately or as a double lot with 17439 Edgewater Drive price per lot $19,900
-
2018-05-17historical
-
2017-12-20price $10,900
-
2017-05-26$11,900 Active
-
2017-05-08historical
-
2017-02-18$11,900 Active
-
2003-12-03soldstatus $9,500
ⓘ Source: listings_history table (triggers on properties + properties_extension) + one-shot
backfill from property_details.listing_events for pre-trigger history.
Climate risk First Street
- Flood 9/10 Extreme FEMA zone AE · 99% chance over 30 yrs
- Wildfire 3/10 Moderate
- Heat 10/10 Extreme 7 d/yr ≥107°F today · 28 d/yr by 30 yrs out
- Wind 10/10 Extreme 99% chance of damaging wind over 30 yrs
- Air quality 3/10 Moderate 2 unhealthy d/yr today · 3 by 30 yrs out
Nearby sold comps map
Loading sold comps map…
Walkable amenities ~0.75 mi
Loading nearby amenities…
Taxation est. · year 1
- Rental income
- $34,692
- − Mortgage interest
- −$19,314
- − Property taxes
- −$5,172
- − Insurance
- −$6,842
- − Repairs & maintenance
- −$2,775
- − Management
- −$2,775
- − Depreciation
- −$10,031
- Taxable loss
- −$12,218
- Est. tax savings @ 24.0%
- +$2,932
- After-tax cash flow
- $-3,374/yr
For passive investors: Depreciation is non-cash, so a rental often shows a tax loss while cash-flowing — sheltering income. Rental losses are passive: they offset passive income freely, and up to $25,000/yr can offset ordinary (W-2) income if you actively participate and your MAGI is under $100k (phasing out to $0 by $150k); unused losses carry forward. On sale, claimed depreciation is recaptured at up to 25%, and gains may owe capital-gains tax (a 1031 exchange can defer both). Figures are a year-1 estimate at your 24.0% rate — not tax advice; consult a CPA.
Schools (NCES district)
- District
- Charlotte
- NCES district ID
- 1200240
- Math proficiency
- 54% ▼ -6.00%
- Reading proficiency
- 54% ▼ -1.00%
- Median HH income
- $44,864
- Composite
- 45.62/100
- National rank
- #2586
- State rank
- #22 of 73 in FL
Livability — Port Charlotte
- Score
- 65/100
- State rank
- #655
- US rank
- #13081
Category grades
Schools grade is shown separately in the Schools card above.
Census & demographics
- Census place
- Port Charlotte, FL
- County
- Charlotte County · 196,994 people
- City population
- 102,180
- Metro
- Punta Gorda, FL
- Population (ZIP)
- 18,696
- Household income
- $62,744
- Rent vs Own
- Severe rent burden
- 501.0
Population outlook (Charlotte County) Hauer SSP2
- Today (2025)
- 198,646 people
- By 2030
- 210,507 · +6.0%
- By 2040
- 230,857 · +16.2%
- By 2050
- 247,148 · +24.4%
- By 2075
- 281,777 · +41.8%
- By 2100
- 293,609 · +47.8%
Race, ethnicity, and origin ACS 2023
- Neighborhood character
- Predominantly White (79%)
- Race & ethnicity
- White 79% Two or more races 8% Black 7% Hispanic / Latino 7% Asian 2%
- Hispanic origin (detail)
- Mexican 2% Puerto Rican 1%
- Common ancestry
- Lithuanian 5% Romanian 4% Iranian 2%
- Foreign-born
- 11% · Canada
- Languages at home
- 88% English-only · Spanish 5% Russian/Polish/Slavic 2% Other Indo-European 1%
Political lean MEDSL · Charlotte
- 2024 margin
- Solid R (+34.0) · D 32.7% · R 66.7%
- 2008→2024 swing
- -26.7pp toward R · 2008: -7.2pp · 2024: -34.0pp
- All cycles
- 2024: R+34.0 2020: R+26.6 2016: R+27.8 2012: R+14.3 2008: R+7.2
Not yet ingested
- Civics
- —
Market trends
- HPI YoY
- ▼ -55.31%
- Current HPI
- 315.0548
- Rent YoY
- ▼ -1.63%
- Metro
- Punta Gorda, FL
- State GDP YoY
- ▲ 3.28%
- F500 in state
- 36
Industry mix (Fortune 500 HQ in FL)
| Industry | F500 HQs | Revenue |
|---|---|---|
| Industrial Technology | 2 | $29B |
|
||
| Insurance | 2 | $17B |
|
||
| Retail | 1 | $60B |
|
||
| Technology Distribution | 1 | $58B |
|
||
| Homebuilding | 1 | $35B |
|
||
| Technology Manufacturing | 1 | $35B |
|
||
Price history
+3529.5% since first listed19 events — show timeline
- 2026-05-01 Price Changed $344,800 Stellar MLS as Distributed by MLS Grid
- 2026-04-30 Relisted — Stellar MLS as Distributed by MLS Grid
- 2026-03-30 Pending — Stellar MLS as Distributed by MLS Grid
- 2026-02-27 Relisted — Stellar MLS as Distributed by MLS Grid
- 2026-01-08 Pending — Stellar MLS as Distributed by MLS Grid
- 2025-11-26 Price Changed $360,400 Stellar MLS as Distributed by MLS Grid
- 2025-11-26 Price Changed $364,400 Stellar MLS as Distributed by MLS Grid
- 2025-01-24 Price Changed $369,400 Stellar MLS as Distributed by MLS Grid
- 2025-01-22 Listed $389,400 Stellar MLS as Distributed by MLS Grid
- 2021-06-25 Sold (MLS) $19,900 Stellar MLS as Distributed by MLS Grid
- 2021-06-24 Sold (Public Records) $39,800 Public Records
- 2021-05-21 Pending — Stellar MLS as Distributed by MLS Grid
- 2021-03-29 Listed $19,900 Stellar MLS as Distributed by MLS Grid
- 2018-05-17 Listing Removed — Stellar MLS as Distributed by MLS Grid
- 2017-12-20 Price Changed $10,900 Stellar MLS as Distributed by MLS Grid
- 2017-05-26 Listed $11,900 Stellar MLS as Distributed by MLS Grid
- 2017-05-08 Listing Removed — Stellar MLS as Distributed by MLS Grid
- 2017-02-18 Listed $11,900 Stellar MLS as Distributed by MLS Grid
- 2003-12-03 Sold (Public Records) $9,500 Public Records
Property tax history
+2.3%/yrLatest (2025): $473 · -16.1% YoY. Source: county tax records.
Cash-flow waterfall
monthlySold comps — $/sqft
last 12 mo · ≤1 miLoading sold comps…