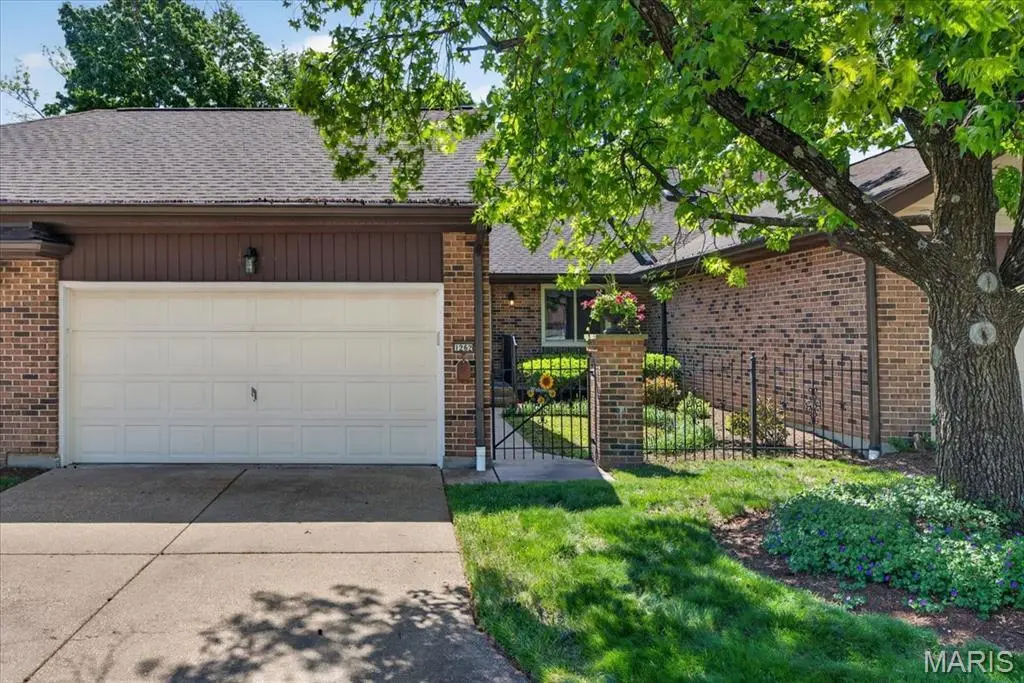
1262 Coral Bells Ct · Creve Coeur, MO
Flood risk 1/10 · Minimal
- FEMA flood zone
- X (unshaded)
- Chance of flooding over 30 yrs
- 0.0%
- Est. flood insurance / yr
- $473 – $860
Fire risk 1/10 · Minimal
- Est. fire insurance / yr
- $1,054 – $1,958
Heat risk 5/10 · Moderate
- Hot days now (above 106°F)
- 7 days/yr
- Hot days in 30 yrs
- 21 days/yr
Wind risk 2/10 · Minimal
- Chance of severe wind over 30 yrs
- 1.0%
Air-quality risk 2/10 · Minimal
- Unhealthy air days now
- 2 days/yr
- Unhealthy air days in 30 yrs
- 2 days/yr
Risk factors via First Street. Map © Google.
Why this score? — see what drove the D grade
The composite is a weighted blend of 9 inputs, each scored 0–100. Each bar is that input's sub-score; the figure is the points it added to the 100-point composite (weight × sub-score).
- ARV discount +11.2/15.0
- Appreciation +10.0/10.0
- Cash flow +5.8/30.0
- Schools +5.1/10.0
- Livability +4.0/5.0
- Condition / age +2.5/5.0
- 1% rule +2.4/10.0
- Rent growth +1.8/5.0
- DSCR +0.2/10.0
$275,000
🖨 Deal sheet (PDF) 📄 Offer letter ✓ Due diligence
Listing remarks
Enjoy effortless villa living in this beautifully updated ranch, tucked away on a quiet cul-de-sac in the highly sought-after Parkway Gardens Village community. With over 1,600 square feet of stylish, single-level living, this move-in ready home offers 2 bedrooms, 2 full bathrooms, a front-entry 2-car garage, and a private gated courtyard that enhances both charm and privacy. Inside, bright and versatile living spaces are designed to adapt to your lifestyle, featuring a spacious family room anchored by a cozy brick gas fireplace, a separate dining room, and an inviting living or sitting area. Sliding glass doors fill the home with natural light and provide a seamless connection to the outdo
Key facts
- 7,971 sq ft lot
- 2 garage spots
- Community pool
Property features AI
Finance
- Other: Private property subtype: villa; Community pool (association)
- Financial info: Lease not considered
- HOA & community: Part of Parkway Gardens Village HOA; Monthly association fee covers clubhouse, exterior and common area maintenance, parking/roads, management, pool, recreational facilities, roof, sewer, snow removal, trash and water; Community amenities include clubhouse, pool, tennis courts, park, curbs, street lights, and suburban setting
Exterior
- Parking: Attached, covered garage with automatic door opener and front-facing entry; 2-car garage
- Security: Smoke detectors; Carbon monoxide detectors
- Utilities: Public water; Public sewer; Electric service (Ameren); Cable, phone, and natural gas connected
- Home design: Attached villa; One level; Private ownership
- Construction: Brick veneer and vinyl siding; Architectural shingle roof; Concrete perimeter foundation; Built as a residence (villa)
- Exterior features: Private yard with garden; Patio; Level lot with some trees; Adjoins common ground
Interior
- Kitchen: Dishwasher; Disposal; Microwave; Free‑standing electric range; Refrigerator; Eat-in kitchen
- Bedrooms: Two bedrooms on the main level
- Flooring: Carpet; Laminate; Vinyl
- Bathrooms: Two full bathrooms on the main level
- Heating & cooling: Forced air heating; Central air conditioning; Ceiling fans
- Interior features: Built-in features; Ceiling fans; Crown molding; Eat-in kitchen; Blinds and insulated/window treatments; Gas fireplace with gas log in family room; Full unfinished basement with 8'+ pour (concrete)
- Laundry & utility: Main-level laundry room (inside) with washer and dryer included
Neighborhood map
What this means for you Summary
Snapshot
- This is a 2-bed/2.0-bath condo listed at $275k.
Deal economics
- At list price, monthly cash flow is $-552 ($-7k/yr) — negative.
- To cash-flow at today's rent, offer at most $177k (35.5% below list).
- To meet the 1% rule (rent ≥ 1% of price), the offer needs to be $202k (26.4% below list).
- Recommended offer: $177k (35.5% below list) — sets the bar for cash-flow.
- Cap rate 3.9% vs local median 2.7% in Creve Coeur — top-decile yield for the area; either an underpriced asset or a hidden risk that comps aren't pricing in. Stress-test before assuming the spread holds.
Location & tenants
- Location reads 81/100 on livability (#16 in MO, #1,519 nationally) — a professional / high-income tenant draw. Strengths: employment A+, housing A+, commute A-; Watch: amenities C-, cost of living F.
- Parkway C-2 (suburban): math 49% / reading 62% proficiency, ranked #18 of 324 in MO (top 6%) — acceptable for families but not a draw, mixed tenant base, ~2y average lease; only 14% free/reduced lunch — higher-income household profile.
- Zoned schools: Ross Elem. (math 27% / reading 42%, grade F, #676 of 1,115 statewide, top 66%, 385 students, 32% FRL); Northeast Middle (math 33% / reading 47%, grade F, #185 of 391 statewide, top 48%, 703 students, 24% FRL); North High (math 35% / reading 70%, grade C-, #89 of 521 statewide, top 17%, 1,074 students, 34% FRL) — zoned schools average 30% FRL vs 14% district-wide (16 pts higher); higher-poverty schools than district average — tighter screening recommended.
- Zoned-school proficiency averages 42% at this address vs 56% district-wide (-13 pts) — the specific schools serving this property underperform the Parkway C-2 average; the district grade overstates school quality for this exact location.
- Market conditions: Rents soft (-3.0%/yr); 173 active listings in the ZIP; 11 comparable units currently listed for rent nearby; rentals leasing fast (median 13d on market — plan ~1-2 weeks tenant-placement turnaround); solid renter incomes; 920 units permitted in St. Louis County in 2024 (250 in 5+ unit buildings).
Forward outlook
- In year one you build about $29k of equity ($2k loan paydown + $28k appreciation (10.0% local appreciation)).
- By year 2, paydown + projected appreciation supports a ~$47k cash-out refi (75% LTV) — recoverable capital for the next deal without selling this one.
Negotiation context
- Only 8 days on market — expect competitive offers; lowballing is unlikely to land.
Risks & watch-outs
- Climate carrying-cost: extreme-heat days projected 7→21/yr by 2055 (HVAC capex compounding) — expect insurance premiums to compound above CPI over the hold.
Questions for the listing agent
- What do current leases actually rent for vs. the listed asking? Can we see a recent rent roll and the last 12 months of T-12 income?
- Built in 1979 — when were the roof, HVAC, electrical panel, plumbing, and water heater last replaced?
- What does the HOA fee cover, when was the last increase, and are there any pending special assessments or reserve-fund shortfalls?
- Any open or pending special assessments — roof, HVAC, plumbing, elevator, façade? What's the per-unit balance and payoff schedule, and is the seller paying it off at close or rolling it to the buyer?
- Is there a deadline driving the sale (1031 exchange, divorce, estate, relocation)? That informs how much negotiation room exists.
- Schools are A-rated — typically a magnet for longer-tenancy family renters. What's the average tenant stay here, and is there a school-zone premium baked into asking?
- The area grade is low — what's the realistic commute time and amenity access for the typical tenant pool here? Any planned neighborhood developments (good or bad) we should know about?
- What's the average days-on-market for RENTAL listings here right now (not sales)? A rising rental-DOM trend means longer vacancies and softer asking-rent achievability than the comps imply.
- What's the recent tenant-quality profile in this submarket — average credit score on applications, eviction rate, late-payment / NSF rate, and stable-employment percentage? A property-management company in the area should have these aggregated.
- How much new apartment / multifamily construction is in the pipeline within 1–3 miles? Heavy new supply (>2% of stock underway) typically softens rents 12–24 months out; light construction supports rent growth.
Investment metrics
- 1% rule
- 0.74% ✗
- Cap rate
- 3.88%
- Cash-on-cash
- -8.61%
- DSCR
- 0.62
- GRM
- 11.3
CMA / ARV
- ARV (median comp)
- $299,976
- List price
- $275,000
- Delta
- -8.33%
- Verdict
- FAIR
- Comps
- 20 within 1.0 mi
Projected returns pro-forma
10.0% appreciation · 0.0% rent growth · sell at horizon
- IRR
- 17.4%
- Equity multiple
- 2.41×
- Total profit
- $108,840
- Equity at exit
- $247,742
- IRR
- 15.8%
- Equity multiple
- 5.39×
- Total profit
- $337,937
- Equity at exit
- $534,265
Cash invested: $77,000 (down + closing). Projections, not guarantees.
Landlord ↔ Tenant lean methodology
- Overall (STATE)
- 81 Strongly Landlord-Friendly
- State Missouri
- 81 Strongly Landlord-Friendly · R+10
- County
- — inherits STATE
- City
- — inherits STATE
ZIP-level market 63146
- Home prices YoY
- 4.9%
- Rents YoY
- -3.0%
- Active inventory
- 173
- Price-to-rent
- 11.3×
Monthly cashflow live
- Estimated rent
- $2,023 high interval (Pro) →
- Mortgage (P&I)
- −$1,442
- Tax from tax record
- −$211 /mo · $2,532/yr
- Insurance
- −$115
- HOA
- −$383
- Vacancy / Maint / Mgmt
- −$425
- Net cashflow
- $-552
Break-even live
Sensitivity live
| Price | -10% $-397 | -5% $-475 | +0% $-552 | +5% $-630 | +10% $-708 |
|---|---|---|---|---|---|
| Rent | -10% $-712 | -5% $-632 | +0% $-552 | +5% $-473 | +10% $-393 |
| Rate | -1.0pp $-414 | -0.5pp $-483 | base $-552 | +0.5pp $-624 | +1.0pp $-696 |
UW: 25.0% down · 7.5% · 30yr · 1.5% tax · 5.0% vac · 8.0% maint · 8.0% mgmt
Financing live
Cash to close
- Down payment
- $68,750
- Closing costs
- $8,250
- Reserves months
- —
- Total cash needed
- —
Loan-product check · same deal, 3 products live
Conventional
25% down · 7.5% · 30yr
- Down + closing
- —
- Monthly P&I
- —
- Monthly cashflow
- —
- DSCR
- —
- Eligible?
- —
Personal DTI + credit; lowest rate.
DSCR
20% down · 8.5% · 30yr
- Down + closing
- —
- Monthly P&I
- —
- Monthly cashflow
- —
- DSCR
- —
- Eligible?
- —
No personal income docs; deal must DSCR.
Hard money
10% down · 12.0% · 12mo
- Down + closing
- —
- Monthly P&I
- —
- Monthly cashflow
- —
- DSCR
- —
- Eligible?
- —
Short-term bridge; refi at stabilization.
Rent comps 11 comps
| Address | Beds | Baths | Sqft | Rent | $/sqft | DOM | Units | Dist |
|---|---|---|---|---|---|---|---|---|
| 1308 Palm Ridge Ct Saint Louis, MO | 3.0 | 2.0 | 1652 | $2,400 | $1.45 | 0d | 1 | 0.63mi |
| 815 Montmartre Ct Saint Louis, MO | 3.0 | 2.0 | 1862 | $2,300 | $1.24 | 45d | 1 | 0.63mi |
| 12545 Markaire Dr St. Louis, MO | 1.0–3.0 | 1.0–4.0 | 1420 | $2,188 | $1.54 | 12d | 5 | 0.82mi |
| 12806 Willowyck Dr Saint Louis, MO | 3.0 | 2.0 | 1456 | $2,500 | $1.72 | 45d | 1 | 0.82mi |
| 1173 Pompeii Dr Chesterfield, MO | 1.0–2.0 | 1.0–2.0 | 950 | $1,799 | $1.89 | 0d | 24 | 1.00mi |
| 12465 Larkwood Dr Saint Louis, MO | 3.0 | 2.0 | 1563 | $2,131 | $1.36 | 0d | 1 | 1.23mi |
| 502 Broadmoor Dr Unit 506 Chesterfield, MO | 3.0 | 2.5 | 1500 | $2,250 | $1.50 | 25d | 1 | 1.25mi |
| 506 Broadmoor Dr Chesterfield, MO | 3.0 | 2.5 | 1500 | $2,250 | $1.50 | 45d | 1 | 1.26mi |
| 616 Broadmoor Dr Unit C Chesterfield, MO | 3.0 | 2.0 | 1120 | $1,795 | $1.60 | 9d | 1 | 1.34mi |
| 1951 Oberlin Dr St. Louis, MO | 1.0–3.0 | 1.0–2.5 | 993 | $1,684 | $1.70 | 0d | 24 | 1.43mi |
| 631 Broadmoor Dr Unit A Chesterfield, MO | 3.0 | 2.0 | 1050 | $2,000 | $1.90 | 45d | 1 | 1.49mi |
HOA detail condo
- Monthly dues
- $383 · $4,596/yr
- Likely covers
- gassecurity
- Assessments
- None detected in remarks — confirm with the listing agent.
Listing history 4 events
-
2026-05-12status Pending 1778-char remark
-
2026-05-04$275,000 Active 1778-char remark
-
1997-02-25soldstatus
-
1980-02-01soldstatus
ⓘ Source: listings_history table (triggers on properties + properties_extension) + one-shot
backfill from property_details.listing_events for pre-trigger history.
Tax reassessment forecast MO · Resets to sale price
- Current annual tax
- $2,532 · $211/mo
- Projected year-2 tax
- $2,668 · $222/mo
- Expected delta
- +$136/yr (+$11/mo · 5.4%)
ⓘ Screening estimate from a state-policy table — verify with the county assessor before closing.
Climate risk First Street
- Flood 1/10 Low FEMA zone X (unshaded) · 0% chance over 30 yrs
- Wildfire 1/10 Low
- Heat 5/10 Major 7 d/yr ≥106°F today · 21 d/yr by 30 yrs out
- Wind 2/10 Low 100% chance of damaging wind over 30 yrs
- Air quality 2/10 Low 2 unhealthy d/yr today · 2 by 30 yrs out
Nearby sold comps map
Loading sold comps map…
Walkable amenities ~0.75 mi
Loading nearby amenities…
Taxation est. · year 1
- Rental income
- $24,277
- − Mortgage interest
- −$15,404
- − Property taxes
- −$2,532
- − Insurance
- −$1,375
- − Repairs & maintenance
- −$1,942
- − Management
- −$1,942
- − HOA
- −$4,596
- − Depreciation
- −$8,000
- Taxable loss
- −$11,515
- Est. tax savings @ 24.0%
- +$2,764
- After-tax cash flow
- $-3,866/yr
For passive investors: Depreciation is non-cash, so a rental often shows a tax loss while cash-flowing — sheltering income. Rental losses are passive: they offset passive income freely, and up to $25,000/yr can offset ordinary (W-2) income if you actively participate and your MAGI is under $100k (phasing out to $0 by $150k); unused losses carry forward. On sale, claimed depreciation is recaptured at up to 25%, and gains may owe capital-gains tax (a 1031 exchange can defer both). Figures are a year-1 estimate at your 24.0% rate — not tax advice; consult a CPA.
Schools (NCES district)
- District
- Parkway C-2
- NCES district ID
- 2923580
- Math proficiency
- 49% ▼ -11.00%
- Reading proficiency
- 62% ▼ -2.00%
- Median HH income
- $83,551
- Composite
- 50.5/100
- National rank
- #1851
- State rank
- #18 of 324 in MO
Livability — Creve Coeur
- Score
- 81/100
- State rank
- #16
- US rank
- #1519
Category grades
Schools grade is shown separately in the Schools card above.
Census & demographics
- County
- Saint Louis County · 888,823 people
- City population
- 20,932
- Metro
- St. Louis, MO-IL
- Population (ZIP)
- 30,678
- Household income
- $84,756
- Rent vs Own
- Severe rent burden
- 1156.0
Population outlook (St. Louis County) Hauer SSP2
- Today (2025)
- 1,025,227 people
- By 2030
- 1,028,023 · +0.3%
- By 2040
- 1,020,940 · -0.4%
- By 2050
- 1,007,280 · -1.8%
- By 2075
- 987,277 · -3.7%
- By 2100
- 921,984 · -10.1%
Race, ethnicity, and origin ACS 2023
- Neighborhood character
- Diverse neighborhood (Simpson 0.56)
- Race & ethnicity
- White 63% Asian 17% Black 13% Two or more races 4% Hispanic / Latino 3%
- Common ancestry
- Scotch-Irish 3% Romanian 3% Italian 2%
- Foreign-born
- 19% · China, South Korea, Canada
- Languages at home
- 79% English-only · Other Asian/Pacific 7% Other Indo-European 4% Chinese 3%
Political lean MEDSL · St. Louis
- 2024 margin
- Strong D (+23.4) · D 60.8% · R 37.4% · Other 1.7%
- 2008→2024 swing
- +3.5pp toward D · 2008: 19.9pp · 2024: 23.4pp
- All cycles
- 2024: D+23.4 2020: D+24.0 2016: D+16.2 2012: D+13.7 2008: D+19.9
Not yet ingested
- Civics
- —
Market trends
- HPI YoY
- ▲ 33.10%
- Current HPI
- 711.49
- Rent YoY
- ▼ -2.96%
- Metro
- St. Louis, MO-IL
- State GDP YoY
- ▲ 1.84%
- F500 in state
- 20
Industry mix (Fortune 500 HQ in MO)
| Industry | F500 HQs | Revenue |
|---|---|---|
| Healthcare | 1 | $163B |
|
||
| Insurance | 1 | $21B |
|
||
| Industrial Technology | 1 | $17B |
|
||
| Retail | 1 | $16B |
|
||
| Industrial Distribution | 1 | $10B |
|
||
| Utilities | 1 | $9B |
|
||
Price history
4 events — show timeline
- 2026-05-12 Pending — MARIS as Distributed by MLS Grid
- 2026-05-04 Listed $275,000 MARIS as Distributed by MLS Grid
- 1997-02-25 Sold (Public Records) — Public Records
- 1980-02-01 Sold (Public Records) — Public Records
Property tax history
+1.6%/yrLatest (2022): $2,532 · +0.4% YoY. Source: county tax records.
Cash-flow waterfall
monthlySold comps — $/sqft
last 12 mo · ≤1 miLoading sold comps…