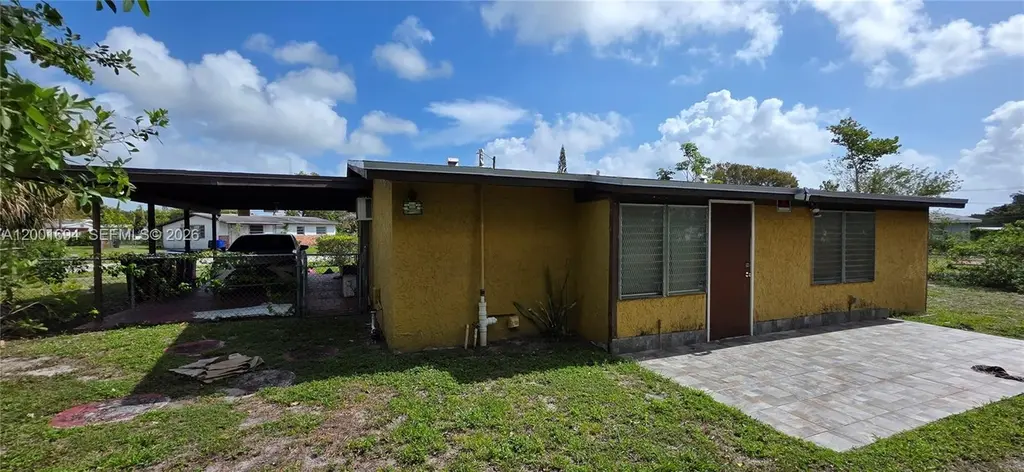
1708 NW 15th St · Fort Lauderdale, FL
Flood risk 1/10 · Minimal
- FEMA flood zone
- X (shaded)
- Chance of flooding over 30 yrs
- 0.0%
- Est. flood insurance / yr
- $507 – $1,088
Fire risk 1/10 · Minimal
- Est. fire insurance / yr
- $947 – $1,759
Heat risk 10/10 · Severe
- Hot days now (above 105°F)
- 7 days/yr
- Hot days in 30 yrs
- 27 days/yr
Wind risk 10/10 · Severe
- Chance of severe wind over 30 yrs
- 99.0%
Air-quality risk 2/10 · Minimal
- Unhealthy air days now
- 2 days/yr
- Unhealthy air days in 30 yrs
- 2 days/yr
Risk factors via First Street. Map © Google.
Why this score? — see what drove the B grade
The composite is a weighted blend of 9 inputs, each scored 0–100. Each bar is that input's sub-score; the figure is the points it added to the 100-point composite (weight × sub-score).
- Cash flow +30.0/30.0
- 1% rule +10.0/10.0
- DSCR +10.0/10.0
- ARV discount +7.5/15.0
- Schools +4.1/10.0
- Livability +4.1/5.0
- Rent growth +3.2/5.0
- Condition / age +2.5/5.0
- Appreciation +0.0/10.0
$155,000
🖨 Deal sheet 📄 Offer letter ✓ Due diligence
Listing remarks
NO CALLS PLZ. Unapproved short sale. Full renovation project. The property features a functional layout with a covered carport and outdoor space but requires significant repairs and updates throughout and is being sold strictly as-is. Interior condition reflects deferred maintenance, including visible water staining, possible moisture intrusion, and outdated kitchen and bathroom finishes that will need complete renovation. Walls, ceilings, and flooring will require repair or replacement. Exterior shows wear, including aging stucco and paint, and the roof and major systems — plumbing, electrical, and HVAC — should be inspected as condition is unknown. Property may have mold and w
Key facts
- 8,622 sq ft lot
- Parking
- Built 1952
Neighborhood map
What this means for you Summary
Snapshot
- This is a 3-bed/1.0-bath single-family listed at $155k.
Deal economics
- At list price, monthly cash flow is $1k ($14k/yr) — positive.
- The deal already cash-flows at list — no discount required.
- Meets the 1% rule at list price ($3k rent vs $155k).
- Cap rate 15.4% vs local median 2.2% in Fort Lauderdale — top-decile yield for the area; either an underpriced asset or a hidden risk that comps aren't pricing in. Stress-test before assuming the spread holds.
Location & tenants
- Location reads 82/100 on livability (#78 in FL, #1,293 nationally) — a professional / high-income tenant draw. Strengths: crime A+, amenities A+, health & safety A+; Watch: cost of living D-.
- Broward (suburban): math 42% / reading 53% proficiency, ranked #46 of 73 in FL (top 63%) — families likely to look elsewhere, expect single-tenant / working-renter base with shorter leases.
- Market conditions: Rents rising (+2.8%/yr); 585 active listings in the ZIP; 40 comparable units currently listed for rent nearby; rentals at typical pace (median 25d on market — plan ~3-4 weeks tenant-placement turnaround); 2,111 units permitted in Broward County in 2024 (1,265 in 5+ unit buildings).
- At $2,726/mo this rent would consume 61% of the median local household income ($54k/yr) (locally 5068% of renters already pay >50% of income on rent) — very limited rent-growth headroom before tenants either downsize or default.
Forward outlook
- Local home prices are declining (-3.0%/yr); year-one equity from $1k of loan paydown is wiped out by about $5k of value loss. Plan a longer hold.
- Broward County population projected at +34% by 2050 — long-run rental-demand tailwind backs the buy-and-hold thesis.
- At projected returns (-3.0% appreciation + 2.8% rent growth), your $43k cash investment doubles in ~4 years — after that, you're playing with house money.
Negotiation context
- Only 9 days on market — expect competitive offers; lowballing is unlikely to land.
- Current owner paid $28k; list at $155k implies a 454% gain — meaningful room to come down on a strong offer.
Risks & watch-outs
- Watch-outs: built in 1952 — expect roof / HVAC / electrical / plumbing capex.
- Climate carrying-cost: severe wind risk, 99% chance of damaging wind over 30y; extreme-heat days projected 7→27/yr by 2055 (HVAC capex compounding) — expect insurance premiums to compound above CPI over the hold.
Questions for the listing agent
- Built in 1952 — when were the roof, HVAC, electrical panel, plumbing, and water heater last replaced?
- Is there a deadline driving the sale (1031 exchange, divorce, estate, relocation)? That informs how much negotiation room exists.
- Schools are B-rated — typically a magnet for longer-tenancy family renters. What's the average tenant stay here, and is there a school-zone premium baked into asking?
- What's the average days-on-market for RENTAL listings here right now (not sales)? A rising rental-DOM trend means longer vacancies and softer asking-rent achievability than the comps imply.
- What's the recent tenant-quality profile in this submarket — average credit score on applications, eviction rate, late-payment / NSF rate, and stable-employment percentage? A property-management company in the area should have these aggregated.
- How much new for-sale + rental construction is in the pipeline within 1–3 miles? Heavy new supply typically softens prices + rents 12–24 months out; constrained supply supports both.
Investment metrics
- 1% rule
- 1.76% ✓
- Cap rate
- 15.39%
- Cash-on-cash
- 32.47%
- DSCR
- 2.44
- GRM
- 4.7
CMA / ARV
- ARV (on-the-fly)
- $420,576
- Comps found
- 10
Show comp detail 10 sales within ~0.75 mi
| Address | Dist | Beds/Ba | Sqft | Sold | Price | $/sf | Match |
|---|---|---|---|---|---|---|---|
| 1304 NW 19th Ave | 0.21mi | 3/2.0 | 1,193 (-4%) | 14mo | $466,300 | $391 | 67 |
| 1109 NW 15th Ave | 0.48mi | 3/2.0 | 1,291 (+3%) | 4mo | $439,000 | $340 | 65 |
| 1031 NW 13th St | 0.53mi | 3/2.0 | 1,336 (+7%) | 1mo | $430,000 | $322 | 58 |
| 1709 NW 14th St | 0.09mi | 3/2.0 | 1,118 (-10%) | 24mo | $399,000 | $357 | 54 |
| — | 0.69mi | 3/2.0 | 1,344 (+8%) | 2mo | $390,000 | $290 | 49 |
| 1536 NW 15th Ave | 0.27mi | 4/2.0 (+1) | 1,344 (+8%) | 20mo | $400,000 | $298 | 49 |
| 1000 NW 13th St | 0.61mi | 4/2.0 (+1) | 1,378 (+10%) | 8mo | $465,000 | $337 | 39 |
| 2641 NW 15th St | 0.73mi | 3/2.0 | 1,188 (-5%) | 19mo | $400,000 | $337 | 38 |
| 1171 NW 19th St | 0.70mi | 3/2.0 | 1,354 (+8%) | 22mo | $375,000 | $277 | 31 |
| 1018 NW 13th Ct | 0.55mi | 4/2.0 (+1) | 1,411 (+13%) | 18mo | $373,000 | $264 | 29 |
Match score weights: distance 35% · size 25% · config 20% · recency 20%. Top-matched comps best support the ARV.
Projected returns pro-forma
-3.0% appreciation · 2.78% rent growth · sell at horizon
- IRR
- 27.3%
- Equity multiple
- 2.13×
- Total profit
- $49,071
- Equity at exit
- $23,111
- IRR
- 34.7%
- Equity multiple
- 4.15×
- Total profit
- $136,531
- Equity at exit
- $13,402
Cash invested: $43,400 (down + closing). Projections, not guarantees.
Landlord ↔ Tenant lean methodology
- Overall (STATE)
- 87 Strongly Landlord-Friendly
- State Florida
- 87 Strongly Landlord-Friendly · R+3
- County
- — inherits STATE
- City
- — inherits STATE
ZIP-level market 33311
- Rents YoY
- 2.8%
- Active inventory
- 585
- Price-to-rent
- 4.7×
Monthly cashflow live
- Estimated rent
- $2,726 high interval (Pro) →
- Mortgage (P&I)
- −$813
- Tax from tax record
- −$102 /mo · $1,223/yr
- Insurance
- −$65
- HOA
- −$0
- Vacancy / Maint / Mgmt
- −$573
- Net cashflow
- $1,175
Break-even live
UW: 25.0% down · 7.5% · 30yr · 1.5% tax · 5.0% vac · 8.0% maint · 8.0% mgmt
Financing live
Cash to close
- Down payment
- $38,750
- Closing costs
- $4,650
- Reserves months
- —
- Total cash needed
- —
Loan-product check · same deal, 3 products live
Conventional
25% down · 7.5% · 30yr
- Down + closing
- —
- Monthly P&I
- —
- Monthly cashflow
- —
- DSCR
- —
- Eligible?
- —
Personal DTI + credit; lowest rate.
DSCR
20% down · 8.5% · 30yr
- Down + closing
- —
- Monthly P&I
- —
- Monthly cashflow
- —
- DSCR
- —
- Eligible?
- —
No personal income docs; deal must DSCR.
Hard money
10% down · 12.0% · 12mo
- Down + closing
- —
- Monthly P&I
- —
- Monthly cashflow
- —
- DSCR
- —
- Eligible?
- —
Short-term bridge; refi at stabilization.
Rent comps 40 comps
| Address | Beds | Baths | Sqft | Rent | $/sqft | DOM | Units | Dist |
|---|---|---|---|---|---|---|---|---|
| 1608 NW 16th St Fort Lauderdale, FL | 4.0 | 2.0 | 1382 | $2,830 | $2.05 | 3d | 1 | 0.20mi |
| 1531 NW 15th Ave Fort Lauderdale, FL | 3.0 | 1.0 | 960 | $3,500 | $3.65 | 4d | 1 | 0.22mi |
| 1600 NW 13th Ct Unit 1 Fort Lauderdale, FL | 3.0 | 1.0 | 1308 | $2,550 | $1.95 | 2d | 1 | 0.22mi |
| 1859 Lauderdale Manor Dr Fort Lauderdale, FL | 4.0 | 2.0 | 1178 | $2,965 | $2.52 | 24d | 1 | 0.30mi |
| 1733 NW 18th St Fort Lauderdale, FL | 2.0 | 2.0 | 967 | $3,300 | $3.41 | 7d | 1 | 0.36mi |
| 2330 NW 13th St Fort Lauderdale, FL | 2.0 | 1.0 | 750 | $2,700 | $3.60 | 24d | 1 | 0.51mi |
| 2360 NW 14th St Fort Lauderdale, FL | 3.0 | 2.0 | 1489 | $3,200 | $2.15 | 24d | 1 | 0.51mi |
| 1203 Chateau Park Dr Fort Lauderdale, FL | 2.0 | 1.0 | 1104 | $2,000 | $1.81 | 15d | 1 | 0.53mi |
| 1121 NW 23rd Ter Fort Lauderdale, FL | 3.0 | 2.0 | 1364 | $2,646 | $1.94 | 5d | 1 | 0.54mi |
| 1325 NW 11th Ct Fort Lauderdale, FL | 3.0 | 2.0 | 1084 | $3,000 | $2.77 | 24d | 1 | 0.54mi |
| 1436 NW 24th Ter Fort Lauderdale, FL | 3.0 | 1.0 | 992 | $2,500 | $2.52 | 24d | 1 | 0.54mi |
| 1480 NW 19th Ct Unit 2 Fort Lauderdale, FL | 2.0 | 2.0 | 950 | $1,850 | $1.95 | 24d | 1 | 0.55mi |
| 1901 NW 14th Ave Unit B Fort Lauderdale, FL | 2.0 | 1.0 | 720 | $2,100 | $2.92 | 24d | 1 | 0.57mi |
| 1901 NW 14th Ave Unit A Fort Lauderdale, FL | 2.0 | 1.0 | 720 | $2,100 | $2.92 | 24d | 1 | 0.57mi |
| 1418 NW 11th St Fort Lauderdale, FL | 3.0 | 2.0 | 1417 | $4,300 | $3.03 | 24d | 1 | 0.57mi |
| 1418 NW 11th St Fort Lauderdale, FL | 3.0 | 2.0 | 1417 | $3,750 | $2.65 | 5d | 1 | 0.57mi |
| 1325 NW 11th St Unit 1325 Fort Lauderdale, FL | 3.0 | 2.0 | 1084 | $3,000 | $2.77 | 24d | 1 | 0.58mi |
| 1306 NW 11th Ct Fort Lauderdale, FL | 2.0 | 1.0 | 950 | $1,827 | $1.92 | 20d | 1 | 0.58mi |
| 1471 NW 20th St Unit A Fort Lauderdale, FL | 2.0 | 2.0 | 1100 | $2,200 | $2.00 | 24d | 1 | 0.62mi |
| 1040 NW 23rd Ter Fort Lauderdale, FL | 3.0 | 1.0 | 900 | $2,550 | $2.83 | 24d | 1 | 0.64mi |
| 1070 NW 23rd Rd Fort Lauderdale, FL | 3.0 | 1.0 | 1160 | $2,800 | $2.41 | 24d | 1 | 0.67mi |
| 2571 NW 13th Ct Unit C Fort Lauderdale, FL | 2.0 | 1.0 | 700 | $1,600 | $2.29 | 20d | 1 | 0.70mi |
| 2571 NW 13th Ct Unit 3 Fort Lauderdale, FL | 2.0 | 1.0 | 700 | $1,600 | $2.29 | 24d | 1 | 0.70mi |
| 2601 NW 15th Ct Unit 1545926P Fort Lauderdale, FL | 4.0 | 3.0 | 1431 | $6,290 | $4.40 | 15d | 1 | 0.71mi |
| 2620 NW 14th Ct Unit 2620 Fort Lauderdale, FL | 3.0 | 2.0 | 1080 | $2,900 | $2.69 | 3d | 1 | 0.71mi |
| 1816 NW 25th Ter Unit 1 Fort Lauderdale, FL | 2.0 | 1.0 | 1100 | $2,500 | $2.27 | 20d | 1 | 0.72mi |
| 2231 NW 9th Pl Unit H Fort Lauderdale, FL | 3.0 | 2.0 | 864 | $2,700 | $3.12 | 11d | 1 | 0.77mi |
| 1441 NW 22nd St Apt 20 Fort Lauderdale, FL | 2.0 | 1.0 | 1207 | $1,615 | $1.34 | 5d | 1 | 0.78mi |
| 1441 NW 22nd St Fort Lauderdale, FL | 2.0 | 1.0 | 1000 | $1,599 | $1.60 | 3d | 1 | 0.78mi |
| 1541 NW 8th Ave Unit 1541 Fort Lauderdale, FL | 2.0 | 1.0 | 700 | $1,975 | $2.82 | 24d | 1 | 0.79mi |
| 1329 NW 8th Ave Unit A Fort Lauderdale, FL | 3.0 | 2.0 | 1134 | $2,350 | $2.07 | 11d | 1 | 0.79mi |
| 1491 NW 22nd Ct Unit 3 Fort Lauderdale, FL | 2.0 | 1.0 | 825 | $1,550 | $1.88 | 24d | 1 | 0.80mi |
| 2708 NW 15th St Fort Lauderdale, FL | 2.0 | 1.0 | 750 | $1,700 | $2.27 | 24d | 1 | 0.82mi |
| 1414 NW 8th Ave Unit 1 Fort Lauderdale, FL | 3.0 | 2.0 | 1300 | $2,300 | $1.77 | 24d | 1 | 0.82mi |
| 839 NW 14th Ave Unit 1 Fort Lauderdale, FL | 2.0 | 1.0 | 850 | $1,950 | $2.29 | 17d | 1 | 0.82mi |
| 1312 NW 8th Ave Fort Lauderdale, FL | 2.0 | 1.0 | 800 | $1,999 | $2.50 | 4d | 1 | 0.84mi |
| 1312 NW 8th Ave Fort Lauderdale, FL | 2.0 | 1.0 | 800 | $1,950 | $2.44 | 3d | 1 | 0.84mi |
| 1335 NW 7th Ter Fort Lauderdale, FL | 3.0 | 1.5 | 1200 | $2,550 | $2.12 | 2d | 1 | 0.85mi |
| 1621 NW 7th Ter Unit B Fort Lauderdale, FL | 2.0 | 1.0 | 1344 | $2,300 | $1.71 | 24d | 1 | 0.86mi |
| 918 NW 24th Ave Fort Lauderdale, FL | 3.0 | 1.0 | 1332 | $2,300 | $1.73 | 24d | 1 | 0.86mi |
Listing history 5 events
-
2026-04-25status Pending
-
2026-04-18historical Active Under Contract
-
2026-04-09$155,000 Active
-
1978-06-01soldstatus $28,000
-
1965-08-01soldstatus $12,600
ⓘ Source: listings_history table (triggers on properties + properties_extension) + one-shot
backfill from property_details.listing_events for pre-trigger history.
Tax reassessment forecast FL · Resets to sale price
- Current annual tax
- $1,223 · $102/mo
- Projected year-2 tax
- $1,286 · $107/mo
- Expected delta
- +$63/yr (+$5/mo · 5.2%)
ⓘ Screening estimate from a state-policy table — verify with the county assessor before closing.
Climate risk First Street
- Flood 1/10 Low FEMA zone X (shaded) · 0% chance over 30 yrs
- Wildfire 1/10 Low
- Heat 10/10 Extreme 7 d/yr ≥105°F today · 27 d/yr by 30 yrs out
- Wind 10/10 Extreme 99% chance of damaging wind over 30 yrs
- Air quality 2/10 Low 2 unhealthy d/yr today · 2 by 30 yrs out
Nearby sold comps map
Loading sold comps map…
Walkable amenities ~0.75 mi
Loading nearby amenities…
Taxation est. · year 1
- Rental income
- $32,717
- − Mortgage interest
- −$8,682
- − Property taxes
- −$1,223
- − Insurance
- −$775
- − Repairs & maintenance
- −$2,617
- − Management
- −$2,617
- − Depreciation
- −$4,509
- Taxable income
- $12,292
- Est. tax owed @ 24.0%
- −$2,950
- After-tax cash flow
- $11,144/yr
For passive investors: Depreciation is non-cash, so a rental often shows a tax loss while cash-flowing — sheltering income. Rental losses are passive: they offset passive income freely, and up to $25,000/yr can offset ordinary (W-2) income if you actively participate and your MAGI is under $100k (phasing out to $0 by $150k); unused losses carry forward. On sale, claimed depreciation is recaptured at up to 25%, and gains may owe capital-gains tax (a 1031 exchange can defer both). Figures are a year-1 estimate at your 24.0% rate — not tax advice; consult a CPA.
Schools (NCES district)
- District
- Broward
- NCES district ID
- 1200180
- Math proficiency
- 42% ▼ -18.00%
- Reading proficiency
- 53% ▼ -5.00%
- Median HH income
- $52,139
- Composite
- 40.88/100
- National rank
- #3621
- State rank
- #46 of 73 in FL
Livability — Fort Lauderdale
- Score
- 82/100
- State rank
- #78
- US rank
- #1293
Category grades
Schools grade is shown separately in the Schools card above.
Census & demographics
- Census place
- Fort Lauderdale, FL
- County
- Broward County · 1,963,430 people
- City population
- 235,769
- Metro
- Miami-Fort Lauderdale-Pompano Beach, FL
- Population (ZIP)
- 74,898
- Household income
- $53,973
- Rent vs Own
- Severe rent burden
- 5068.0
Population outlook (Broward County) Hauer SSP2
- Today (2025)
- 2,207,033 people
- By 2030
- 2,360,704 · +7.0%
- By 2040
- 2,661,208 · +20.6%
- By 2050
- 2,946,698 · +33.5%
- By 2075
- 3,602,273 · +63.2%
- By 2100
- 3,970,984 · +79.9%
Race, ethnicity, and origin ACS 2023
- Neighborhood character
- Predominantly Black (77%)
- Race & ethnicity
- Black 77% Two or more races 9% White 9% Hispanic / Latino 9%
- Hispanic origin (detail)
- Mexican 1% Puerto Rican 2% Cuban 1%
- Common ancestry
- Hispanic 15% Lithuanian 1% Romanian 0%
- Foreign-born
- 24% · Canada, Jamaica
- Languages at home
- 78% English-only · French/Haitian/Cajun 14% Spanish 6% Other Indo-European 1%
Political lean MEDSL · Broward
- 2024 margin
- D (+17.0) · D 58.0% · R 41.0%
- 2008→2024 swing
- -17.8pp toward R · 2008: 34.7pp · 2024: 17.0pp
- All cycles
- 2024: D+17.0 2020: D+29.8 2016: D+35.0 2012: D+34.9 2008: D+34.7
Not yet ingested
- Civics
- —
Market trends
- HPI YoY
- ▼ -300.68%
- Current HPI
- 535.2504
- Rent YoY
- ▲ 2.78%
- Metro
- Miami-Fort Lauderdale-Pompano Beach, FL
- State GDP YoY
- ▲ 3.28%
- F500 in state
- 36
Industry mix (Fortune 500 HQ in FL)
| Industry | F500 HQs | Revenue |
|---|---|---|
| Industrial Technology | 2 | $29B |
|
||
| Insurance | 2 | $17B |
|
||
| Retail | 1 | $60B |
|
||
| Technology Distribution | 1 | $58B |
|
||
| Homebuilding | 1 | $35B |
|
||
| Technology Manufacturing | 1 | $35B |
|
||
Price history
+1130.2% since first listed5 events — show timeline
- 2026-04-25 Pending — MARMLS
- 2026-04-18 Contingent — MARMLS
- 2026-04-09 Listed $155,000 MARMLS
- 1978-06-01 Sold (Public Records) $28,000 Public Records
- 1965-08-01 Sold (Public Records) $12,600 Public Records
Property tax history
+3.1%/yrLatest (2025): $1,223 · +12.3% YoY. Source: county tax records.
Cash-flow waterfall
monthlySold comps — $/sqft
last 12 mo · ≤1 miLoading sold comps…