 🌊 Lakefront
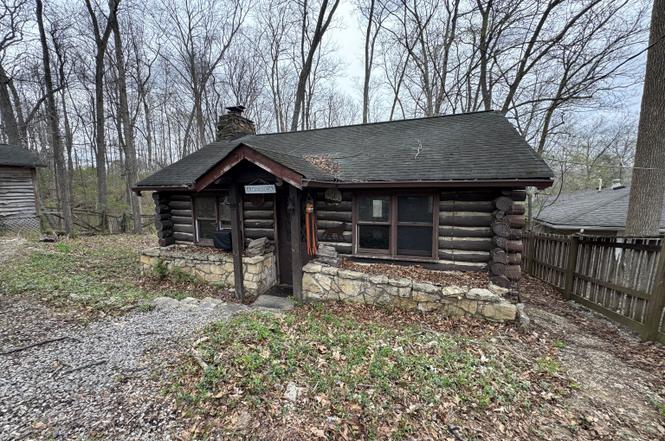
262 Hoover Dr · Prince's Lakes, IN
Flood risk 1/10 · Minimal
- FEMA flood zone
- X (unshaded)
- Chance of flooding over 30 yrs
- 0.0%
- Est. flood insurance / yr
- $507 – $1,088
Fire risk 1/10 · Minimal
- Est. fire insurance / yr
- $717 – $1,331
Heat risk 3/10 · Minor
- Hot days now (above 102°F)
- 7 days/yr
- Hot days in 30 yrs
- 19 days/yr
Wind risk 2/10 · Minimal
- Chance of severe wind over 30 yrs
- 1.0%
Air-quality risk 2/10 · Minimal
- Unhealthy air days now
- 1 days/yr
- Unhealthy air days in 30 yrs
- 2 days/yr
Risk factors via First Street. Map © Google.
Why this score? — see what drove the D grade
The composite is a weighted blend of 9 inputs, each scored 0–100. Each bar is that input's sub-score; the figure is the points it added to the 100-point composite (weight × sub-score).
- Cash flow +16.7/30.0
- ARV discount +7.5/15.0
- DSCR +5.2/10.0
- Schools +3.9/10.0
- 1% rule +3.2/10.0
- Rent growth +2.5/5.0
- Livability +2.5/5.0
- Condition / age +2.5/5.0
- Appreciation +0.0/10.0
$99,000
🖨 Deal sheet (PDF) 📄 Offer letter ✓ Due diligence
Listing remarks
Back on the market through no fault of seller or home! Rustic Lakefront Opportunity on Carolyn Lake in the Prince's Lake community. Bring your vision and creativity to this rustic log cabin bungalow shell. Set on three wooded lots totaling 1.67 acres, this property is ready for a total rehab and the chance to create your dream retreat. The barn is in great condition, ideal for projects, hobbies, or storing outdoor toys, while the additional shed offers flexible storage space. Surrounded by trees and nature, this setting provides the perfect backdrop for a weekend getaway or a full-time lakeside lifestyle. Home is conveniently located near the dog park and playground. Please be careful pulli
Key facts
- Rustic log cabin
- Three wooded lots
- Surrounded by trees
Tags
Property features AI
Exterior
- Parking: Detached 2-car garage
- Utilities: Public water; Septic system
- Home design: Single-family residence; One story
- Construction: Log construction; Slab foundation
- Exterior features: Approximately 1.67-acre lot (1–3 acres)
Interior
- Bedrooms: One bedroom on the main level
- Bathrooms: One full bathroom on the main level
- Heating & cooling: No heating; No cooling
- Interior features: Wood-burning fireplace; Appliances not included
Neighborhood map
What this means for you Summary
Snapshot
- This is a 1-bed/1.0-bath single-family listed at $99k.
Deal economics
- At list price, monthly cash flow is $61 ($735/yr) — positive.
- The deal already cash-flows at list — no discount required.
- To meet the 1% rule (rent ≥ 1% of price), the offer needs to be $81k (18.1% below list).
- Recommended offer: $81k (18.1% below list) — sets the bar for 1% rule.
Location & tenants
- Location reads: area grade D — affects rentability + tenant quality, not the cash-flow math above.
- Nineveh-Hensley-Jackson United (rural): math 41% / reading 48% proficiency, ranked #93 of 301 in IN (top 31%) — families likely to look elsewhere, expect single-tenant / working-renter base with shorter leases.
- Zoned schools: Indian Creek Elementary School (520 students, 39% FRL); Indian Creek Middle School (math 32% / reading 46%, grade F, #128 of 330 statewide, top 40%, 486 students, 35% FRL); Indian Creek Sr High School (math 37% / reading 67%, grade D+, #106 of 369 statewide, top 31%, 624 students, 30% FRL).
- Market conditions: 77 active listings in the ZIP; 1,133 units permitted in Johnson County in 2024 (0 in 5+ unit buildings).
Forward outlook
- Local home prices are declining (-3.0%/yr); year-one equity from $684 of loan paydown is wiped out by about $3k of value loss. Plan a longer hold.
- Johnson County population projected at +26% by 2050 — long-run rental-demand tailwind backs the buy-and-hold thesis.
Negotiation context
- It's been on market 282 days — a 12% lower offer ($87k) is reasonable based on typical stale-listing flexibility.
- 2 sale attempts; this cycle's ask has dropped $51k (34%) from the opening price — seller is motivated, your offer sets the floor, not the list.
Questions for the listing agent
- It's been on market 282 days. Have you received any prior offers? Is the seller open to a 18% concession, seller financing, or rate buy-down credit?
- Built in 1961 — when were the roof, HVAC, electrical panel, plumbing, and water heater last replaced?
- Why hasn't it sold? Are there any deal-killer items the seller is aware of (foundation, flood, title, zoning, code violations)?
- Is there a deadline driving the sale (1031 exchange, divorce, estate, relocation)? That informs how much negotiation room exists.
- The area grade is low — what's the realistic commute time and amenity access for the typical tenant pool here? Any planned neighborhood developments (good or bad) we should know about?
- This sits on a lake — are riparian / water-frontage rights deeded with the parcel? Any dock permits, shoreline easements, or HOA water-use restrictions?
- What's the documented flood / surge / shoreline-erosion history here (FEMA AND non-FEMA — e.g., storm surge, creek backup, septic-field saturation)?
- Any water-quality or seasonal algae-bloom issues that affect tenant satisfaction or short-term-rental demand?
- What's the average days-on-market for RENTAL listings here right now (not sales)? A rising rental-DOM trend means longer vacancies and softer asking-rent achievability than the comps imply.
- What's the recent tenant-quality profile in this submarket — average credit score on applications, eviction rate, late-payment / NSF rate, and stable-employment percentage? A property-management company in the area should have these aggregated.
- How much new for-sale + rental construction is in the pipeline within 1–3 miles? Heavy new supply typically softens prices + rents 12–24 months out; constrained supply supports both.
Investment metrics
- 1% rule
- 0.82% ✗
- Cap rate
- 7.04%
- Cash-on-cash
- 2.65%
- DSCR
- 1.12
- GRM
- 10.2
CMA / ARV
- ARV (on-the-fly)
- $264,627
- Comps found
- 5
Show comp detail 5 sales within ~0.75 mi
| Address | Dist | Beds/Ba | Sqft | Sold | Price | $/sf | Match |
|---|---|---|---|---|---|---|---|
| 304 E Hoover Dr | 0.05mi | 2/1.0 (+1) | 725 (+10%) | 9mo | $215,000 | $297 | 68 |
| 8421 S Kinman Dr | 0.71mi | 2/1.0 (+1) | 668 (+1%) | 6mo | $280,000 | $419 | 55 |
| 8657 S Nash Dr | 0.54mi | 1/1.0 | 736 (+12%) | 13mo | $200,000 | $272 | 45 |
| 8726 S Slevins Dr | 0.70mi | 2/1.0 (+1) | 660 (0%) | 23mo | $301,990 | $458 | 43 |
| 8644 S Kinman Dr | 0.62mi | 2/1.0 (+1) | 576 (-13%) | 13mo | $148,000 | $257 | 34 |
Match score weights: distance 35% · size 25% · config 20% · recency 20%. Top-matched comps best support the ARV.
Projected returns pro-forma
-3.0% appreciation · 3.0% rent growth · sell at horizon
- IRR
- -12.2%
- Equity multiple
- 0.56×
- Total profit
- $-12,194
- Equity at exit
- $14,761
- IRR
- -3.1%
- Equity multiple
- 0.79×
- Total profit
- $-5,809
- Equity at exit
- $8,560
Cash invested: $27,720 (down + closing). Projections, not guarantees.
Landlord ↔ Tenant lean methodology
- Overall (STATE)
- 90 Strongly Landlord-Friendly
- State Indiana
- 90 Strongly Landlord-Friendly · R+11
- County
- — inherits STATE
- City
- — inherits STATE
ZIP-level market 46164
- Active inventory
- 77
- Price-to-rent
- 10.2×
Monthly cashflow live
- Estimated rent
- $811 medium interval (Pro) →
- Mortgage (P&I)
- −$519
- Tax from tax record
- −$19 /mo · $228/yr
- Insurance
- −$41
- HOA
- −$0
- Vacancy / Maint / Mgmt
- −$170
- Net cashflow
- $61
Break-even live
Sensitivity live
| Price | -10% $117 | -5% $89 | +0% $61 | +5% $33 | +10% $5 |
|---|---|---|---|---|---|
| Rent | -10% $-3 | -5% $29 | +0% $61 | +5% $93 | +10% $125 |
| Rate | -1.0pp $111 | -0.5pp $86 | base $61 | +0.5pp $36 | +1.0pp $9 |
UW: 25.0% down · 7.5% · 30yr · 1.5% tax · 5.0% vac · 8.0% maint · 8.0% mgmt
Financing live
Cash to close
- Down payment
- $24,750
- Closing costs
- $2,970
- Reserves months
- —
- Total cash needed
- —
Loan-product check · same deal, 3 products live
Conventional
25% down · 7.5% · 30yr
- Down + closing
- —
- Monthly P&I
- —
- Monthly cashflow
- —
- DSCR
- —
- Eligible?
- —
Personal DTI + credit; lowest rate.
DSCR
20% down · 8.5% · 30yr
- Down + closing
- —
- Monthly P&I
- —
- Monthly cashflow
- —
- DSCR
- —
- Eligible?
- —
No personal income docs; deal must DSCR.
Hard money
10% down · 12.0% · 12mo
- Down + closing
- —
- Monthly P&I
- —
- Monthly cashflow
- —
- DSCR
- —
- Eligible?
- —
Short-term bridge; refi at stabilization.
Listing history 22 events
-
2026-06-21days on market $99,000 Active 282 DOM
-
2026-06-18days on market $99,000 Active 279 DOM
-
2026-06-17days on market $99,000 Active 278 DOM
-
2026-06-16days on market $99,000 Active 277 DOM
-
2026-06-15days on market $99,000 Active 276 DOM
-
2026-06-13days on market $99,000 Active 274 DOM
-
2026-06-09days on market $99,000 Active 270 DOM
-
2026-06-08days on market $99,000 Active 269 DOM
-
2026-06-07days on market $99,000 Active 268 DOM
-
2026-06-03days on market $99,000 Active 264 DOM
-
2026-06-02days on market $99,000 Active 263 DOM
-
2026-06-01days on market $99,000 Active 262 DOM
-
2026-05-31days on market $99,000 Active 261 DOM
-
2026-05-18status Active
-
2026-04-30status Pending
-
2026-04-18price $99,000
-
2026-04-01price $109,000
-
2026-01-09price $119,000
-
2025-12-04price $129,000
-
2025-11-08price $139,000
-
2025-10-14price $145,000
-
2025-08-23$150,000 Active
ⓘ Source: listings_history table (triggers on properties + properties_extension) + one-shot
backfill from property_details.listing_events for pre-trigger history.
Tax reassessment forecast IN · Partial reset (capped growth)
- Current annual tax
- $228 · $19/mo
- Projected year-2 tax
- $535 · $45/mo
- Expected delta
- +$307/yr (+$26/mo · 134.4%)
ⓘ Screening estimate from a state-policy table — verify with the county assessor before closing.
Climate risk First Street
- Flood 1/10 Low FEMA zone X (unshaded) · 0% chance over 30 yrs
- Wildfire 1/10 Low
- Heat 3/10 Moderate 7 d/yr ≥102°F today · 19 d/yr by 30 yrs out
- Wind 2/10 Low 100% chance of damaging wind over 30 yrs
- Air quality 2/10 Low 1 unhealthy d/yr today · 2 by 30 yrs out
Nearby sold comps map
Loading sold comps map…
Walkable amenities ~0.75 mi
Loading nearby amenities…
Taxation est. · year 1
- Rental income
- $9,732
- − Mortgage interest
- −$5,546
- − Property taxes
- −$228
- − Insurance
- −$495
- − Repairs & maintenance
- −$779
- − Management
- −$779
- − Depreciation
- −$2,880
- Taxable loss
- −$974
- Est. tax savings @ 24.0%
- +$234
- After-tax cash flow
- $969/yr
For passive investors: Depreciation is non-cash, so a rental often shows a tax loss while cash-flowing — sheltering income. Rental losses are passive: they offset passive income freely, and up to $25,000/yr can offset ordinary (W-2) income if you actively participate and your MAGI is under $100k (phasing out to $0 by $150k); unused losses carry forward. On sale, claimed depreciation is recaptured at up to 25%, and gains may owe capital-gains tax (a 1031 exchange can defer both). Figures are a year-1 estimate at your 24.0% rate — not tax advice; consult a CPA.
Schools (NCES district)
- District
- Nineveh-Hensley-Jackson United
- NCES district ID
- 1807620
- Math proficiency
- 41% ▼ -12.00%
- Reading proficiency
- 48% ▼ -10.00%
- Median HH income
- $59,040
- Composite
- 39.07/100
- National rank
- #4053
- State rank
- #93 of 301 in IN
Livability — Prince's Lakes
No livability data for this city. (Only ~50 U.S. cities are tracked.)
Census & demographics
- Census place
- Prince's Lakes, IN
- Population (ZIP)
- 3,991
Population outlook (Johnson County) Hauer SSP2
- Today (2025)
- 170,080 people
- By 2030
- 179,983 · +5.8%
- By 2040
- 198,580 · +16.8%
- By 2050
- 214,661 · +26.2%
- By 2075
- 247,990 · +45.8%
- By 2100
- 257,821 · +51.6%
Race, ethnicity, and origin ACS 2023
- Neighborhood character
- Predominantly White (96%)
- Race & ethnicity
- White 96% Two or more races 2% Pacific Islander 1%
- Common ancestry
- Romanian 3% Lithuanian 2% Slovak 2%
- Foreign-born
- 1% · Canada
- Languages at home
- 98% English-only · Spanish 2%
Political lean MEDSL · Johnson
- 2024 margin
- Solid R (+34.3) · D 32.0% · R 66.3% · Other 1.7%
- 2008→2024 swing
- -8.9pp toward R · 2008: -25.5pp · 2024: -34.3pp
- All cycles
- 2024: R+34.3 2020: R+34.1 2016: R+42.5 2012: R+38.5 2008: R+25.5
Not yet ingested
- Civics
- —
Market trends
- HPI YoY
- ▼ -129.89%
- Current HPI
- 218.3894
- Rent YoY
- —
- Metro
- —
- State GDP YoY
- ▲ 2.90%
- F500 in state
- 18
Industry mix (Fortune 500 HQ in IN)
| Industry | F500 HQs | Revenue |
|---|---|---|
| Industrial Machinery | 2 | $37B |
|
||
| Healthcare | 1 | $177B |
|
||
| Pharmaceuticals | 1 | $45B |
|
||
| Metals / Steel | 1 | $18B |
|
||
| Agriculture | 1 | $17B |
|
||
| Packaging | 1 | $12B |
|
||
Price history
-34.0% since first listed9 events — show timeline
- 2026-05-18 Relisted — MIBOR as Distributed by MLS Grid
- 2026-04-30 Pending — MIBOR as Distributed by MLS Grid
- 2026-04-18 Price Changed $99,000 MIBOR as Distributed by MLS Grid
- 2026-04-01 Price Changed $109,000 MIBOR as Distributed by MLS Grid
- 2026-01-09 Price Changed $119,000 MIBOR as Distributed by MLS Grid
- 2025-12-04 Price Changed $129,000 MIBOR as Distributed by MLS Grid
- 2025-11-08 Price Changed $139,000 MIBOR as Distributed by MLS Grid
- 2025-10-14 Price Changed $145,000 MIBOR as Distributed by MLS Grid
- 2025-08-23 Listed $150,000 MIBOR as Distributed by MLS Grid
Property tax history
+41.7%/yrLatest (2024): $228 · -5.7% YoY. Source: county tax records.
Cash-flow waterfall
monthlySold comps — $/sqft
last 12 mo · ≤1 miLoading sold comps…