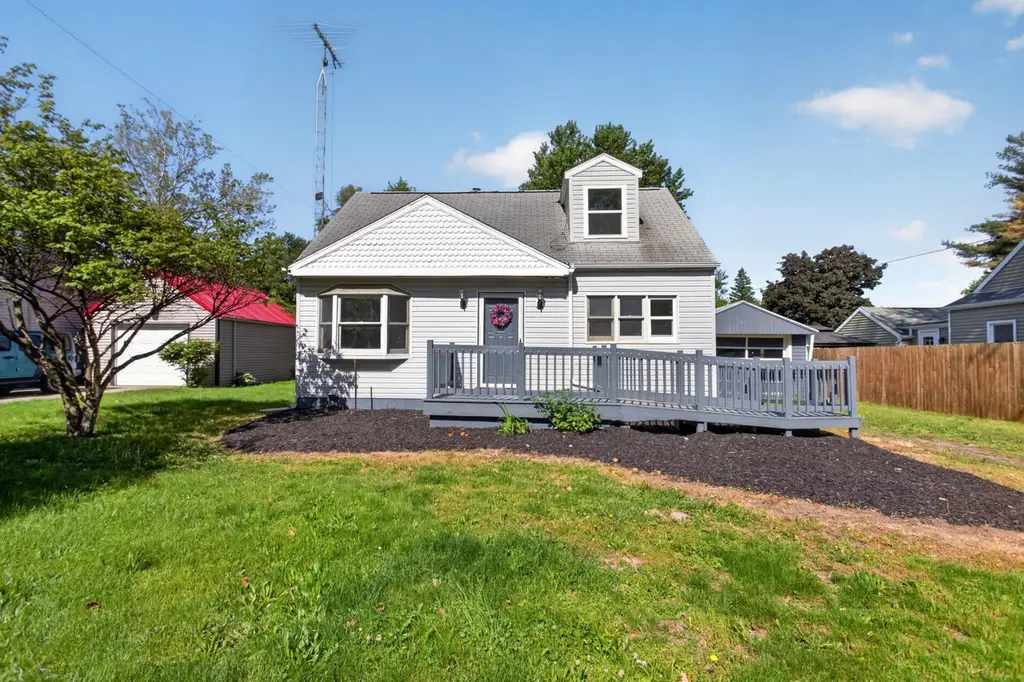
3320 Treat St · Adrian, MI
Flood risk 1/10 · Minimal
- FEMA flood zone
- X (unshaded)
- Chance of flooding over 30 yrs
- 0.0%
- Est. flood insurance / yr
- $473 – $860
Fire risk 3/10 · Minor
- Est. fire insurance / yr
- $784 – $1,456
Heat risk 3/10 · Minor
- Hot days now (above 98°F)
- 7 days/yr
- Hot days in 30 yrs
- 16 days/yr
Wind risk 2/10 · Minimal
- Chance of severe wind over 30 yrs
- —
Air-quality risk 2/10 · Minimal
- Unhealthy air days now
- 1 days/yr
- Unhealthy air days in 30 yrs
- 1 days/yr
Risk factors via First Street. Map © Google.
Why this score? — see what drove the D+ grade
The composite is a weighted blend of 9 inputs, each scored 0–100. Each bar is that input's sub-score; the figure is the points it added to the 100-point composite (weight × sub-score).
- Cash flow +15.9/30.0
- ARV discount +11.4/15.0
- DSCR +4.9/10.0
- 1% rule +3.6/10.0
- Schools +3.5/10.0
- Livability +3.5/5.0
- Rent growth +2.5/5.0
- Condition / age +2.5/5.0
- Appreciation +0.0/10.0
$189,900
🖨 Deal sheet (PDF) 📄 Offer letter ✓ Due diligence
Listing remarks MLS
Nicely updated Cape Cod offers large updated kitchen with island, dining room, living room, 4 bedrooms, 1 full updated bathroom, main level laundry and partial basement. House updated throughout with new flooring and paint. Deck overlooks fenced rear yard. Detached 1.5 car garage. Located in desirable Madison School District. Wheelchair accessible.
Key facts
- Updated kitchen
- Fenced rear yard
- 0.23 acre lot
Tags
Property features AI
Exterior
- Parking: Detached garage; 1.5 garage spaces
- Utilities: Public water
- Home design: Cape Cod-style single family residence; Residential property
- Construction: Built in 1950; Asphalt shingle roof
- Exterior features: 0.23-acre lot; Vinyl siding
Interior
- Kitchen: Dishwasher; Oven; Refrigerator
- Bathrooms: 1 full bathroom
- Heating & cooling: Forced air heating; Has cooling
- Interior features: Ramped entrance; Partial basement; 7 total rooms
- Laundry & utility: Natural gas water heater
Neighborhood map
What this means for you Summary
Snapshot
- This is a 4-bed/1.0-bath single-family listed at $190k.
Deal economics
- At list price, monthly cash flow is $91 ($1k/yr) — positive.
- The deal already cash-flows at list — no discount required.
- To meet the 1% rule (rent ≥ 1% of price), the offer needs to be $163k (14.1% below list).
- Recommended offer: $163k (14.1% below list) — sets the bar for 1% rule.
- Cap rate 6.9% vs local median 5.6% in Adrian — meaningfully above typical; check what's discounted (condition, days-on-market, listing class) to confirm the premium yield is real.
Location & tenants
- Location reads 69/100 on livability (#342 in MI) — a middle-class / working-renter tenant base. Strengths: cost of living A+, housing A+, health & safety A+; Watch: amenities D, crime F, commute F.
- Madison School District (Lenawee) (town): math 34% / reading 51% proficiency, ranked #195 of 540 in MI (top 36%) — families likely to look elsewhere, expect single-tenant / working-renter base with shorter leases.
- Zoned schools: Madison Elementary School (math 34% / reading 47%, grade F, #592 of 1,397 statewide, top 43%, 808 students, 73% FRL); Madison Middle School (math 36% / reading 53%, grade D, #169 of 493 statewide, top 35%, 380 students, 62% FRL); Madison High School (math 27% / reading 57%, grade F, #264 of 713 statewide, top 41%, 445 students, 52% FRL).
- Market conditions: 212 active listings in the ZIP; 137 units permitted in Lenawee County in 2024 (0 in 5+ unit buildings).
Forward outlook
- Local home prices are declining (-3.0%/yr); year-one equity from $1k of loan paydown is wiped out by about $6k of value loss. Plan a longer hold.
- Lenawee County population projected at -18% by 2050 — secular population decline; favor cash flow + early exit over multi-decade hold.
Negotiation context
- Only 5 days on market — expect competitive offers; lowballing is unlikely to land.
- 8 sale attempts since 8y ago with the ask held roughly flat each time — persistent listings suggest the price (not the market) is what's stuck; bring a comps-based counter.
Risks & watch-outs
- Watch-outs: built in 1950 — expect roof / HVAC / electrical / plumbing capex.
Questions for the listing agent
- Built in 1950 — when were the roof, HVAC, electrical panel, plumbing, and water heater last replaced?
- Is there a deadline driving the sale (1031 exchange, divorce, estate, relocation)? That informs how much negotiation room exists.
- Crime grade is F in this area — have there been break-ins, vandalism, or insurance claims at this property in the last 3 years? What carrier currently insures it and at what premium?
- The area grade is low — what's the realistic commute time and amenity access for the typical tenant pool here? Any planned neighborhood developments (good or bad) we should know about?
- What's the average days-on-market for RENTAL listings here right now (not sales)? A rising rental-DOM trend means longer vacancies and softer asking-rent achievability than the comps imply.
- What's the recent tenant-quality profile in this submarket — average credit score on applications, eviction rate, late-payment / NSF rate, and stable-employment percentage? A property-management company in the area should have these aggregated.
- How much new for-sale + rental construction is in the pipeline within 1–3 miles? Heavy new supply typically softens prices + rents 12–24 months out; constrained supply supports both.
Investment metrics
- 1% rule
- 0.86% ✗
- Cap rate
- 6.87%
- Cash-on-cash
- 2.06%
- DSCR
- 1.09
- GRM
- 9.7
CMA / ARV
- ARV (on-the-fly)
- $207,900
- Comps found
- 9
Show comp detail 9 sales within ~0.75 mi
| Address | Dist | Beds/Ba | Sqft | Sold | Price | $/sf | Match |
|---|---|---|---|---|---|---|---|
| 2156 Adams St | 0.13mi | 3/2.0 (-1) | 1,228 (-2%) | 7mo | $170,000 | $138 | 75 |
| 2094 Allan St | 0.15mi | 4/1.0 | 1,434 (+14%) | 0mo | $180,000 | $126 | 70 |
| 1999 Harold St | 0.23mi | 4/1.5 | 1,330 (+6%) | 10mo | $220,000 | $165 | 70 |
| 2019 Harold St | 0.22mi | 4/1.5 | 1,095 (-13%) | 13mo | $179,000 | $163 | 55 |
| 1894 Harold St | 0.37mi | 3/2.0 (-1) | 1,376 (+9%) | 8mo | $280,000 | $203 | 52 |
| 1897 Allan St | 0.36mi | 3/2.0 (-1) | 1,440 (+14%) | 1mo | $250,000 | $174 | 49 |
| 3641 Countryside Dr | 0.43mi | 3/2.5 (-1) | 1,080 (-14%) | 11mo | $225,000 | $208 | 36 |
| 2100 Homestead Ln | 0.35mi | 3/3.5 (-1) | 1,444 (+15%) | 14mo | $190,000 | $132 | 33 |
| 1822 Harold St | 0.47mi | 3/3.0 (-1) | 1,416 (+12%) | 23mo | $299,000 | $211 | 25 |
Match score weights: distance 35% · size 25% · config 20% · recency 20%. Top-matched comps best support the ARV.
Projected returns pro-forma
-3.0% appreciation · 3.0% rent growth · sell at horizon
- IRR
- -13.1%
- Equity multiple
- 0.53×
- Total profit
- $-25,005
- Equity at exit
- $28,315
- IRR
- -4.1%
- Equity multiple
- 0.73×
- Total profit
- $-14,477
- Equity at exit
- $16,419
Cash invested: $53,172 (down + closing). Projections, not guarantees.
Landlord ↔ Tenant lean methodology
- Overall (STATE)
- 62 Landlord-Friendly
- State Michigan
- 62 Landlord-Friendly · EVEN
- County
- — inherits STATE
- City
- — inherits STATE
ZIP-level market 49221
- Active inventory
- 212
- Price-to-rent
- 9.7×
Monthly cashflow live
- Estimated rent
- $1,631 medium interval (Pro) →
- Mortgage (P&I)
- −$996
- Tax from tax record
- −$122 /mo · $1,469/yr
- Insurance
- −$79
- HOA
- −$0
- Vacancy / Maint / Mgmt
- −$343
- Net cashflow
- $91
Break-even live
Sensitivity live
| Price | -10% $199 | -5% $145 | +0% $91 | +5% $38 | +10% $-16 |
|---|---|---|---|---|---|
| Rent | -10% $-38 | -5% $27 | +0% $91 | +5% $156 | +10% $220 |
| Rate | -1.0pp $187 | -0.5pp $140 | base $91 | +0.5pp $42 | +1.0pp $-8 |
UW: 25.0% down · 7.5% · 30yr · 1.5% tax · 5.0% vac · 8.0% maint · 8.0% mgmt
Financing live
Cash to close
- Down payment
- $47,475
- Closing costs
- $5,697
- Reserves months
- —
- Total cash needed
- —
Loan-product check · same deal, 3 products live
Conventional
25% down · 7.5% · 30yr
- Down + closing
- —
- Monthly P&I
- —
- Monthly cashflow
- —
- DSCR
- —
- Eligible?
- —
Personal DTI + credit; lowest rate.
DSCR
20% down · 8.5% · 30yr
- Down + closing
- —
- Monthly P&I
- —
- Monthly cashflow
- —
- DSCR
- —
- Eligible?
- —
No personal income docs; deal must DSCR.
Hard money
10% down · 12.0% · 12mo
- Down + closing
- —
- Monthly P&I
- —
- Monthly cashflow
- —
- DSCR
- —
- Eligible?
- —
Short-term bridge; refi at stabilization.
Listing history 4 events
-
2026-06-07statusdays on market $189,900 Pending 5 DOM
-
2026-06-05days on market $189,900 Active 3 DOM
-
2026-06-03remarks 350-char remark
-
2026-06-03$189,900 Active 1 DOM
ⓘ Source: listings_history table (triggers on properties + properties_extension) + one-shot
backfill from property_details.listing_events for pre-trigger history.
Tax reassessment forecast MI · Partial reset (capped growth)
- Current annual tax
- $1,469 · $122/mo
- Projected year-2 tax
- $2,197 · $183/mo
- Expected delta
- +$728/yr (+$61/mo · 49.5%)
ⓘ Screening estimate from a state-policy table — verify with the county assessor before closing.
Climate risk First Street
- Flood 1/10 Low FEMA zone X (unshaded) · 0% chance over 30 yrs
- Wildfire 3/10 Moderate
- Heat 3/10 Moderate 7 d/yr ≥98°F today · 16 d/yr by 30 yrs out
- Wind 2/10 Low
- Air quality 2/10 Low 1 unhealthy d/yr today · 1 by 30 yrs out
Nearby sold comps map
Loading sold comps map…
Walkable amenities ~0.75 mi
Loading nearby amenities…
Taxation est. · year 1
- Rental income
- $19,575
- − Mortgage interest
- −$10,637
- − Property taxes
- −$1,469
- − Insurance
- −$950
- − Repairs & maintenance
- −$1,566
- − Management
- −$1,566
- − Depreciation
- −$5,524
- Taxable loss
- −$2,138
- Est. tax savings @ 24.0%
- +$513
- After-tax cash flow
- $1,608/yr
For passive investors: Depreciation is non-cash, so a rental often shows a tax loss while cash-flowing — sheltering income. Rental losses are passive: they offset passive income freely, and up to $25,000/yr can offset ordinary (W-2) income if you actively participate and your MAGI is under $100k (phasing out to $0 by $150k); unused losses carry forward. On sale, claimed depreciation is recaptured at up to 25%, and gains may owe capital-gains tax (a 1031 exchange can defer both). Figures are a year-1 estimate at your 24.0% rate — not tax advice; consult a CPA.
Schools (NCES district)
- District
- Madison School District (Lenawee)
- NCES district ID
- 2622320
- Math proficiency
- 34% ▼ -10.00%
- Reading proficiency
- 51% ▼ -5.00%
- Median HH income
- $37,961
- Composite
- 35.35/100
- National rank
- #4959
- State rank
- #195 of 540 in MI
Livability — Adrian
- Score
- 69/100
- State rank
- #342
- US rank
- #8722
Category grades
Schools grade is shown separately in the Schools card above.
Census & demographics
- City population
- 41,041
- Population (ZIP)
- 41,041
Population outlook (Lenawee County) Hauer SSP2
- Today (2025)
- 95,497 people
- By 2030
- 92,722 · -2.9%
- By 2040
- 85,641 · -10.3%
- By 2050
- 77,971 · -18.4%
- By 2075
- 60,043 · -37.1%
- By 2100
- 41,468 · -56.6%
Race, ethnicity, and origin ACS 2023
- Neighborhood character
- Predominantly White (77%)
- Race & ethnicity
- White 77% Hispanic / Latino 14% Two or more races 8% Black 4%
- Hispanic origin (detail)
- Mexican 12%
- Common ancestry
- Romanian 3% Lithuanian 3% Italian 2%
- Foreign-born
- 3% · Canada
- Languages at home
- 93% English-only · Spanish 6% Arabic 1%
Political lean MEDSL · Lenawee
- 2024 margin
- Strong R (+23.0) · D 37.8% · R 60.8% · Other 1.4%
- 2008→2024 swing
- -28.1pp toward R · 2008: 5.1pp · 2024: -23.0pp
- All cycles
- 2024: R+23.0 2020: R+19.9 2016: R+21.1 2012: R+1.3 2008: D+5.1
Not yet ingested
- Civics
- —
Market trends
- HPI YoY
- ▼ -143.64%
- Current HPI
- 237.3796
- Rent YoY
- —
- Metro
- —
- State GDP YoY
- ▲ 1.37%
- F500 in state
- 28
Industry mix (Fortune 500 HQ in MI)
| Industry | F500 HQs | Revenue |
|---|---|---|
| Automotive Parts | 3 | $48B |
|
||
| Automotive | 2 | $372B |
|
||
| Chemicals | 1 | $45B |
|
||
| Automotive Retail | 1 | $29B |
|
||
| Healthcare / Medical Devices | 1 | $23B |
|
||
| Automotive Technology | 1 | $20B |
|
||
Price history
+72.8% since first listed16 events — show timeline
- 2026-06-02 Listed $189,900 SW Michigan MLS
- 2026-06-02 Listed $189,900 REALCOMP
- 2026-06-02 Listed $189,900 MiRealSource-MiMLS
- 2019-07-16 Listing Removed — REALCOMP
- 2019-07-16 Listing Removed — MiRealSource-MiMLS
- 2019-02-09 Price Changed $119,900 MiRealSource-MiMLS
- 2019-01-15 Listed $99,900 MiRealSource-MiMLS
- 2019-01-15 Listed $119,900 REALCOMP
- 2018-09-15 Listing Removed — MiRealSource-MiMLS
- 2018-09-15 Listing Removed — REALCOMP
- 2018-08-31 Price Changed $109,900 MiRealSource-MiMLS
- 2018-08-30 Relisted — MiRealSource-MiMLS
- 2018-06-23 Contingent — MiRealSource-MiMLS
- 2018-05-25 Price Changed $94,900 MiRealSource-MiMLS
- 2018-05-08 Listed $99,900 MiRealSource-MiMLS
- 2018-05-08 Listed $109,900 REALCOMP
Property tax history
-0.8%/yrLatest (2025): $1,469 · -43.3% YoY. Source: county tax records.
Cash-flow waterfall
monthlySold comps — $/sqft
last 12 mo · ≤1 miLoading sold comps…