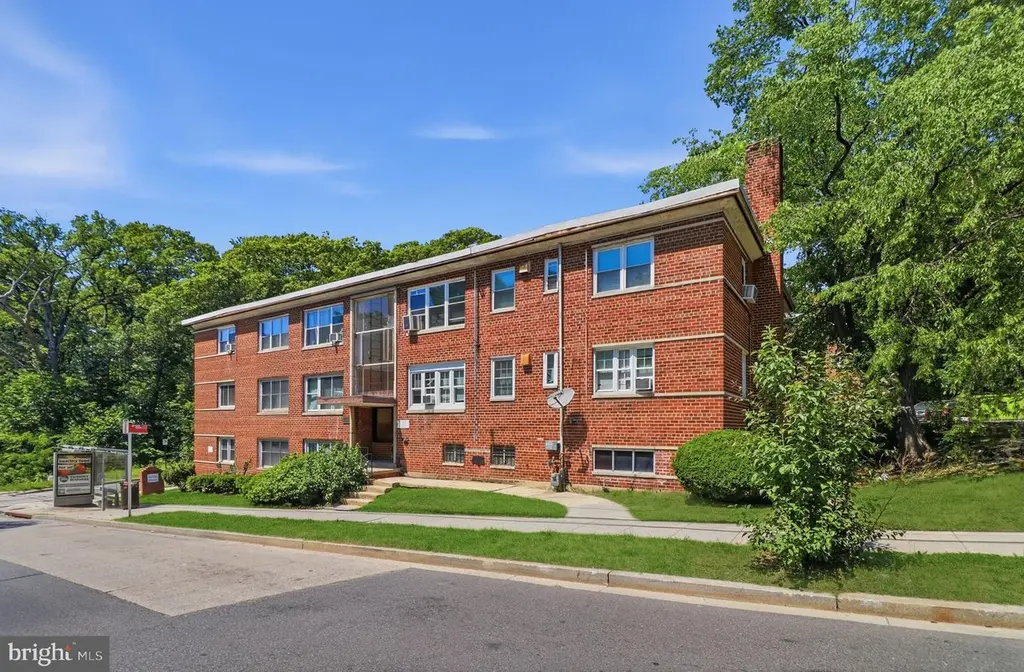
2400 Marion Barry Ave SE #102 · Washington, DC
Flood risk 7/10 · Major
- FEMA flood zone
- X (unshaded)
- Chance of flooding over 30 yrs
- 0.78%
- Est. flood insurance / yr
- $507 – $1,088
Fire risk 1/10 · Minimal
- Est. fire insurance / yr
- $631 – $1,173
Heat risk 7/10 · Major
- Hot days now (above 104°F)
- 7 days/yr
- Hot days in 30 yrs
- 14 days/yr
Wind risk 4/10 · Minor
- Chance of severe wind over 30 yrs
- 18.0%
Air-quality risk 4/10 · Minor
- Unhealthy air days now
- 4 days/yr
- Unhealthy air days in 30 yrs
- 5 days/yr
Risk factors via First Street. Map © Google.
Why this score? — see what drove the B grade
The composite is a weighted blend of 9 inputs, each scored 0–100. Each bar is that input's sub-score; the figure is the points it added to the 100-point composite (weight × sub-score).
- Cash flow +30.0/30.0
- 1% rule +10.0/10.0
- DSCR +10.0/10.0
- ARV discount +7.5/15.0
- Livability +3.7/5.0
- Schools +3.6/10.0
- Rent growth +3.5/5.0
- Condition / age +2.5/5.0
- Appreciation +0.0/10.0
$120,000
🖨 Deal sheet 📄 Offer letter ✓ Due diligence
Listing remarks
EXTREMELY LARGE 3-bedroom, 1-bath condo with all utilities included in the condo fee. Sold AS-IS. Conveniently located on a major bus route right outside the front door and just two blocks from shopping and retail. Easy access to 295, 495, and 395. Parking available in the rear and laundry facilities on site. Rare find with exceptional space and convenience. Excellent investment opportunity — the property previously rented for $2,296.00 per month.
Key facts
- $616 HOA
- Built 1940
- Listed 36 days
Property features AI
Finance
- Other: Condominium ownership; Finished above-grade area approximately 1,051 (source: assessor)
- HOA & community: Condo fee approximately $560 per month; Condo fee covers air conditioning, common area maintenance, electricity, gas, heat, management, snow removal, trash, water and other services; Pets allowed (dogs and cats)
Exterior
- Parking: On-street parking; Off-street parking
- Utilities: Public water; Public sewer; Natural gas for heat and hot water; Electric for cooling
- Home design: Condominium unit / flat; Entry level: 1
- Construction: Brick construction
- Exterior features: Garden-style building (1–4 floors); Common grounds; Above-grade and below-grade structures
Interior
- Kitchen: Galley kitchen (appliances not specified)
- Bedrooms: Three bedrooms on the main level
- Bathrooms: One full bathroom (main level)
- Heating & cooling: Radiator heating; Ceiling fans; Window air conditioning units; Electric cooling fuel; Natural gas hot water
- Interior features: Galley kitchen; Traditional floor plan
- Laundry & utility: No washer/dryer hookup in unit
Neighborhood map
What this means for you Summary
Snapshot
- This is a 3-bed/1.0-bath condo listed at $120k.
Deal economics
- At list price, monthly cash flow is $417 ($5k/yr) — positive.
- The deal already cash-flows at list — no discount required.
- Meets the 1% rule at list price ($2k rent vs $120k).
- Recommended offer: $116k (3.0% below list) — sets the bar for market timing.
- Cap rate 11.1% vs local median 2.5% in Washington — top-decile yield for the area; either an underpriced asset or a hidden risk that comps aren't pricing in. Stress-test before assuming the spread holds.
Location & tenants
- Location reads 73/100 on livability (#1 in DC) — a middle-class / working-renter tenant base. Strengths: amenities A+, commute A+, employment A+; Watch: crime F, cost of living F.
- District Of Columbia Public Schools (urban): math 33% / reading 40% proficiency, ranked #8 of 32 in DC (top 25%) — families likely to look elsewhere, expect single-tenant / working-renter base with shorter leases; 65% free/reduced lunch — lower-income household profile, screen leases tightly.
- Market conditions: Rents rising (+3.9%/yr); 296 active listings in the ZIP; 40 comparable units currently listed for rent nearby; rentals at typical pace (median 25d on market — plan ~3-4 weeks tenant-placement turnaround); 1,737 units permitted in District of Columbia in 2024 (1,506 in 5+ unit buildings).
- At $2,346/mo this rent would consume 52% of the median local household income ($54k/yr) (locally 5148% of renters already pay >50% of income on rent) — very limited rent-growth headroom before tenants either downsize or default.
Forward outlook
- Local home prices are declining (-3.0%/yr); year-one equity from $830 of loan paydown is wiped out by about $4k of value loss. Plan a longer hold.
- District of Columbia County population projected at +50% by 2050 — long-run rental-demand tailwind backs the buy-and-hold thesis.
- At projected returns (-3.0% appreciation + 3.9% rent growth), your $34k cash investment doubles in ~8 years — after that, you're playing with house money.
Negotiation context
- It's been on market 37 days — a 3% lower offer ($116k) is reasonable based on typical stale-listing flexibility.
- 4 sale attempts since 18y ago; this cycle's ask has dropped $29k (19%) from the opening price — seller is motivated, your offer sets the floor, not the list.
- Current owner paid $47k; list at $120k implies a 154% gain — meaningful room to come down on a strong offer.
Risks & watch-outs
- Watch-outs: flood insurance adds $66/mo; HOA is 26% of rent; built in 1940 — expect roof / HVAC / electrical / plumbing capex.
- Climate carrying-cost: major flood risk; extreme-heat days projected 7→14/yr by 2055 (HVAC capex compounding) — expect insurance premiums to compound above CPI over the hold.
Questions for the listing agent
- It's been on market 37 days. Have you received any prior offers? Is the seller open to a 3% concession, seller financing, or rate buy-down credit?
- Built in 1940 — when were the roof, HVAC, electrical panel, plumbing, and water heater last replaced?
- What's the actual annual flood-insurance premium (NFIP or private), and is the property in a SFHA with mandatory coverage?
- What does the HOA fee cover, when was the last increase, and are there any pending special assessments or reserve-fund shortfalls?
- Any open or pending special assessments — roof, HVAC, plumbing, elevator, façade? What's the per-unit balance and payoff schedule, and is the seller paying it off at close or rolling it to the buyer?
- Is there a deadline driving the sale (1031 exchange, divorce, estate, relocation)? That informs how much negotiation room exists.
- Crime grade is F in this area — have there been break-ins, vandalism, or insurance claims at this property in the last 3 years? What carrier currently insures it and at what premium?
- What's the average days-on-market for RENTAL listings here right now (not sales)? A rising rental-DOM trend means longer vacancies and softer asking-rent achievability than the comps imply.
- What's the recent tenant-quality profile in this submarket — average credit score on applications, eviction rate, late-payment / NSF rate, and stable-employment percentage? A property-management company in the area should have these aggregated.
- How much new apartment / multifamily construction is in the pipeline within 1–3 miles? Heavy new supply (>2% of stock underway) typically softens rents 12–24 months out; light construction supports rent growth.
Investment metrics
- 1% rule
- 1.96% ✓
- Cap rate
- 11.13%
- Cash-on-cash
- 17.28%
- DSCR
- 1.77
- GRM
- 4.3
CMA / ARV
No comps found within radius.
Projected returns pro-forma
-3.0% appreciation · 3.86% rent growth · sell at horizon
- IRR
- 7.2%
- Equity multiple
- 1.29×
- Total profit
- $9,590
- Equity at exit
- $17,892
- IRR
- 17.8%
- Equity multiple
- 2.57×
- Total profit
- $52,786
- Equity at exit
- $10,375
Cash invested: $33,600 (down + closing). Projections, not guarantees.
Landlord ↔ Tenant lean methodology
- Overall (CITY)
- 0 Strongly Tenant-Friendly
- State District of Columbia
- 12 Strongly Tenant-Friendly · D+43
- County
- — inherits STATE
- City Washington
- 0 Strongly Tenant-Friendly · D+43
ZIP-level market 20020
- Rents YoY
- 3.9%
- Active inventory
- 296
- Price-to-rent
- 4.3×
Monthly cashflow live
- Estimated rent
- $2,346 high interval (Pro) →
- Mortgage (P&I)
- −$629
- Tax from tax record
- −$75 /mo · $895/yr
- Insurance
- −$50
- Flood insurance flood zone
- −$66 /mo · $798/yr
- HOA
- −$616
- Vacancy / Maint / Mgmt
- −$493
- Net cashflow
- $417
Break-even live
UW: 25.0% down · 7.5% · 30yr · 1.5% tax · 5.0% vac · 8.0% maint · 8.0% mgmt
Financing live
Cash to close
- Down payment
- $30,000
- Closing costs
- $3,600
- Reserves months
- —
- Total cash needed
- —
Loan-product check · same deal, 3 products live
Conventional
25% down · 7.5% · 30yr
- Down + closing
- —
- Monthly P&I
- —
- Monthly cashflow
- —
- DSCR
- —
- Eligible?
- —
Personal DTI + credit; lowest rate.
DSCR
20% down · 8.5% · 30yr
- Down + closing
- —
- Monthly P&I
- —
- Monthly cashflow
- —
- DSCR
- —
- Eligible?
- —
No personal income docs; deal must DSCR.
Hard money
10% down · 12.0% · 12mo
- Down + closing
- —
- Monthly P&I
- —
- Monthly cashflow
- —
- DSCR
- —
- Eligible?
- —
Short-term bridge; refi at stabilization.
Rent comps 40 comps
| Address | Beds | Baths | Sqft | Rent | $/sqft | DOM | Units | Dist |
|---|---|---|---|---|---|---|---|---|
| 2300 Good Hope Rd SE Washington, DC | 2.0 | 1.0–2.0 | 1020 | $1,913 | $1.88 | 24d | 6 | 0.16mi |
| 2562 Naylor Rd SE Washington, DC | 1.0–2.0 | 1.0 | 790 | $2,075 | $2.63 | 3d | 21 | 0.19mi |
| 2202 U Pl SE Washington, DC | 2.0 | 1.5 | 1232 | $3,500 | $2.84 | 24d | 1 | 0.27mi |
| 1907 Marion Barry Ave SE Washington, DC | 2.0 | 1.0 | 900 | $1,495 | $1.66 | 24d | 1 | 0.28mi |
| 1953 19th Pl SE Apt 104 Washington, DC | 3.0 | 1.0 | 980 | $2,800 | $2.86 | 5d | 1 | 0.33mi |
| 1953 19th Pl SE Apt 301 Washington, DC | 3.0 | 1.0 | 980 | $5,301 | $5.41 | 24d | 1 | 0.34mi |
| 1847 Marion Barry Ave SE Washington, DC | 1.0–2.0 | 1.0 | 725 | $1,525 | $2.10 | 24d | 1 | 0.38mi |
| 2440 S St SE Unit 4 Washington, DC | 3.0 | 1.0 | 800 | $2,450 | $3.06 | 8d | 1 | 0.38mi |
| 2515 R St SE Washington, DC | 1.0–2.0 | 1.0 | 812 | $1,755 | $2.16 | 5d | 2 | 0.42mi |
| 1750 Galen St SE Washington, DC | 3.0 | 3.0 | 1138 | $2,300 | $2.02 | 4d | 1 | 0.43mi |
| 2495 Alabama Ave SE Unit 302 Washington, DC | 3.0 | 1.0 | 825 | $2,600 | $3.15 | 22d | 1 | 0.46mi |
| 1800 28th Pl SE #201 Washington, DC | 3.0 | 2.0 | 1132 | $2,800 | $2.47 | 3d | 1 | 0.47mi |
| 2621 30th St SE Unit 1 Washington, DC | 2.0 | 1.0 | 800 | $1,750 | $2.19 | 24d | 1 | 0.49mi |
| 2805 28th St SE Unit 1 Washington, DC | 2.0 | 1.0 | 800 | $1,690 | $2.11 | 24d | 1 | 0.49mi |
| 1737 T St SE Washington, DC | 2.0 | 1.0 | 800 | $2,500 | $3.12 | 4d | 1 | 0.49mi |
| 2801 R St SE Unit 2 Washington, DC | 2.0 | 1.0 | 700 | $1,569 | $2.24 | 24d | 1 | 0.50mi |
| 2341 Green St SE Washington, DC | 2.0 | 1.0 | 741 | $1,225 | $1.65 | 24d | 1 | 0.51mi |
| 2833 28th St SE Unit 4 Washington, DC | 3.0 | 1.0 | 820 | $2,200 | $2.68 | 24d | 1 | 0.51mi |
| 1721 T St SE Washington, DC | 1.0–2.0 | 1.0 | 785 | $1,980 | $2.52 | 22d | 6 | 0.52mi |
| 1616 27th St SE Unit 6 Washington, DC | 3.0 | 1.0 | 1100 | $2,850 | $2.59 | 24d | 1 | 0.52mi |
| 2821 R St SE Washington, DC | 2.0 | 1.0 | 853 | $1,650 | $1.93 | 24d | 1 | 0.52mi |
| 1707 29th St SE Unit 2 Washington, DC | 2.0 | 1.0 | 1200 | $2,350 | $1.96 | 3d | 1 | 0.53mi |
| 2716 29th St SE Washington, DC | 2.0 | 1.0 | 850 | $2,000 | $2.35 | 24d | 1 | 0.58mi |
| 1526 V St SE Unit 2 Washington, DC | 2.0 | 1.0 | 800 | $1,700 | $2.12 | 24d | 1 | 0.59mi |
| 1525 28th St SE Unit 302 Washington, DC | 3.0 | 1.0 | 900 | $2,100 | $2.33 | 24d | 1 | 0.60mi |
| 2816 Hartford St SE Washington, DC | 3.0 | 1.0 | 760 | $9,000 | $11.84 | 4d | 1 | 0.60mi |
| 2215 Minnesota Ave SE Unit 18 Washington, DC | 4.0 | 2.0 | 990 | $4,500 | $4.55 | 24d | 1 | 0.60mi |
| 2215 Minnesota Ave SE Unit 3 Washington, DC | 3.0 | 1.0 | 750 | $2,500 | $3.33 | 24d | 1 | 0.60mi |
| 1618 18th St SE Unit 1 Washington, DC | 2.0 | 1.0 | 800 | $1,850 | $2.31 | 24d | 1 | 0.61mi |
| 2841 Gainesville St SE #201 Washington, DC | 2.0 | 1.0 | 784 | $1,900 | $2.42 | 3d | 1 | 0.62mi |
| 2847 Gainesville St SE Unit B2 Washington, DC | 2.0 | 1.0 | 710 | $1,700 | $2.39 | 24d | 1 | 0.63mi |
| 2847 Gainesville St SE Unit 303 Washington, DC | 3.0 | 1.0 | 902 | $2,400 | $2.66 | 24d | 1 | 0.63mi |
| 2838 Hartford St SE #304 Washington, DC | 2.0 | 1.0 | 775 | $1,500 | $1.94 | 3d | 1 | 0.63mi |
| 2838 Hartford St SE Washington, DC | 2.0 | 1.0 | 785 | $1,538 | $1.96 | 18d | 2 | 0.63mi |
| 1720 R St SE Washington, DC | 3.0 | 1.0 | 750 | $2,500 | $3.33 | 24d | 1 | 0.63mi |
| 1634 Ridge Pl SE Washington, DC | 3.0 | 3.5 | 1248 | $3,200 | $2.56 | 24d | 1 | 0.64mi |
| 1516 Marion Barry Ave SE Unit 301 Washington, DC | 3.0 | 2.0 | 1100 | $1,795 | $1.63 | 8d | 1 | 0.66mi |
| 2925-2929 Pennsylvania Ave SE Unit 106 Washington, DC | 4.0 | 1.0 | 988 | $4,200 | $4.25 | 24d | 1 | 0.66mi |
| 2925-2929 Pennsylvania Ave SE Unit 204 Washington, DC | 3.0 | 1.0 | 980 | $3,000 | $3.06 | 4d | 1 | 0.66mi |
| 2925-2929 Pennsylvania Ave SE Unit 106 Washington, DC | 4.0 | 1.0 | 980 | $4,200 | $4.29 | 4d | 1 | 0.66mi |
HOA detail condo
- Monthly dues
- $616 · $7,392/yr
- Assessments
- None detected in remarks — confirm with the listing agent.
Listing history 34 events
-
2026-06-18days on market $120,000 Active 37 DOM
-
2026-06-17days on market $120,000 Active 36 DOM
-
2026-06-16days on market $120,000 Active 35 DOM
-
2026-06-15pricedays on market $120,000 Active 34 DOM
-
2026-06-13days on market $149,000 Active 32 DOM
-
2026-06-09days on market $149,000 Active 28 DOM
-
2026-06-08days on market $149,000 Active 27 DOM
-
2026-06-07days on market $149,000 Active 26 DOM
-
2026-06-04days on market $149,000 Active 23 DOM
-
2026-06-03days on market $149,000 Active 22 DOM
-
2026-06-02days on market $149,000 Active 21 DOM
-
2026-06-01days on market $149,000 Active 20 DOM
-
2026-05-31days on market $149,000 Active 19 DOM
-
2026-05-13$149,000 Active
-
2026-04-27historical $149,000
-
2017-04-10historical
-
2017-04-10historical
-
2017-01-11$100,000
-
2017-01-11Active
-
2009-04-17historical
-
2009-04-15soldstatus $47,250 Sold
-
2009-03-17historical
-
2009-02-20price $69,900
-
2009-01-30price $74,900
-
2009-01-20price $89,900
-
2008-12-29price $94,900
-
2008-12-05price $99,900
-
2008-11-26price $117,900
-
2008-11-05price $121,900
-
2008-10-14price $124,900
-
2008-09-24price $129,900
-
2008-09-03$134,900
-
1975-03-26soldstatus $22,950
-
1975-02-26soldstatus $22,950
ⓘ Source: listings_history table (triggers on properties + properties_extension) + one-shot
backfill from property_details.listing_events for pre-trigger history.
Tax reassessment forecast DC · Partial reset (capped growth)
- Current annual tax
- $895 · $75/mo
- Projected year-2 tax
- $895 · $75/mo
- Expected delta
- $0/yr ($0/mo · 0.0%)
ⓘ Screening estimate from a state-policy table — verify with the county assessor before closing.
Climate risk First Street
- Flood 7/10 Severe FEMA zone X (unshaded) · 78% chance over 30 yrs
- Wildfire 1/10 Low
- Heat 7/10 Severe 7 d/yr ≥104°F today · 14 d/yr by 30 yrs out
- Wind 4/10 Moderate 18% chance of damaging wind over 30 yrs
- Air quality 4/10 Moderate 4 unhealthy d/yr today · 5 by 30 yrs out
Nearby sold comps map
Loading sold comps map…
Walkable amenities ~0.75 mi
Loading nearby amenities…
Taxation est. · year 1
- Rental income
- $28,157
- − Mortgage interest
- −$6,722
- − Property taxes
- −$895
- − Insurance
- −$1,398
- − Repairs & maintenance
- −$2,253
- − Management
- −$2,253
- − HOA
- −$7,392
- − Depreciation
- −$3,491
- Taxable income
- $3,754
- Est. tax owed @ 24.0%
- −$901
- After-tax cash flow
- $4,107/yr
For passive investors: Depreciation is non-cash, so a rental often shows a tax loss while cash-flowing — sheltering income. Rental losses are passive: they offset passive income freely, and up to $25,000/yr can offset ordinary (W-2) income if you actively participate and your MAGI is under $100k (phasing out to $0 by $150k); unused losses carry forward. On sale, claimed depreciation is recaptured at up to 25%, and gains may owe capital-gains tax (a 1031 exchange can defer both). Figures are a year-1 estimate at your 24.0% rate — not tax advice; consult a CPA.
Schools (NCES district)
- District
- District Of Columbia Public Schools
- NCES district ID
- 1100030
- Math proficiency
- 33% ▲ 3.00%
- Reading proficiency
- 40% ▲ 5.00%
- Median HH income
- $67,671
- Composite
- 35.84/100
- National rank
- #9606
- State rank
- #8 of 32 in DC
Livability — Washington
- Score
- 73/100
- State rank
- #1
- US rank
- #5327
Category grades
Schools grade is shown separately in the Schools card above.
Census & demographics
- Census place
- Washington, DC
- County
- District of Columbia · 671,873 people
- City population
- 671,873
- Metro
- Washington-Arlington-Alexandria, DC-VA-MD-WV
- Population (ZIP)
- 53,005
- Household income
- $54,032
- Rent vs Own
- Severe rent burden
- 5148.0
Population outlook (District of Columbia County) Hauer SSP2
- Today (2025)
- 821,926 people
- By 2030
- 899,517 · +9.4%
- By 2040
- 1,061,162 · +29.1%
- By 2050
- 1,231,493 · +49.8%
- By 2075
- 1,603,312 · +95.1%
- By 2100
- 1,847,141 · +124.7%
Race, ethnicity, and origin ACS 2023
- Neighborhood character
- Predominantly Black (90%)
- Race & ethnicity
- Black 90% Two or more races 3% Hispanic / Latino 3% White 3%
- Common ancestry
- Lithuanian 1%
- Foreign-born
- 3% · Canada
- Languages at home
- 95% English-only · Spanish 2% French/Haitian/Cajun 1%
Political lean MEDSL · District of Columbia
- 2024 margin
- Solid D (+86.1) · D 91.2% · R 5.1% · Other 3.8%
- 2008→2024 swing
- +0.1pp no change · 2008: 85.9pp · 2024: 86.1pp
- All cycles
- 2024: D+86.1 2020: D+86.8 2016: D+88.7 2012: D+84.2 2008: D+85.9
Not yet ingested
- Civics
- —
Market trends
- HPI YoY
- ▼ -415.44%
- Current HPI
- 306.5068
- Rent YoY
- ▲ 3.86%
- Metro
- Washington-Arlington-Alexandria, DC-VA-MD-WV
- State GDP YoY
- ▲ 1.33%
- F500 in state
- 6
Industry mix (Fortune 500 HQ in DC)
| Industry | F500 HQs | Revenue |
|---|---|---|
| Financial Services | 1 | $153B |
|
||
| Life Sciences / Industrials | 1 | $25B |
|
||
| Industrial Machinery | 1 | $8B |
|
||
Price history
+549.2% since first listed21 events — show timeline
- 2026-05-13 Listed $149,000 BRIGHT MLS
- 2026-04-27 Coming Soon $149,000 BRIGHT MLS
- 2017-04-10 Delisted — MRIS
- 2017-04-10 Listing Removed — BRIGHT MLS
- 2017-01-11 Listed $100,000 BRIGHT MLS
- 2017-01-11 Listed — MRIS
- 2009-04-17 Delisted — MRIS
- 2009-04-15 Sold (MLS) $47,250 MRIS
- 2009-03-17 Contingent — MRIS
- 2009-02-20 Price Changed $69,900 MRIS
- 2009-01-30 Price Changed $74,900 MRIS
- 2009-01-20 Price Changed $89,900 MRIS
- 2008-12-29 Price Changed $94,900 MRIS
- 2008-12-05 Price Changed $99,900 MRIS
- 2008-11-26 Price Changed $117,900 MRIS
- 2008-11-05 Price Changed $121,900 MRIS
- 2008-10-14 Price Changed $124,900 MRIS
- 2008-09-24 Price Changed $129,900 MRIS
- 2008-09-03 Listed $134,900 MRIS
- 1975-03-26 Sold (Public Records) $22,950 Public Records
- 1975-02-26 Sold (Public Records) $22,950 Public Records
Property tax history
-1.9%/yrLatest (2025): $895 · +1.9% YoY. Source: county tax records.
Cash-flow waterfall
monthlySold comps — $/sqft
last 12 mo · ≤1 miLoading sold comps…