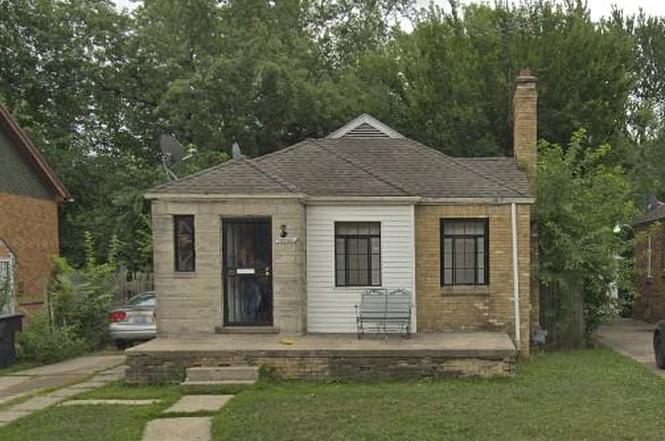
12550 Corbett St · Detroit, MI
Flood risk 5/10 · Moderate
- FEMA flood zone
- X (unshaded)
- Chance of flooding over 30 yrs
- 0.48%
- Est. flood insurance / yr
- $473 – $860
Fire risk 1/10 · Minimal
- Est. fire insurance / yr
- $784 – $1,456
Heat risk 3/10 · Minor
- Hot days now (above 96°F)
- 7 days/yr
- Hot days in 30 yrs
- 15 days/yr
Wind risk 2/10 · Minimal
- Chance of severe wind over 30 yrs
- —
Air-quality risk 3/10 · Minor
- Unhealthy air days now
- 2 days/yr
- Unhealthy air days in 30 yrs
- 5 days/yr
Risk factors via First Street. Map © Google.
Why this score? — see what drove the D+ grade
The composite is a weighted blend of 9 inputs, each scored 0–100. Each bar is that input's sub-score; the figure is the points it added to the 100-point composite (weight × sub-score).
- Cash flow +15.0/30.0
- ARV discount +11.2/15.0
- 1% rule +5.0/10.0
- DSCR +5.0/10.0
- Livability +3.7/5.0
- Rent growth +2.5/5.0
- Condition / age +2.5/5.0
- Schools +1.3/10.0
- Appreciation +0.0/10.0
$27,000
🖨 Deal sheet 📄 Offer letter ✓ Due diligence
Listing remarks MLS
Opportunity awaits at this 2 bed - 1 bath brick single family ranch home! Located in the heart of Detroit, this blank canvas offers an incredible opportunity for an investor, rehabber, or a homeowner with a vision for renovation and a desire to create a home. So if you are an investor looking for a profitable flip, looking to add to your portfolio with a steady rental, or a first time home buyer looking to bring in your "sweat equity", the potential here is undeniable. Situated near parks, shopping, and major freeways, this neighborhood has charm that blends nicely with everyday convenience. With a dry cinder block foundation, solid steel beam stanchion supports, new sewer line from home to city main, new hot water tank, and a functional roof this could be a smart choice in one of Detroit's steadily growing pockets. With a little imagination, this home can shine again and deliver lasting value! All appliances stay.
Key facts
- New hot water tank
- Near parks
- Functional roof
Tags
Property features AI
Exterior
- Parking: Detached 2-car garage
- Utilities: Circuit breaker electrical service; Municipal water available; Municipal sewer available
- Home design: Single-family residence; One story; Ground-level entry with steps; Brick exterior; Facing information not provided
- Construction: Block foundation
- Exterior features: Front porch; Paved road access
Interior
- Kitchen: Free-standing gas range; Free-standing refrigerator; Dishwasher
- Bedrooms: 2 total rooms (includes bedroom count within total rooms)
- Bathrooms: 1 full bathroom
- Heating & cooling: Forced air heating (natural gas); No central cooling
- Interior features: Living room fireplace; Unfinished basement
- Laundry & utility: Washer; Dryer
Neighborhood map
What this means for you Summary
Snapshot
- This is a 2-bed/1.0-bath single-family listed at $27k.
Deal economics
- At list price, monthly cash flow is $736 ($9k/yr) — positive.
- The deal already cash-flows at list — no discount required.
- Meets the 1% rule at list price ($1k rent vs $27k).
- Cap rate 39.0% vs local median 10.2% in Detroit — top-decile yield for the area; either an underpriced asset or a hidden risk that comps aren't pricing in. Stress-test before assuming the spread holds.
Location & tenants
- Location reads 73/100 on livability (#218 in MI) — a middle-class / working-renter tenant base. Strengths: amenities A+, commute A+, cost of living A+; Watch: schools F, crime F, employment F.
- Detroit Public Schools Community District (urban): math 10% / reading 24% proficiency, ranked #499 of 540 in MI (top 92%) — low school quality limits family demand, transient renter base, plan for 1-2y turnover; 90% free/reduced lunch — lower-income household profile, screen leases tightly.
- Market conditions: 190 active listings in the ZIP; 19 comparable units currently listed for rent nearby; rentals at typical pace (median 17d on market — plan ~3-4 weeks tenant-placement turnaround); lower-income renter base — watch delinquency; 2,639 units permitted in Wayne County in 2024 (1,216 in 5+ unit buildings).
- This rent runs 41% of the median local income ($34k/yr) — at the standard rent-burdened threshold; future hikes will face affordability resistance.
Forward outlook
- Local home prices are declining (-3.0%/yr); year-one equity from $187 of loan paydown is wiped out by about $810 of value loss. Plan a longer hold.
- Wayne County population projected at -17% by 2050 — secular population decline; favor cash flow + early exit over multi-decade hold.
- At projected returns (-3.0% appreciation + 3.0% rent growth), your $8k cash investment doubles in ~1 year — after that, you're playing with house money.
Negotiation context
- Only 7 days on market — expect competitive offers; lowballing is unlikely to land.
- 11 sale attempts since 22y ago with the ask held roughly flat each time — persistent listings suggest the price (not the market) is what's stuck; bring a comps-based counter.
Risks & watch-outs
- Watch-outs: built in 1942 — expect roof / HVAC / electrical / plumbing capex.
- Climate carrying-cost: moderate flood risk — expect insurance premiums to compound above CPI over the hold.
Questions for the listing agent
- Built in 1942 — when were the roof, HVAC, electrical panel, plumbing, and water heater last replaced?
- Is there a deadline driving the sale (1031 exchange, divorce, estate, relocation)? That informs how much negotiation room exists.
- Schools are F-rated, which usually means shorter tenancies and higher turnover. Who's the typical renter profile here, and what's been the actual vacancy rate?
- Crime grade is F in this area — have there been break-ins, vandalism, or insurance claims at this property in the last 3 years? What carrier currently insures it and at what premium?
- The area grade is low — what's the realistic commute time and amenity access for the typical tenant pool here? Any planned neighborhood developments (good or bad) we should know about?
- What's the average days-on-market for RENTAL listings here right now (not sales)? A rising rental-DOM trend means longer vacancies and softer asking-rent achievability than the comps imply.
- What's the recent tenant-quality profile in this submarket — average credit score on applications, eviction rate, late-payment / NSF rate, and stable-employment percentage? A property-management company in the area should have these aggregated.
- How much new for-sale + rental construction is in the pipeline within 1–3 miles? Heavy new supply typically softens prices + rents 12–24 months out; constrained supply supports both.
Investment metrics
- 1% rule
- 4.32% ✓
- Cap rate
- 39.00%
- Cash-on-cash
- 116.80%
- DSCR
- 6.20
- GRM
- 1.9
CMA / ARV
- ARV (on-the-fly)
- $29,388
- Comps found
- 12
Show comp detail 12 sales within ~0.75 mi
| Address | Dist | Beds/Ba | Sqft | Sold | Price | $/sf | Match |
|---|---|---|---|---|---|---|---|
| 12561 Maiden St | 0.04mi | 3/1.0 (+1) | 963 (+2%) | 1mo | $69,690 | $72 | 90 |
| 12541 Camden St | 0.14mi | 2/1.0 | 1,014 (+7%) | 9mo | $29,525 | $29 | 74 |
| 12521 Chelsea St | 0.24mi | 2/1.0 | 953 (+0%) | 18mo | $27,000 | $28 | 73 |
| 13067 Wade St | 0.34mi | 2/1.0 | 910 (-4%) | 16mo | $28,000 | $31 | 64 |
| 12389 Camden St | 0.17mi | 2/1.0 | 864 (-9%) | 18mo | $40,000 | $46 | 63 |
| 8801 E Outer Dr | 0.46mi | 3/1.5 (+1) | 1,047 (+10%) | 1mo | $40,000 | $38 | 53 |
| 12527 Glenfield St | 0.66mi | 3/1.0 (+1) | 935 (-1%) | 16mo | $22,000 | $24 | 49 |
| 8750 E Outer Dr | 0.41mi | 3/1.0 (+1) | 1,070 (+13%) | 7mo | $102,000 | $95 | 49 |
| 12780 Evanston St | 0.33mi | 3/2.5 (+1) | 1,074 (+13%) | 9mo | $17,500 | $16 | 44 |
| 14227 Elmdale St | 0.61mi | 3/1.0 (+1) | 880 (-7%) | 13mo | $27,000 | $31 | 44 |
| 14263 Hampshire St | 0.67mi | 3/1.0 (+1) | 1,056 (+11%) | 5mo | $16,500 | $16 | 41 |
| 12786 Rosemary St | 0.53mi | 3/2.0 (+1) | 1,038 (+10%) | 19mo | $127,000 | $122 | 35 |
Match score weights: distance 35% · size 25% · config 20% · recency 20%. Top-matched comps best support the ARV.
Projected returns pro-forma
-3.0% appreciation · 3.0% rent growth · sell at horizon
- IRR
- —
- Equity multiple
- 6.62×
- Total profit
- $42,510
- Equity at exit
- $4,026
- IRR
- —
- Equity multiple
- 13.89×
- Total profit
- $97,439
- Equity at exit
- $2,334
Cash invested: $7,560 (down + closing). Projections, not guarantees.
Landlord ↔ Tenant lean methodology
- Overall (STATE)
- 62 Landlord-Friendly
- State Michigan
- 62 Landlord-Friendly · EVEN
- County
- — inherits STATE
- City
- — inherits STATE
ZIP-level market 48213
- Active inventory
- 190
- Price-to-rent
- 1.9×
Monthly cashflow live
- Estimated rent
- $1,168 high interval (Pro) →
- Mortgage (P&I)
- −$142
- Tax est. 1.5%
- −$34 /mo · $405/yr
- Insurance
- −$11
- HOA
- −$0
- Vacancy / Maint / Mgmt
- −$245
- Net cashflow
- $736
Break-even live
UW: 25.0% down · 7.5% · 30yr · 1.5% tax · 5.0% vac · 8.0% maint · 8.0% mgmt
Financing live
Cash to close
- Down payment
- $6,750
- Closing costs
- $810
- Reserves months
- —
- Total cash needed
- —
Loan-product check · same deal, 3 products live
Conventional
25% down · 7.5% · 30yr
- Down + closing
- —
- Monthly P&I
- —
- Monthly cashflow
- —
- DSCR
- —
- Eligible?
- —
Personal DTI + credit; lowest rate.
DSCR
20% down · 8.5% · 30yr
- Down + closing
- —
- Monthly P&I
- —
- Monthly cashflow
- —
- DSCR
- —
- Eligible?
- —
No personal income docs; deal must DSCR.
Hard money
10% down · 12.0% · 12mo
- Down + closing
- —
- Monthly P&I
- —
- Monthly cashflow
- —
- DSCR
- —
- Eligible?
- —
Short-term bridge; refi at stabilization.
Rent comps 19 comps
| Address | Beds | Baths | Sqft | Rent | $/sqft | DOM | Units | Dist |
|---|---|---|---|---|---|---|---|---|
| 12210 Longview St Detroit, MI | 3.0 | 1.0 | 1020 | $1,100 | $1.08 | 43d | 1 | 0.25mi |
| 13067 Wade St Detroit, MI | 2.0 | 1.0 | 660 | $900 | $1.36 | 4d | 1 | 0.33mi |
| 13137 Elmdale St Detroit, MI | 3.0 | 1.0 | 1115 | $1,400 | $1.26 | 24d | 1 | 0.39mi |
| 13400 Longview St Detroit, MI | 3.0 | 1.5 | 1000 | $1,400 | $1.40 | 43d | 1 | 0.51mi |
| 9190 Hayes St Unit 1 Detroit, MI | 2.0 | 1.0 | 750 | $850 | $1.13 | 14d | 1 | 0.82mi |
| 11765 Glenfield Ave Unit 1510880P Detroit, MI | 2.0 | 1.0 | 990 | $3,102 | $3.13 | 14d | 1 | 0.86mi |
| 12740 August St Detroit, MI | 2.0 | 1.0 | 900 | $1,300 | $1.44 | 4d | 1 | 0.99mi |
| 12110 Christy St Detroit, MI | 2.0 | 1.5 | 950 | $1,200 | $1.26 | 17d | 1 | 1.06mi |
| 12112 Christy St Unit 12110 Detroit, MI | 2.0 | 1.0 | 950 | $1,200 | $1.26 | 43d | 1 | 1.06mi |
| 9516 Wayburn St Detroit, MI | 2.0 | 1.0 | 800 | $950 | $1.19 | 17d | 1 | 1.12mi |
| 5076 Chalmers St Unit 5074 Detroit, MI | 1.0 | 1.0 | 700 | $925 | $1.32 | 24d | 1 | 1.21mi |
| 14103 Rochelle Ave Unit 3 Detroit, MI | 1.0 | 1.0 | 700 | $800 | $1.14 | 43d | 1 | 1.26mi |
| 10141 Roxbury St Detroit, MI | 3.0 | 1.0 | 1115 | $1,000 | $0.90 | 43d | 1 | 1.29mi |
| 10644 Stratman St Detroit, MI | 2.0 | 1.0 | 1000 | $1,200 | $1.20 | 17d | 1 | 1.30mi |
| 9927 Beaconsfield St Detroit, MI | 3.0 | 1.0 | 942 | $1,375 | $1.46 | 14d | 1 | 1.34mi |
| 4667 Eastlawn St Detroit, MI | 3.0 | 1.0 | 646 | $1,095 | $1.70 | 3d | 1 | 1.34mi |
| 5751 Nottingham Rd Unit 5/21/26 Detroit, MI | 3.0 | 1.0 | 1100 | $1,250 | $1.14 | 14d | 1 | 1.39mi |
| 11700 Engleside St Detroit, MI | 3.0 | 1.0 | 1000 | $1,175 | $1.18 | 43d | 1 | 1.40mi |
| 9747 Somerset Ave Detroit, MI | 2.0 | 1.0 | 797 | $1,100 | $1.38 | 43d | 1 | 1.43mi |
Listing history 7 events
-
2026-06-18days on market $27,000 Active 7 DOM
-
2026-06-17days on market $27,000 Active 6 DOM
-
2026-06-16days on market $27,000 Active 5 DOM
-
2026-06-15days on market $27,000 Active 4 DOM
-
2026-06-13days on market $27,000 Active 2 DOM
-
2026-06-13remarks 689-char remark
-
2026-06-13$27,000 Active 1 DOM
ⓘ Source: listings_history table (triggers on properties + properties_extension) + one-shot
backfill from property_details.listing_events for pre-trigger history.
Climate risk First Street
- Flood 5/10 Major FEMA zone X (unshaded) · 48% chance over 30 yrs
- Wildfire 1/10 Low
- Heat 3/10 Moderate 7 d/yr ≥96°F today · 15 d/yr by 30 yrs out
- Wind 2/10 Low
- Air quality 3/10 Moderate 2 unhealthy d/yr today · 5 by 30 yrs out
Nearby sold comps map
Loading sold comps map…
Walkable amenities ~0.75 mi
Loading nearby amenities…
Taxation est. · year 1
- Rental income
- $14,012
- − Mortgage interest
- −$1,512
- − Property taxes
- −$405
- − Insurance
- −$135
- − Repairs & maintenance
- −$1,121
- − Management
- −$1,121
- − Depreciation
- −$785
- Taxable income
- $8,932
- Est. tax owed @ 24.0%
- −$2,144
- After-tax cash flow
- $6,687/yr
For passive investors: Depreciation is non-cash, so a rental often shows a tax loss while cash-flowing — sheltering income. Rental losses are passive: they offset passive income freely, and up to $25,000/yr can offset ordinary (W-2) income if you actively participate and your MAGI is under $100k (phasing out to $0 by $150k); unused losses carry forward. On sale, claimed depreciation is recaptured at up to 25%, and gains may owe capital-gains tax (a 1031 exchange can defer both). Figures are a year-1 estimate at your 24.0% rate — not tax advice; consult a CPA.
Schools (NCES district)
- District
- Detroit Public Schools Community District
- NCES district ID
- 2601103
- Math proficiency
- 10% ▼ -2.00%
- Reading proficiency
- 24% ▲ 6.00%
- Median HH income
- $25,815
- Composite
- 13.06/100
- National rank
- #9564
- State rank
- #499 of 540 in MI
Livability — Detroit
- Score
- 73/100
- State rank
- #218
- US rank
- #5427
Category grades
Schools grade is shown separately in the Schools card above.
Census & demographics
- Census place
- Detroit, MI
- County
- Wayne County · 1,562,939 people
- City population
- 572,865
- Metro
- Detroit-Warren-Dearborn, MI
- Population (ZIP)
- 20,075
- Household income
- $34,003
- Rent vs Own
- Severe rent burden
- 1202.0
Population outlook (Wayne County) Hauer SSP2
- Today (2025)
- 1,675,273 people
- By 2030
- 1,620,300 · -3.3%
- By 2040
- 1,502,341 · -10.3%
- By 2050
- 1,384,039 · -17.4%
- By 2075
- 1,124,592 · -32.9%
- By 2100
- 881,193 · -47.4%
Race, ethnicity, and origin ACS 2023
- Neighborhood character
- Predominantly Black (92%)
- Race & ethnicity
- Black 92% White 4% Hispanic / Latino 2% Two or more races 1%
- Common ancestry
- Slovak 1%
- Foreign-born
- 2% · Canada
- Languages at home
- 97% English-only · Arabic 1% Spanish 1%
Political lean MEDSL · Wayne
- 2024 margin
- Strong D (+29.0) · D 62.7% · R 33.7% · Other 3.6%
- 2008→2024 swing
- -20.5pp toward R · 2008: 49.5pp · 2024: 29.0pp
- All cycles
- 2024: D+29.0 2020: D+38.1 2016: D+37.3 2012: D+46.9 2008: D+49.5
Not yet ingested
- Civics
- —
Market trends
- HPI YoY
- ▼ -122.86%
- Current HPI
- 217.2037
- Rent YoY
- —
- Metro
- Detroit-Warren-Dearborn, MI
- State GDP YoY
- ▲ 1.37%
- F500 in state
- 28
Industry mix (Fortune 500 HQ in MI)
| Industry | F500 HQs | Revenue |
|---|---|---|
| Automotive Parts | 3 | $48B |
|
||
| Automotive | 2 | $372B |
|
||
| Chemicals | 1 | $45B |
|
||
| Automotive Retail | 1 | $29B |
|
||
| Healthcare / Medical Devices | 1 | $23B |
|
||
| Automotive Technology | 1 | $20B |
|
||
Price history
+350.0% since first listed36 events — show timeline
- 2026-06-12 Listed $27,000 MiRealSource-MiMLS
- 2026-06-12 Listed $27,000 REALCOMP
- 2026-06-10 Coming Soon $27,000 MiRealSource-MiMLS
- 2024-11-06 Sold (MLS) $23,500 MiRealSource-MiMLS
- 2024-11-06 Sold (MLS) $23,500 REALCOMP
- 2024-11-04 Pending — REALCOMP
- 2024-11-04 Pending — MiRealSource-MiMLS
- 2024-08-22 Price Changed $30,000 MiRealSource-MiMLS
- 2024-08-21 Price Changed $30,000 REALCOMP
- 2023-12-12 Price Changed $35,000 MiRealSource-MiMLS
- 2023-12-11 Price Changed $35,000 REALCOMP
- 2023-11-02 Price Changed $38,999 MiRealSource-MiMLS
- 2023-11-01 Price Changed $38,999 REALCOMP
- 2023-10-18 Price Changed $39,999 MiRealSource-MiMLS
- 2023-10-17 Price Changed $39,999 REALCOMP
- 2023-10-02 Listing Removed — MiRealSource-MiMLS
- 2023-10-02 Listed $42,000 MiRealSource-MiMLS
- 2023-10-02 Listed $42,000 REALCOMP
- 2023-10-02 Listing Removed — REALCOMP
- 2023-10-01 Price Changed $42,000 MiRealSource-MiMLS
- 2023-10-01 Price Changed $42,000 REALCOMP
- 2023-09-29 Listed $39,999 MiRealSource-MiMLS
- 2023-09-29 Listed $39,999 REALCOMP
- 2023-09-01 Listing Removed — REALCOMP
- 2023-08-31 Listing Removed — MiRealSource-MiMLS
- 2023-07-12 Price Changed $45,000 MiRealSource-MiMLS
- 2023-07-11 Price Changed $45,000 REALCOMP
- 2023-06-27 Listing Removed — MiRealSource-MiMLS
- 2023-06-27 Listing Removed — REALCOMP
- 2023-06-27 Listed $39,900 REALCOMP
- 2023-01-10 Listed $39,900 MiRealSource-MiMLS
- 2023-01-10 Listed $39,900 MiRealSource-MiMLS
- 2023-01-10 Listed $39,900 REALCOMP
- 2004-08-10 Listing Removed — REALCOMP
- 2004-02-10 Listed $69,900 REALCOMP
- 1991-12-04 Sold (Public Records) $6,000 Public Records
Property tax history
+7.6%/yrLatest (2025): $3,841 · +255.4% YoY. Source: county tax records.
Cash-flow waterfall
monthlySold comps — $/sqft
last 12 mo · ≤1 miLoading sold comps…