101 Magnolia · Oroville, CA
Flood risk 1/10 · Minimal
- FEMA flood zone
- X (unshaded)
- Chance of flooding over 30 yrs
- 0.0%
- Est. flood insurance / yr
- $507 – $1,088
Fire risk 6/10 · Moderate
- Est. fire insurance / yr
- $659 – $1,223
Heat risk 7/10 · Major
- Hot days now (above 105°F)
- 7 days/yr
- Hot days in 30 yrs
- 16 days/yr
Wind risk 1/10 · Minimal
- Chance of severe wind over 30 yrs
- —
Air-quality risk 10/10 · Severe
- Unhealthy air days now
- 29 days/yr
- Unhealthy air days in 30 yrs
- 36 days/yr
Risk factors via First Street. Map © Google.
Why this score? — see what drove the B+ grade
The composite is a weighted blend of 9 inputs, each scored 0–100. Each bar is that input's sub-score; the figure is the points it added to the 100-point composite (weight × sub-score).
- Cash flow +30.0/30.0
- ARV discount +15.0/15.0
- 1% rule +10.0/10.0
- DSCR +10.0/10.0
- Schools +2.8/10.0
- Rent growth +2.5/5.0
- Livability +2.5/5.0
- Condition / age +2.5/5.0
- Appreciation +0.0/10.0
$50,000
🖨 Deal sheet 📄 Offer letter ✓ Due diligence
Listing remarks
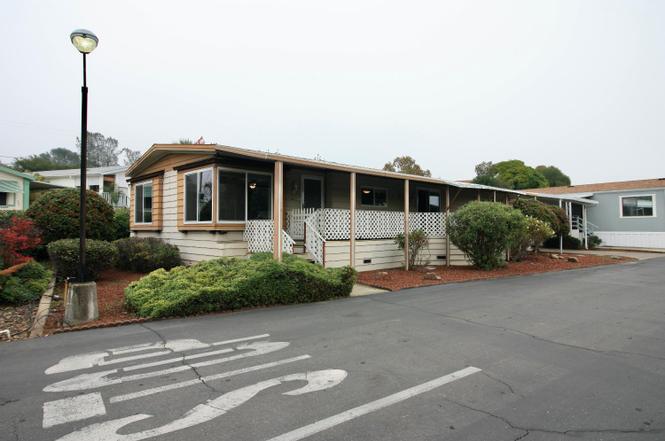
Discover efficient, comfortable living in this charming 2 bedroom, 2 bathroom mobile home. Ideally positioned on a desirable corner lot, the property offers a spacious feel. The residence is designed for year round comfort, featuring modern central heating and air conditioning throughout. The practical, easy to maintain floor plan includes two full baths for convenience and privacy. This property is a fantastic opportunity for those seeking a low maintenance lifestyle in an established community. Schedule your showing today.
Key facts
- Parking
- Built 1976
- Listed 2 days
Property features AI
Finance
- Other: Property located at 101 Magnolia Pkwy, Oroville, CA 95966; Corner lot in Olive Hill Mobile Park
- Financial info: Land lease: No (listed land lease amount present but land lease marked No)
- HOA & community: No homeowners association; Senior community
Exterior
- Parking: Covered parking; Guest parking available
- Utilities: Public water; Sewer: Other; Electrical: 220 volts in laundry; Utilities: Other
- Home design: Manufactured in park (double wide); Built in 1976; Located in a senior community; Facing/directions: Lower Wyandotte to Wyandotte Ave to Olive Hill Mobile Park
- Construction: Manufactured construction (Lancer make); Double wide
- Exterior features: Corner lot; Other roof type
Interior
- Kitchen: Breakfast area
- Bedrooms: 2 bedrooms
- Flooring: Carpet
- Bathrooms: 2 full bathrooms; Tub and separate shower stall(s)
- Heating & cooling: Central heating; Central air conditioning; Ceiling fan(s)
- Interior features: Carpet flooring; Living room with unspecified 'Other' feature; Dining room with unspecified 'Other' feature; Breakfast area in kitchen
- Laundry & utility: Laundry inside (220 volts in laundry)
Neighborhood map
What this means for you Summary
Snapshot
- This is a 2-bed/2.0-bath manufactured listed at $50k.
Deal economics
- At list price, monthly cash flow is $1k ($13k/yr) — positive.
- The deal already cash-flows at list — no discount required.
- Meets the 1% rule at list price ($2k rent vs $50k).
- Cap rate 31.5% vs local median 4.6% in Oroville — top-decile yield for the area; either an underpriced asset or a hidden risk that comps aren't pricing in. Stress-test before assuming the spread holds.
Location & tenants
- Location reads 50/100 on livability (#1,136 in CA) — a working-class tenant base; expect higher turnover. Watch: schools D, cost of living D, crime F.
- Oroville Union High (town): math 19% / reading 49% proficiency, ranked #300 of 517 in CA (top 58%) — families likely to look elsewhere, expect single-tenant / working-renter base with shorter leases.
- Market conditions: 372 active listings in the ZIP; 7 comparable units currently listed for rent nearby; rentals leasing fast (median 14d on market — plan ~1-2 weeks tenant-placement turnaround); 946 units permitted in Butte County in 2024 (254 in 5+ unit buildings).
- This rent runs 32% of the median local income ($66k/yr) — at the standard rent-burdened threshold; future hikes will face affordability resistance.
Forward outlook
- Local home prices are declining (-3.0%/yr); year-one equity from $346 of loan paydown is wiped out by about $2k of value loss. Plan a longer hold.
- Butte County population projected at +10% by 2050 — modest demand growth; plan on rents tracking national, not racing it.
- At projected returns (-3.0% appreciation + 3.0% rent growth), your $14k cash investment doubles in ~2 years — after that, you're playing with house money.
Negotiation context
- Only 3 days on market — expect competitive offers; lowballing is unlikely to land.
Risks & watch-outs
- Climate carrying-cost: major wildfire risk; extreme-heat days projected 7→16/yr by 2055 (HVAC capex compounding) — expect insurance premiums to compound above CPI over the hold.
Questions for the listing agent
- Built in 1976 — when were the roof, HVAC, electrical panel, plumbing, and water heater last replaced?
- Is there a deadline driving the sale (1031 exchange, divorce, estate, relocation)? That informs how much negotiation room exists.
- Schools are D-rated, which usually means shorter tenancies and higher turnover. Who's the typical renter profile here, and what's been the actual vacancy rate?
- Crime grade is F in this area — have there been break-ins, vandalism, or insurance claims at this property in the last 3 years? What carrier currently insures it and at what premium?
- What's the average days-on-market for RENTAL listings here right now (not sales)? A rising rental-DOM trend means longer vacancies and softer asking-rent achievability than the comps imply.
- What's the recent tenant-quality profile in this submarket — average credit score on applications, eviction rate, late-payment / NSF rate, and stable-employment percentage? A property-management company in the area should have these aggregated.
- How much new for-sale + rental construction is in the pipeline within 1–3 miles? Heavy new supply typically softens prices + rents 12–24 months out; constrained supply supports both.
Investment metrics
- 1% rule
- 3.55% ✓
- Cap rate
- 31.51%
- Cash-on-cash
- 90.06%
- DSCR
- 5.01
- GRM
- 2.3
CMA / ARV
- ARV (on-the-fly)
- $60,480
- Comps found
- 9
Show comp detail 9 sales within ~0.75 mi
| Address | Dist | Beds/Ba | Sqft | Sold | Price | $/sf | Match |
|---|---|---|---|---|---|---|---|
| 139 Birch | 0.16mi | 2/2.0 | 1,440 (0%) | 7mo | $27,000 | $19 | 87 |
| 157 Willow Pkwy | 0.16mi | 2/2.0 | 1,440 (0%) | 8mo | $37,000 | $26 | 86 |
| 143 Birch | 0.18mi | 3/2.0 (+1) | 1,440 (0%) | 8mo | $55,900 | $39 | 80 |
| 159 Willow Pkwy | 0.14mi | 2/2.0 | 1,344 (-7%) | 14mo | $15,000 | $11 | 71 |
| 121 Sycamore Pkwy | 0.02mi | 3/2.0 (+1) | 1,344 (-7%) | 24mo | $72,000 | $54 | 63 |
| 211 Elm Pkwy | 0.22mi | 3/2.0 (+1) | 1,512 (+5%) | 21mo | $75,000 | $50 | 59 |
| 211 Elm Pkwy #211 | 0.22mi | 3/2.0 (+1) | 1,512 (+5%) | 21mo | $75,000 | $50 | 59 |
| 110 Magnolia #110 | 0.01mi | 2/2.0 | 1,248 (-13%) | 24mo | $53,000 | $42 | 57 |
| 1956 B St | 0.55mi | 3/2.0 (+1) | 1,296 (-10%) | 19mo | $180,000 | $139 | 37 |
Match score weights: distance 35% · size 25% · config 20% · recency 20%. Top-matched comps best support the ARV.
Projected returns pro-forma
-3.0% appreciation · 3.0% rent growth · sell at horizon
- IRR
- 90.7%
- Equity multiple
- 5.20×
- Total profit
- $58,844
- Equity at exit
- $7,455
- IRR
- 93.7%
- Equity multiple
- 10.82×
- Total profit
- $137,526
- Equity at exit
- $4,323
Cash invested: $14,000 (down + closing). Projections, not guarantees.
Landlord ↔ Tenant lean methodology
- Overall (STATE)
- 18 Strongly Tenant-Friendly
- State California
- 18 Strongly Tenant-Friendly · D+13
- County
- — inherits STATE
- City
- — inherits STATE
ZIP-level market 95966
- Active inventory
- 372
- Price-to-rent
- 2.3×
Monthly cashflow live
- Estimated rent
- $1,773 high interval (Pro) →
- Mortgage (P&I)
- −$262
- Tax from tax record
- −$67 /mo · $808/yr
- Insurance
- −$21
- HOA
- −$0
- Vacancy / Maint / Mgmt
- −$372
- Net cashflow
- $1,051
Break-even live
UW: 25.0% down · 7.5% · 30yr · 1.5% tax · 5.0% vac · 8.0% maint · 8.0% mgmt
Financing live
Cash to close
- Down payment
- $12,500
- Closing costs
- $1,500
- Reserves months
- —
- Total cash needed
- —
Loan-product check · same deal, 3 products live
Conventional
25% down · 7.5% · 30yr
- Down + closing
- —
- Monthly P&I
- —
- Monthly cashflow
- —
- DSCR
- —
- Eligible?
- —
Personal DTI + credit; lowest rate.
DSCR
20% down · 8.5% · 30yr
- Down + closing
- —
- Monthly P&I
- —
- Monthly cashflow
- —
- DSCR
- —
- Eligible?
- —
No personal income docs; deal must DSCR.
Hard money
10% down · 12.0% · 12mo
- Down + closing
- —
- Monthly P&I
- —
- Monthly cashflow
- —
- DSCR
- —
- Eligible?
- —
Short-term bridge; refi at stabilization.
Rent comps 7 comps
| Address | Beds | Baths | Sqft | Rent | $/sqft | DOM | Units | Dist |
|---|---|---|---|---|---|---|---|---|
| 3250 Spencer Ave Oroville, CA | 3.0 | 1.0 | 900 | $1,400 | $1.56 | 13d | 1 | 0.40mi |
| 2127 B St Oroville, CA | 3.0 | 2.0 | 980 | $1,400 | $1.43 | 13d | 1 | 0.43mi |
| 2850 Myers St Oroville, CA | 3.0 | 2.0 | 1095 | $2,200 | $2.01 | 13d | 1 | 0.52mi |
| 1945 Fort Wayne St Oroville, CA | 3.0 | 1.0 | 876 | $1,950 | $2.23 | 13d | 1 | 0.62mi |
| 4325 Lower Wyandotte Rd Oroville, CA | 3.0 | 2.0 | 1152 | $2,000 | $1.74 | 13d | 1 | 0.83mi |
| 1189 High St Oroville, CA | 3.0 | 2.0 | 1462 | $1,850 | $1.27 | 13d | 1 | 1.33mi |
| 1481 Montgomery St Oroville, CA | 2.0 | 2.0 | 1440 | $2,400 | $1.67 | 13d | 1 | 1.39mi |
Listing history 9 events
-
2026-06-19days on market $50,000 Active 3 DOM
-
2026-06-18days on market $50,000 Active 2 DOM
-
2026-06-17remarks 530-char remark
-
2026-06-17days on market $50,000 Active 1 DOM
-
2026-06-03days on market $50,000 Active 180 DOM
-
2026-06-02days on market $50,000 Active 179 DOM
-
2026-06-01days on market $50,000 Active 178 DOM
-
2026-05-31days on market $50,000 Active 177 DOM
-
2026-05-30days on market $50,000 Active 176 DOM
ⓘ Source: listings_history table (triggers on properties + properties_extension) + one-shot
backfill from property_details.listing_events for pre-trigger history.
Tax reassessment forecast CA · Resets to sale price
- Current annual tax
- $808 · $67/mo
- Projected year-2 tax
- $808 · $67/mo
- Expected delta
- $0/yr ($0/mo · -0.0%)
ⓘ Screening estimate from a state-policy table — verify with the county assessor before closing.
Climate risk First Street
- Flood 1/10 Low FEMA zone X (unshaded) · 0% chance over 30 yrs
- Wildfire 6/10 Major
- Heat 7/10 Severe 7 d/yr ≥105°F today · 16 d/yr by 30 yrs out
- Wind 1/10 Low
- Air quality 10/10 Extreme 29 unhealthy d/yr today · 36 by 30 yrs out
Nearby sold comps map
Loading sold comps map…
Walkable amenities ~0.75 mi
Loading nearby amenities…
Taxation est. · year 1
- Rental income
- $21,281
- − Mortgage interest
- −$2,801
- − Property taxes
- −$808
- − Insurance
- −$250
- − Repairs & maintenance
- −$1,702
- − Management
- −$1,702
- − Depreciation
- −$1,455
- Taxable income
- $12,563
- Est. tax owed @ 24.0%
- −$3,015
- After-tax cash flow
- $9,593/yr
For passive investors: Depreciation is non-cash, so a rental often shows a tax loss while cash-flowing — sheltering income. Rental losses are passive: they offset passive income freely, and up to $25,000/yr can offset ordinary (W-2) income if you actively participate and your MAGI is under $100k (phasing out to $0 by $150k); unused losses carry forward. On sale, claimed depreciation is recaptured at up to 25%, and gains may owe capital-gains tax (a 1031 exchange can defer both). Figures are a year-1 estimate at your 24.0% rate — not tax advice; consult a CPA.
Schools (NCES district)
- District
- Oroville Union High
- NCES district ID
- 0629130
- Math proficiency
- 19% ▼ -2.00%
- Reading proficiency
- 49% ▼ -4.00%
- Median HH income
- $38,085
- Composite
- 28.26/100
- National rank
- #6794
- State rank
- #300 of 517 in CA
Livability — Oroville
- Score
- 50/100
- State rank
- #1136
- US rank
- #25715
Category grades
Schools grade is shown separately in the Schools card above.
Census & demographics
- Census place
- Oroville, CA
- County
- Butte County · 175,030 people
- City population
- 49,684
- Metro
- Chico, CA
- Population (ZIP)
- 28,503
- Household income
- $65,586
- Rent vs Own
- Severe rent burden
- 807.0
Population outlook (Butte County) Hauer SSP2
- Today (2025)
- 237,527 people
- By 2030
- 243,804 · +2.6%
- By 2040
- 253,899 · +6.9%
- By 2050
- 262,561 · +10.5%
- By 2075
- 283,709 · +19.4%
- By 2100
- 282,689 · +19.0%
Race, ethnicity, and origin ACS 2023
- Neighborhood character
- Predominantly White (67%)
- Race & ethnicity
- White 67% Hispanic / Latino 18% Two or more races 14% Asian 6% Native American 2% Black 2%
- Hispanic origin (detail)
- Mexican 16%
- Common ancestry
- Lithuanian 3% Slovak 3% Portuguese 2%
- Foreign-born
- 6% · Canada
- Languages at home
- 88% English-only · Spanish 7% Other Asian/Pacific 3% Russian/Polish/Slavic 1%
Political lean MEDSL · Butte
- 2024 margin
- Toss-up / Even · D 46.8% · R 49.9% · Other 3.3%
- 2008→2024 swing
- -5.5pp toward R · 2008: 2.4pp · 2024: -3.1pp
- All cycles
- 2024: R+3.1 2020: D+1.7 2016: R+4.0 2012: R+3.9 2008: D+2.4
Not yet ingested
- Civics
- —
Market trends
- HPI YoY
- ▼ -284.58%
- Current HPI
- 267.1415
- Rent YoY
- —
- Metro
- Chico, CA
- State GDP YoY
- ▲ 3.21%
- F500 in state
- 116
Industry mix (Fortune 500 HQ in CA)
| Industry | F500 HQs | Revenue |
|---|---|---|
| Technology | 27 | $1,492B |
|
||
| Financial Services | 3 | $174B |
|
||
| Retail | 3 | $44B |
|
||
| Insurance | 3 | $26B |
|
||
| Media / Entertainment | 2 | $115B |
|
||
| Pharmaceuticals / Biotech | 2 | $62B |
|
||
Property tax history
+11.5%/yrLatest (2025): $808 · +35.8% YoY. Source: county tax records.
Cash-flow waterfall
monthlySold comps — $/sqft
last 12 mo · ≤1 miLoading sold comps…