 🏷️ Likely Rental
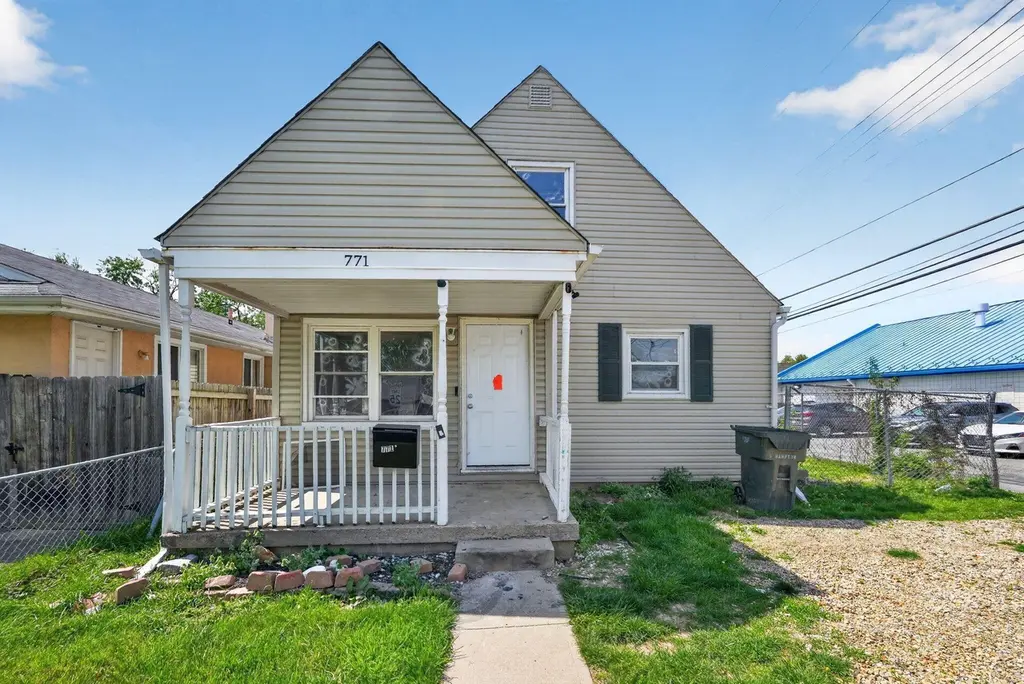
771 S Hampton Rd · Columbus, OH
Flood risk 1/10 · Minimal
- FEMA flood zone
- X (unshaded)
- Chance of flooding over 30 yrs
- 0.0%
- Est. flood insurance / yr
- $473 – $860
Fire risk 1/10 · Minimal
- Est. fire insurance / yr
- $713 – $1,323
Heat risk 3/10 · Minor
- Hot days now (above 99°F)
- 7 days/yr
- Hot days in 30 yrs
- 18 days/yr
Wind risk 2/10 · Minimal
- Chance of severe wind over 30 yrs
- 1.0%
Air-quality risk 2/10 · Minimal
- Unhealthy air days now
- 1 days/yr
- Unhealthy air days in 30 yrs
- 3 days/yr
Risk factors via First Street. Map © Google.
Why this score? — see what drove the B+ grade
The composite is a weighted blend of 9 inputs, each scored 0–100. Each bar is that input's sub-score; the figure is the points it added to the 100-point composite (weight × sub-score).
- Cash flow +30.0/30.0
- ARV discount +15.0/15.0
- DSCR +10.0/10.0
- 1% rule +9.1/10.0
- Livability +4.0/5.0
- Rent growth +3.8/5.0
- Condition / age +2.5/5.0
- Schools +1.7/10.0
- Appreciation +0.0/10.0
$114,900
🖨 Deal sheet 📄 Offer letter ✓ Due diligence
Listing remarks MLS
Lots of updates. Newer roof. windows in 2016, New electric hot water tank in 2017, hardwood floors on first level, dry basement, fenced yard, long term tenant and Owner Agent. (Curb offers please. .. that means No showings until offer has been accepted)
Key facts
- 5,227 sq ft lot
- Built 1953
- Listed 48 days
Property features AI
Exterior
- Parking: On-street parking
- Utilities: Public water; Public sewer
- Home design: Single family residence; One-and-a-half stories; Built in 1953; No shared/common walls
- Construction: Block foundation
- Exterior features: Fenced yard
Interior
- Bedrooms: 2 bedrooms on the main level
- Flooring: Wood flooring; Carpet
- Bathrooms: 1 full bathroom
- Heating & cooling: Forced air heating; Central air conditioning
- Interior features: Insulated windows; Full basement
Neighborhood map
What this means for you Summary
Snapshot
- This is a 4-bed/1.0-bath single-family listed at $115k.
Deal economics
- At list price, monthly cash flow is $449 ($5k/yr) — positive.
- The deal already cash-flows at list — no discount required.
- Meets the 1% rule at list price ($2k rent vs $115k).
- Recommended offer: $111k (3.0% below list) — sets the bar for market timing.
- Cap rate 11.0% vs local median 3.8% in Columbus — top-decile yield for the area; either an underpriced asset or a hidden risk that comps aren't pricing in. Stress-test before assuming the spread holds.
Location & tenants
- Location reads 81/100 on livability (#97 in OH, #1,491 nationally) — a professional / high-income tenant draw. Strengths: commute A+, cost of living A+, housing A+; Watch: employment C-, crime F.
- Columbus City School District (urban): math 15% / reading 26% proficiency, ranked #626 of 656 in OH (top 95%) — low school quality limits family demand, transient renter base, plan for 1-2y turnover; 72% free/reduced lunch — lower-income household profile, screen leases tightly.
- Market conditions: Rents rising fast (+5.2%/yr); 61 active listings in the ZIP; 19 comparable units currently listed for rent nearby; rentals lingering (median 44d on market — plan ~5-8 weeks vacancy on turnover, expect pricing pressure); 58% of comp listings sitting > 30 days — soft ceiling on asking rent; 8,139 units permitted in Franklin County in 2024 (5,940 in 5+ unit buildings).
- This rent runs 40% of the median local income ($48k/yr) — at the standard rent-burdened threshold; future hikes will face affordability resistance.
Forward outlook
- Local home prices are declining (-3.0%/yr); year-one equity from $794 of loan paydown is wiped out by about $3k of value loss. Plan a longer hold.
- Franklin County population projected at +34% by 2050 — long-run rental-demand tailwind backs the buy-and-hold thesis.
- At projected returns (-3.0% appreciation + 5.2% rent growth), your $32k cash investment doubles in ~7 years — after that, you're playing with house money.
Negotiation context
- It's been on market 48 days — a 3% lower offer ($111k) is reasonable based on typical stale-listing flexibility.
- 8 sale attempts since 28y ago with the ask held roughly flat each time — persistent listings suggest the price (not the market) is what's stuck; bring a comps-based counter.
- Current owner paid $40k; list at $115k implies a 187% gain — meaningful room to come down on a strong offer.
Risks & watch-outs
- Watch-outs: built in 1953 — expect roof / HVAC / electrical / plumbing capex.
Questions for the listing agent
- It's been on market 48 days. Have you received any prior offers? Is the seller open to a 3% concession, seller financing, or rate buy-down credit?
- Built in 1953 — when were the roof, HVAC, electrical panel, plumbing, and water heater last replaced?
- Is there a deadline driving the sale (1031 exchange, divorce, estate, relocation)? That informs how much negotiation room exists.
- Crime grade is F in this area — have there been break-ins, vandalism, or insurance claims at this property in the last 3 years? What carrier currently insures it and at what premium?
- What's the average days-on-market for RENTAL listings here right now (not sales)? A rising rental-DOM trend means longer vacancies and softer asking-rent achievability than the comps imply.
- What's the recent tenant-quality profile in this submarket — average credit score on applications, eviction rate, late-payment / NSF rate, and stable-employment percentage? A property-management company in the area should have these aggregated.
- How much new for-sale + rental construction is in the pipeline within 1–3 miles? Heavy new supply typically softens prices + rents 12–24 months out; constrained supply supports both.
Investment metrics
- 1% rule
- 1.41% ✓
- Cap rate
- 10.98%
- Cash-on-cash
- 16.73%
- DSCR
- 1.74
- GRM
- 5.9
CMA / ARV
- ARV (median comp)
- $169,184
- List price
- $114,900
- Delta
- -32.09%
- Verdict
- UNDERPRICED
- Comps
- 20 within 1.0 mi
Show comp detail 12 sales within ~0.75 mi
| Address | Dist | Beds/Ba | Sqft | Sold | Price | $/sf | Match |
|---|---|---|---|---|---|---|---|
| 733 S Napoleon Ave | 0.23mi | 3/2.0 (-1) | 1,110 (-3%) | 3mo | $210,000 | $189 | 73 |
| 720 S Hampton Rd | 0.09mi | 3/2.0 (-1) | 1,233 (+8%) | 1mo | $202,000 | $164 | 73 |
| 2925 Ashby Rd | 0.55mi | 4/1.0 | 1,117 (-2%) | 0mo | $249,900 | $224 | 70 |
| 871 Ruby Ave | 0.27mi | 3/2.0 (-1) | 1,061 (-7%) | 1mo | $143,000 | $135 | 66 |
| 845 S Hampton Rd | 0.11mi | 3/1.0 (-1) | 979 (-14%) | 1mo | $120,000 | $123 | 66 |
| 884 S Chesterfield Rd | 0.61mi | 3/1.0 (-1) | 1,129 (-1%) | 2mo | $170,000 | $151 | 64 |
| 669 Brookside Dr | 0.36mi | 3/1.0 (-1) | 1,277 (+12%) | 3mo | $297,500 | $233 | 56 |
| 2963 Brownlee Ave | 0.60mi | 3/1.0 (-1) | 1,064 (-7%) | 3mo | $210,000 | $197 | 53 |
| 580 Enfield Rd | 0.49mi | 3/2.0 (-1) | 1,282 (+12%) | 1mo | $295,000 | $230 | 47 |
| 430 S James Rd | 0.49mi | 3/1.0 (-1) | 1,303 (+14%) | 2mo | $213,000 | $163 | 47 |
| 350 S Hampton Rd | 0.62mi | 3/1.0 (-1) | 1,256 (+10%) | 3mo | $110,000 | $88 | 47 |
| 1271 S Weyant Ave | 0.71mi | 4/2.0 | 1,258 (+10%) | 4mo | $259,900 | $207 | 42 |
Match score weights: distance 35% · size 25% · config 20% · recency 20%. Top-matched comps best support the ARV.
Projected returns pro-forma
-3.0% appreciation · 5.22% rent growth · sell at horizon
- IRR
- 10.5%
- Equity multiple
- 1.43×
- Total profit
- $13,688
- Equity at exit
- $17,132
- IRR
- 21.4%
- Equity multiple
- 3.01×
- Total profit
- $64,754
- Equity at exit
- $9,934
Cash invested: $32,172 (down + closing). Projections, not guarantees.
Landlord ↔ Tenant lean methodology
- Overall (STATE)
- 73 Landlord-Friendly
- State Ohio
- 73 Landlord-Friendly · R+6
- County
- — inherits STATE
- City
- — inherits STATE
ZIP-level market 43227
- Rents YoY
- 5.2%
- Active inventory
- 61
- Price-to-rent
- 5.9×
Monthly cashflow live
- Estimated rent
- $1,618 high interval (Pro) →
- Mortgage (P&I)
- −$603
- Tax from tax record
- −$179 /mo · $2,151/yr
- Insurance
- −$48
- HOA
- −$0
- Vacancy / Maint / Mgmt
- −$340
- Net cashflow
- $449
Break-even live
UW: 25.0% down · 7.5% · 30yr · 1.5% tax · 5.0% vac · 8.0% maint · 8.0% mgmt
Financing live
Cash to close
- Down payment
- $28,725
- Closing costs
- $3,447
- Reserves months
- —
- Total cash needed
- —
Loan-product check · same deal, 3 products live
Conventional
25% down · 7.5% · 30yr
- Down + closing
- —
- Monthly P&I
- —
- Monthly cashflow
- —
- DSCR
- —
- Eligible?
- —
Personal DTI + credit; lowest rate.
DSCR
20% down · 8.5% · 30yr
- Down + closing
- —
- Monthly P&I
- —
- Monthly cashflow
- —
- DSCR
- —
- Eligible?
- —
No personal income docs; deal must DSCR.
Hard money
10% down · 12.0% · 12mo
- Down + closing
- —
- Monthly P&I
- —
- Monthly cashflow
- —
- DSCR
- —
- Eligible?
- —
Short-term bridge; refi at stabilization.
Rent comps 19 comps
| Address | Beds | Baths | Sqft | Rent | $/sqft | DOM | Units | Dist |
|---|---|---|---|---|---|---|---|---|
| 857 S Waverly St Columbus, OH | 3.0 | 1.0 | 850 | $1,250 | $1.47 | 43d | 1 | 0.13mi |
| 849 Byron Ave Columbus, OH | 3.0 | 1.5 | 936 | $1,400 | $1.50 | 7d | 1 | 0.20mi |
| 914 S Weyant Ave Columbus, OH | 3.0 | 1.5 | 1089 | $1,099 | $1.01 | 17d | 1 | 0.22mi |
| 802 Ruby Ave Columbus, OH | 3.0 | 2.0 | 1004 | $1,875 | $1.87 | 43d | 1 | 0.26mi |
| 925 S Ashburton Rd Columbus, OH | 3.0 | 1.0 | 963 | $1,500 | $1.56 | 23d | 1 | 0.31mi |
| 525 S Everett Ave Columbus, OH | 3.0 | 1.0 | 1137 | $1,500 | $1.32 | 14d | 1 | 0.35mi |
| 384-386 S Napoleon Ave Columbus, OH | 3.0 | 1.5 | 1140 | $1,350 | $1.18 | 43d | 1 | 0.65mi |
| 1317 Barnett Rd Columbus, OH | 3.0 | 1.0 | 1057 | $1,299 | $1.23 | 11d | 1 | 0.79mi |
| 3855 E Mound St Columbus, OH | 3.0 | 1.0 | 1476 | $1,885 | $1.28 | 43d | 1 | 0.87mi |
| 1246 Arkwood Ave Columbus, OH | 3.0 | 1.0 | 1094 | $1,740 | $1.59 | 43d | 1 | 1.00mi |
| 26 S Hampton Rd Unit C Columbus, OH | 3.0 | 2.0 | 1500 | $1,600 | $1.07 | 43d | 1 | 1.09mi |
| 1303 Dellwood Ave Columbus, OH | 3.0 | 1.0 | 900 | $1,500 | $1.67 | 43d | 1 | 1.17mi |
| 406 Beechtree Rd Whitehall, OH | 3.0 | 1.0 | 950 | $1,300 | $1.37 | 23d | 1 | 1.19mi |
| 3486 Roswell Dr Columbus, OH | 3.0 | 2.0 | 1116 | $1,625 | $1.46 | 43d | 1 | 1.26mi |
| 68 N Waverly St Columbus, OH | 3.0 | 1.0 | 968 | $1,350 | $1.39 | 43d | 1 | 1.26mi |
| 1634 S James Rd Columbus, OH | 3.0 | 1.5 | 1120 | $1,945 | $1.74 | 43d | 1 | 1.30mi |
| 3409 Bexvie Ave Columbus, OH | 2.0–3.0 | 1.5 | 990 | $1,400 | $1.41 | 1d | 3 | 1.41mi |
| 4048 E Livingston Ave Columbus, OH | 3.0 | 1.0 | 961 | $1,000 | $1.04 | 19d | 1 | 1.42mi |
| 1728 Penfield Rd Columbus, OH | 3.0 | 1.0 | 1224 | $1,925 | $1.57 | 43d | 1 | 1.42mi |
Listing history 38 events
-
2026-06-18days on market $114,900 Active 48 DOM
-
2026-06-17days on market $114,900 Active 47 DOM
-
2026-06-16days on market $114,900 Active 46 DOM
-
2026-06-15days on market $114,900 Active 45 DOM
-
2026-06-13days on market $114,900 Active 43 DOM
-
2026-06-13days on market $114,900 Active 42 DOM
-
2026-06-09days on market $114,900 Active 39 DOM
-
2026-06-08days on market $114,900 Active 38 DOM
-
2026-06-07days on market $114,900 Active 37 DOM
-
2026-06-05days on market $114,900 Active 34 DOM
-
2026-06-03days on market $114,900 Active 33 DOM
-
2026-06-02days on market $114,900 Active 32 DOM
-
2026-06-01days on market $114,900 Active 31 DOM
-
2026-05-31days on market $114,900 Active 30 DOM
-
2026-05-01$114,900 Active 321-char remark
-
2017-05-24soldstatus $40,000 Closed 253-char remark
Show marketing remark (253 chars)
Lots of updates. Newer roof. windows in 2016, New electric hot water tank in 2017, hardwood floors on first level, dry basement, fenced yard, long term tenant and Owner Agent. (Curb offers please. .. that means No showings until offer has been accepted)
-
2017-05-18status Pending 253-char remark
Show marketing remark (253 chars)
Lots of updates. Newer roof. windows in 2016, New electric hot water tank in 2017, hardwood floors on first level, dry basement, fenced yard, long term tenant and Owner Agent. (Curb offers please. .. that means No showings until offer has been accepted)
-
2017-05-04historical Contingent Finance and Inspection 253-char remark
Show marketing remark (253 chars)
Lots of updates. Newer roof. windows in 2016, New electric hot water tank in 2017, hardwood floors on first level, dry basement, fenced yard, long term tenant and Owner Agent. (Curb offers please. .. that means No showings until offer has been accepted)
-
2017-05-01$45,000 Active 253-char remark
Show marketing remark (253 chars)
Lots of updates. Newer roof. windows in 2016, New electric hot water tank in 2017, hardwood floors on first level, dry basement, fenced yard, long term tenant and Owner Agent. (Curb offers please. .. that means No showings until offer has been accepted)
-
2016-12-15status Pending
-
2016-12-15historical
-
2016-01-06$50,000 Active
-
2015-03-25historical
-
2014-04-09$49,999
-
2008-10-15soldstatus $37,500
-
2008-10-14soldstatus $37,500
-
2008-09-24historical
-
2008-08-01$38,000
-
2006-04-28historical
-
2006-03-08$82,900
-
2005-12-15soldstatus $60,001
-
2005-11-03historical
-
2005-10-28$52,000
-
1999-01-25soldstatus $73,500
-
1999-01-22soldstatus $73,500
-
1998-11-27historical
-
1998-09-16$74,900
-
1993-07-30soldstatus $45,900
ⓘ Source: listings_history table (triggers on properties + properties_extension) + one-shot
backfill from property_details.listing_events for pre-trigger history.
Tax reassessment forecast OH · Partial reset (capped growth)
- Current annual tax
- $2,151 · $179/mo
- Projected year-2 tax
- $2,151 · $179/mo
- Expected delta
- $0/yr ($0/mo · 0.0%)
ⓘ Screening estimate from a state-policy table — verify with the county assessor before closing.
Climate risk First Street
- Flood 1/10 Low FEMA zone X (unshaded) · 0% chance over 30 yrs
- Wildfire 1/10 Low
- Heat 3/10 Moderate 7 d/yr ≥99°F today · 18 d/yr by 30 yrs out
- Wind 2/10 Low 100% chance of damaging wind over 30 yrs
- Air quality 2/10 Low 1 unhealthy d/yr today · 3 by 30 yrs out
Nearby sold comps map
Loading sold comps map…
Walkable amenities ~0.75 mi
Loading nearby amenities…
Taxation est. · year 1
- Rental income
- $19,416
- − Mortgage interest
- −$6,436
- − Property taxes
- −$2,151
- − Insurance
- −$574
- − Repairs & maintenance
- −$1,553
- − Management
- −$1,553
- − Depreciation
- −$3,343
- Taxable income
- $3,805
- Est. tax owed @ 24.0%
- −$913
- After-tax cash flow
- $4,469/yr
For passive investors: Depreciation is non-cash, so a rental often shows a tax loss while cash-flowing — sheltering income. Rental losses are passive: they offset passive income freely, and up to $25,000/yr can offset ordinary (W-2) income if you actively participate and your MAGI is under $100k (phasing out to $0 by $150k); unused losses carry forward. On sale, claimed depreciation is recaptured at up to 25%, and gains may owe capital-gains tax (a 1031 exchange can defer both). Figures are a year-1 estimate at your 24.0% rate — not tax advice; consult a CPA.
Schools (NCES district)
- District
- Columbus City School District
- NCES district ID
- 3904380
- Math proficiency
- 15% ▼ -17.00%
- Reading proficiency
- 26% ▼ -12.00%
- Median HH income
- $38,483
- Composite
- 17.19/100
- National rank
- #9105
- State rank
- #626 of 656 in OH
Livability — Columbus
- Score
- 81/100
- State rank
- #97
- US rank
- #1491
Category grades
Schools grade is shown separately in the Schools card above.
Census & demographics
- Census place
- Columbus, OH
- County
- Franklin County · 1,351,780 people
- City population
- 612,189
- Metro
- Columbus, OH
- Population (ZIP)
- 25,358
- Household income
- $48,159
- Rent vs Own
- Severe rent burden
- 1467.0
Population outlook (Franklin County) Hauer SSP2
- Today (2025)
- 1,456,139 people
- By 2030
- 1,556,890 · +6.9%
- By 2040
- 1,757,349 · +20.7%
- By 2050
- 1,950,539 · +34.0%
- By 2075
- 2,376,171 · +63.2%
- By 2100
- 2,636,796 · +81.1%
Race, ethnicity, and origin ACS 2023
- Neighborhood character
- Majority Black (63%)
- Race & ethnicity
- Black 63% White 23% Hispanic / Latino 9% Two or more races 5%
- Hispanic origin (detail)
- Mexican 3%
- Common ancestry
- Swiss 1% Slovak 1%
- Foreign-born
- 11% · Canada
- Languages at home
- 87% English-only · Spanish 7% French/Haitian/Cajun 1%
Political lean MEDSL · Franklin
- 2024 margin
- Strong D (+28.4) · D 63.7% · R 35.3% · Other 1.0%
- 2008→2024 swing
- +7.7pp toward D · 2008: 20.7pp · 2024: 28.4pp
- All cycles
- 2024: D+28.4 2020: D+31.4 2016: D+25.9 2012: D+21.7 2008: D+20.7
Not yet ingested
- Civics
- —
Market trends
- HPI YoY
- ▼ -193.50%
- Current HPI
- 301.3767
- Rent YoY
- ▲ 5.22%
- Metro
- Columbus, OH
- State GDP YoY
- ▲ 1.98%
- F500 in state
- 48
Industry mix (Fortune 500 HQ in OH)
| Industry | F500 HQs | Revenue |
|---|---|---|
| Insurance | 3 | $145B |
|
||
| Industrial Machinery | 3 | $49B |
|
||
| Financial Services | 3 | $24B |
|
||
| Consumer Goods | 2 | $93B |
|
||
| Aerospace / Defense | 2 | $47B |
|
||
| Utilities | 2 | $33B |
|
||
Price history
+150.3% since first listed24 events — show timeline
- 2026-05-01 Listed $114,900 CBRMLS
- 2017-05-24 Sold (MLS) $40,000 CBRMLS
- 2017-05-18 Pending — CBRMLS
- 2017-05-04 Contingent — CBRMLS
- 2017-05-01 Listed $45,000 CBRMLS
- 2016-12-15 Pending — CBRMLS
- 2016-12-15 Listing Removed — CBRMLS
- 2016-01-06 Listed $50,000 CBRMLS
- 2015-03-25 Listing Removed — CBRMLS
- 2014-04-09 Listed $49,999 CBRMLS
- 2008-10-15 Sold (Public Records) $37,500 Public Records
- 2008-10-14 Sold (MLS) $37,500 CBRMLS
- 2008-09-24 Listing Removed — CBRMLS
- 2008-08-01 Listed $38,000 CBRMLS
- 2006-04-28 Listing Removed — CBRMLS
- 2006-03-08 Listed $82,900 CBRMLS
- 2005-12-15 Sold (MLS) $60,001 CBRMLS
- 2005-11-03 Listing Removed — CBRMLS
- 2005-10-28 Listed $52,000 CBRMLS
- 1999-01-25 Sold (Public Records) $73,500 Public Records
- 1999-01-22 Sold (MLS) $73,500 CBRMLS
- 1998-11-27 Listing Removed — CBRMLS
- 1998-09-16 Listed $74,900 CBRMLS
- 1993-07-30 Sold (Public Records) $45,900 Public Records
Property tax history
+6.4%/yrLatest (2024): $2,151 · +1.3% YoY. Source: county tax records.
Cash-flow waterfall
monthlySold comps — $/sqft
last 12 mo · ≤1 miLoading sold comps…