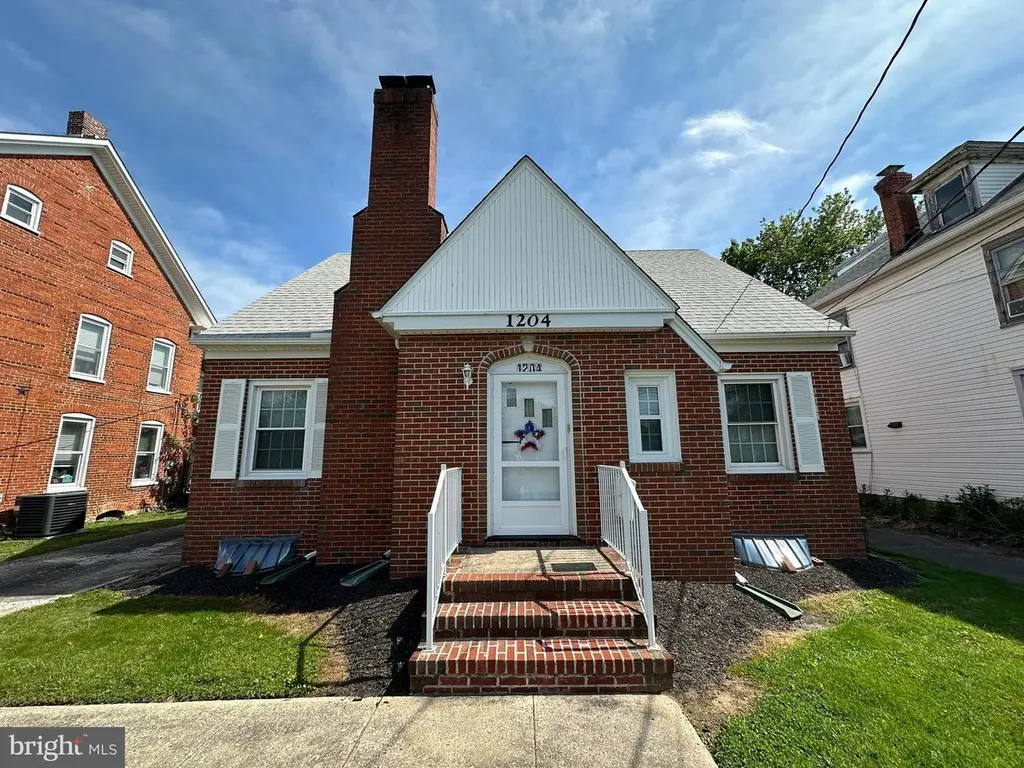
1204 Virginia Ave · Halfway, MD
Flood risk 1/10 · Minimal
- FEMA flood zone
- X (unshaded)
- Chance of flooding over 30 yrs
- 0.0%
- Est. flood insurance / yr
- $473 – $860
Fire risk 1/10 · Minimal
- Est. fire insurance / yr
- $755 – $1,403
Heat risk 5/10 · Moderate
- Hot days now (above 101°F)
- 7 days/yr
- Hot days in 30 yrs
- 16 days/yr
Wind risk 2/10 · Minimal
- Chance of severe wind over 30 yrs
- 3.0%
Air-quality risk 2/10 · Minimal
- Unhealthy air days now
- 1 days/yr
- Unhealthy air days in 30 yrs
- 2 days/yr
Risk factors via First Street. Map © Google.
Why this score? — see what drove the C- grade
The composite is a weighted blend of 9 inputs, each scored 0–100. Each bar is that input's sub-score; the figure is the points it added to the 100-point composite (weight × sub-score).
- Cash flow +15.7/30.0
- ARV discount +15.0/15.0
- DSCR +4.8/10.0
- 1% rule +3.6/10.0
- Rent growth +3.5/5.0
- Livability +3.3/5.0
- Condition / age +2.5/5.0
- Schools +2.3/10.0
- Appreciation +0.0/10.0
$259,000
🖨 Deal sheet 📄 Offer letter ✓ Due diligence
Listing remarks
NICE BRICK ENGLISH COTTAGE STYLE HOME IN HAGERSTOWN, MD! This charming home has remained in the same family since it was built! The home features 4 bedrooms, 2 full bathrooms, a living room with fireplace, kitchen, and a full basement. Hardwood floors extend throughout the home! Outside, enjoy convenient driveway access from Virginia Ave, as well as additional access from the rear alley to a spacious driveway with room for multiple vehicles. There is also a detached 2-car garage. Both the house roof and garage roof were replaced in 2016! Excellent location just minutes from I-81, I-70, shopping, recreation, and more! With some modifications, the property also offers duplex potential. Come m
Key facts
- 0.28 acre lot
- 2 garage spots
- Built 1953
Property features AI
Exterior
- Parking: Detached 2-car garage with additional storage area; Covered parking; Paved driveway
- Utilities: Public water; Public sewer; Electric hot water
- Home design: Detached property; Year built per assessor (year source available)
- Construction: Brick construction; Block foundation
- Exterior features: Detached structure; Above-grade and below-grade structures noted; No tidal water
Interior
- Kitchen: Kitchen (appliances not specified)
- Bedrooms: Two main-level bedrooms; Two upper-level bedrooms
- Bathrooms: Two full bathrooms (one on main level, one on upper level)
- Heating & cooling: Forced air heating (oil fuel); Central air conditioning (electric)
- Interior features: Full, unfinished basement; One fireplace
- Laundry & utility: Finished and unfinished below-grade space (basement utility potential)
Neighborhood map
What this means for you Summary
Snapshot
- This is a 4-bed/2.0-bath single-family listed at $259k.
Deal economics
- At list price, monthly cash flow is $115 ($1k/yr) — positive.
- The deal already cash-flows at list — no discount required.
- To meet the 1% rule (rent ≥ 1% of price), the offer needs to be $222k (14.3% below list).
- Recommended offer: $222k (14.3% below list) — sets the bar for 1% rule.
- Cap rate 6.8% vs local median 4.8% in Halfway — top-decile yield for the area; either an underpriced asset or a hidden risk that comps aren't pricing in. Stress-test before assuming the spread holds.
Location & tenants
- Location reads 66/100 on livability (#225 in MD) — a middle-class / working-renter tenant base. Strengths: housing A+, cost of living A, employment A-; Watch: schools C-, crime F, amenities F.
- Washingtion County Public Schools (suburban): math 18% / reading 33% proficiency, ranked #13 of 24 in MD (top 54%) — low school quality limits family demand, transient renter base, plan for 1-2y turnover.
- Market conditions: Rents rising fast (+4.0%/yr); 368 active listings in the ZIP; 14 comparable units currently listed for rent nearby; rentals at typical pace (median 21d on market — plan ~3-4 weeks tenant-placement turnaround); 232 units permitted in Washington County in 2024 (12 in 5+ unit buildings).
- This rent runs 42% of the median local income ($63k/yr) — at the standard rent-burdened threshold; future hikes will face affordability resistance.
Forward outlook
- Local home prices are declining (-3.0%/yr); year-one equity from $2k of loan paydown is wiped out by about $8k of value loss. Plan a longer hold.
Negotiation context
- It's been on market 15 days — a 2% lower offer ($255k) is reasonable based on typical stale-listing flexibility.
Risks & watch-outs
- Watch-outs: built in 1953 — expect roof / HVAC / electrical / plumbing capex.
- Climate carrying-cost: extreme-heat days projected 7→16/yr by 2055 (HVAC capex compounding) — expect insurance premiums to compound above CPI over the hold.
Questions for the listing agent
- Built in 1953 — when were the roof, HVAC, electrical panel, plumbing, and water heater last replaced?
- Is there a deadline driving the sale (1031 exchange, divorce, estate, relocation)? That informs how much negotiation room exists.
- Crime grade is F in this area — have there been break-ins, vandalism, or insurance claims at this property in the last 3 years? What carrier currently insures it and at what premium?
- What's the average days-on-market for RENTAL listings here right now (not sales)? A rising rental-DOM trend means longer vacancies and softer asking-rent achievability than the comps imply.
- What's the recent tenant-quality profile in this submarket — average credit score on applications, eviction rate, late-payment / NSF rate, and stable-employment percentage? A property-management company in the area should have these aggregated.
- How much new for-sale + rental construction is in the pipeline within 1–3 miles? Heavy new supply typically softens prices + rents 12–24 months out; constrained supply supports both.
Investment metrics
- 1% rule
- 0.86% ✗
- Cap rate
- 6.83%
- Cash-on-cash
- 1.90%
- DSCR
- 1.08
- GRM
- 9.7
CMA / ARV
- ARV (median comp)
- $363,973
- List price
- $259,000
- Delta
- -28.84%
- Verdict
- UNDERPRICED
- Comps
- 20 within 1.0 mi
Show comp detail 12 sales within ~0.75 mi
| Address | Dist | Beds/Ba | Sqft | Sold | Price | $/sf | Match |
|---|---|---|---|---|---|---|---|
| 645 Armstrong Ave | 0.15mi | 4/2.0 | 1,698 (+9%) | 1mo | $385,990 | $227 | 77 |
| 17832 Virginia Ave | 0.32mi | 3/1.5 (-1) | 1,540 (-1%) | 2mo | $275,000 | $179 | 75 |
| 652 Armstrong Ave | 0.18mi | 4/2.0 | 1,698 (+9%) | 4mo | $413,990 | $244 | 73 |
| 672 Armstrong Ave | 0.11mi | 4/2.0 | 1,698 (+9%) | 9mo | $424,990 | $250 | 72 |
| 1110 Moller Ave | 0.13mi | 3/3.0 (-1) | 1,466 (-6%) | 8mo | $280,000 | $191 | 69 |
| 11525 Englewood Rd | 0.57mi | 4/2.0 | 1,608 (+3%) | 6mo | $323,000 | $201 | 63 |
| 11461 Englewood Rd | 0.51mi | 4/2.0 | 1,634 (+5%) | 10mo | $270,000 | $165 | 60 |
| 11540 Englewood Rd | 0.63mi | 3/1.0 (-1) | 1,573 (+1%) | 6mo | $275,000 | $175 | 55 |
| 712 Sunset Ave | 0.72mi | 3/1.0 (-1) | 1,614 (+4%) | 4mo | $228,000 | $141 | 48 |
| 11516 Dellwyn Dr | 0.63mi | 4/1.5 | 1,763 (+13%) | 10mo | $349,233 | $198 | 39 |
| 324 W Howard St | 0.73mi | 3/2.5 (-1) | 1,342 (-14%) | 5mo | $300,000 | $224 | 32 |
| 11115 Glenside Ave | 0.73mi | 3/1.0 (-1) | 1,401 (-10%) | 10mo | $255,000 | $182 | 31 |
Match score weights: distance 35% · size 25% · config 20% · recency 20%. Top-matched comps best support the ARV.
Projected returns pro-forma
-3.0% appreciation · 4.0% rent growth · sell at horizon
- IRR
- -12.3%
- Equity multiple
- 0.55×
- Total profit
- $-32,442
- Equity at exit
- $38,618
- IRR
- -1.9%
- Equity multiple
- 0.87×
- Total profit
- $-9,601
- Equity at exit
- $22,394
Cash invested: $72,520 (down + closing). Projections, not guarantees.
Landlord ↔ Tenant lean methodology
- Overall (STATE)
- 27 Tenant-Leaning
- State Maryland
- 27 Tenant-Leaning · D+14
- County
- — inherits STATE
- City
- — inherits STATE
ZIP-level market 21740
- Rents YoY
- 4.0%
- Active inventory
- 368
- Price-to-rent
- 9.7×
Monthly cashflow live
- Estimated rent
- $2,221 high interval (Pro) →
- Mortgage (P&I)
- −$1,358
- Tax from tax record
- −$173 /mo · $2,078/yr
- Insurance
- −$108
- HOA
- −$0
- Vacancy / Maint / Mgmt
- −$466
- Net cashflow
- $115
Break-even live
UW: 25.0% down · 7.5% · 30yr · 1.5% tax · 5.0% vac · 8.0% maint · 8.0% mgmt
Financing live
Cash to close
- Down payment
- $64,750
- Closing costs
- $7,770
- Reserves months
- —
- Total cash needed
- —
Loan-product check · same deal, 3 products live
Conventional
25% down · 7.5% · 30yr
- Down + closing
- —
- Monthly P&I
- —
- Monthly cashflow
- —
- DSCR
- —
- Eligible?
- —
Personal DTI + credit; lowest rate.
DSCR
20% down · 8.5% · 30yr
- Down + closing
- —
- Monthly P&I
- —
- Monthly cashflow
- —
- DSCR
- —
- Eligible?
- —
No personal income docs; deal must DSCR.
Hard money
10% down · 12.0% · 12mo
- Down + closing
- —
- Monthly P&I
- —
- Monthly cashflow
- —
- DSCR
- —
- Eligible?
- —
Short-term bridge; refi at stabilization.
Rent comps 14 comps
| Address | Beds | Baths | Sqft | Rent | $/sqft | DOM | Units | Dist |
|---|---|---|---|---|---|---|---|---|
| 672 Armstrong Ave Hagerstown, MD | 4.0 | 2.0 | 1698 | $2,680 | $1.58 | 20d | 1 | 0.12mi |
| 1527 Sherman Ave Unit 2 Hagerstown, MD | 3.0 | 2.5 | 1496 | $2,100 | $1.40 | 20d | 1 | 0.37mi |
| 1529 Sherman Ave Unit 1 Hagerstown, MD | 3.0 | 2.5 | 1496 | $2,100 | $1.40 | 20d | 1 | 0.37mi |
| 837 Virginia Ave Hagerstown, MD | 3.0 | 2.0 | 1400 | $2,000 | $1.43 | 13d | 1 | 0.54mi |
| 39 W Wilson Blvd Hagerstown, MD | 3.0 | 2.0 | 1440 | $1,730 | $1.20 | 20d | 1 | 0.72mi |
| 17940 Garden Ln Hagerstown, MD | 1.0–3.0 | 1.0–2.0 | 1020 | $1,706 | $1.67 | 13d | 19 | 0.86mi |
| 909 Corbett St Hagerstown, MD | 3.0 | 2.5 | 1276 | $2,695 | $2.11 | 13d | 1 | 0.97mi |
| 10924 Gaywood Dr Hagerstown, MD | 3.0 | 1.0 | 1100 | $2,000 | $1.82 | 20d | 1 | 1.08mi |
| 409 Gandy Dancer Ct Hagerstown, MD | 4.0 | 3.5 | 2112 | $2,350 | $1.11 | 20d | 1 | 1.29mi |
| 409 Gandy Dancer Ct Unit 409 Hagerstown, MD | 4.0 | 3.5 | 2112 | $2,350 | $1.11 | 43d | 1 | 1.29mi |
| 338 S Locust St Hagerstown, MD | 3.0 | 1.5 | 1320 | $1,600 | $1.21 | 20d | 1 | 1.34mi |
| 612 Frederick St Hagerstown, MD | 4.0 | 2.0 | 1422 | $1,875 | $1.32 | 20d | 1 | 1.49mi |
| 313 Frederick St Unit 313 Hagerstown, MD | 3.0 | 1.5 | 1650 | $2,500 | $1.52 | 43d | 1 | 1.49mi |
| 313 Frederick St Hagerstown, MD | 3.0 | 1.5 | 1650 | $2,500 | $1.52 | 43d | 1 | 1.49mi |
Listing history 17 events
-
2026-06-18days on market $259,000 Active 15 DOM
-
2026-06-17days on market $259,000 Active 14 DOM
-
2026-06-16days on market $259,000 Active 13 DOM
-
2026-06-15price $259,000 Active 12 DOM
-
2026-06-15days on market $279,000 Active 12 DOM
-
2026-06-14days on market $279,000 Active 10 DOM
-
2026-06-13days on market $279,000 Active 9 DOM
-
2026-06-10days on market $279,000 Active 7 DOM
-
2026-06-09days on market $279,000 Active 6 DOM
-
2026-06-08days on market $279,000 Active 5 DOM
-
2026-06-07statusdays on market $279,000 Active 4 DOM
-
2026-06-03days on market $279,000 Coming Soon 26 DOM
-
2026-06-02days on market $279,000 Coming Soon 25 DOM
-
2026-06-01days on market $279,000 Coming Soon 24 DOM
-
2026-05-31days on market $279,000 Coming Soon 23 DOM
-
2026-05-30days on market $279,000 Coming Soon 22 DOM
-
2026-05-08historical $279,000 877-char remark
ⓘ Source: listings_history table (triggers on properties + properties_extension) + one-shot
backfill from property_details.listing_events for pre-trigger history.
Tax reassessment forecast MD · Partial reset (capped growth)
- Current annual tax
- $2,078 · $173/mo
- Projected year-2 tax
- $2,451 · $204/mo
- Expected delta
- +$373/yr (+$31/mo · 17.9%)
ⓘ Screening estimate from a state-policy table — verify with the county assessor before closing.
Climate risk First Street
- Flood 1/10 Low FEMA zone X (unshaded) · 0% chance over 30 yrs
- Wildfire 1/10 Low
- Heat 5/10 Major 7 d/yr ≥101°F today · 16 d/yr by 30 yrs out
- Wind 2/10 Low 3% chance of damaging wind over 30 yrs
- Air quality 2/10 Low 1 unhealthy d/yr today · 2 by 30 yrs out
Nearby sold comps map
Loading sold comps map…
Walkable amenities ~0.75 mi
Loading nearby amenities…
Taxation est. · year 1
- Rental income
- $26,649
- − Mortgage interest
- −$14,508
- − Property taxes
- −$2,078
- − Insurance
- −$1,295
- − Repairs & maintenance
- −$2,132
- − Management
- −$2,132
- − Depreciation
- −$7,535
- Taxable loss
- −$3,030
- Est. tax savings @ 24.0%
- +$727
- After-tax cash flow
- $2,108/yr
For passive investors: Depreciation is non-cash, so a rental often shows a tax loss while cash-flowing — sheltering income. Rental losses are passive: they offset passive income freely, and up to $25,000/yr can offset ordinary (W-2) income if you actively participate and your MAGI is under $100k (phasing out to $0 by $150k); unused losses carry forward. On sale, claimed depreciation is recaptured at up to 25%, and gains may owe capital-gains tax (a 1031 exchange can defer both). Figures are a year-1 estimate at your 24.0% rate — not tax advice; consult a CPA.
Schools (NCES district)
- District
- Washingtion County Public Schools
- NCES district ID
- 2400660
- Math proficiency
- 18% ▼ -20.00%
- Reading proficiency
- 33% ▼ -17.00%
- Median HH income
- $54,784
- Composite
- 22.87/100
- National rank
- #8007
- State rank
- #13 of 24 in MD
Livability — Halfway
- Score
- 66/100
- State rank
- #225
- US rank
- #11296
Category grades
Schools grade is shown separately in the Schools card above.
Census & demographics
- Census place
- Halfway, MD
- County
- Washington County · 98,861 people
- Metro
- Hagerstown-Martinsburg, MD-WV
- Population (ZIP)
- 64,792
- Household income
- $62,873
- Rent vs Own
- Severe rent burden
- 2832.0
Population outlook (Washington County) Hauer SSP2
- Today (2025)
- 151,614 people
- By 2030
- 151,455 · -0.1%
- By 2040
- 150,097 · -1.0%
- By 2050
- 148,193 · -2.3%
- By 2075
- 146,581 · -3.3%
- By 2100
- 138,025 · -9.0%
Race, ethnicity, and origin ACS 2023
- Neighborhood character
- Majority White (64%)
- Race & ethnicity
- White 64% Black 18% Two or more races 10% Hispanic / Latino 10% Asian 2%
- Hispanic origin (detail)
- Mexican 2% Puerto Rican 2% Dominican 2%
- Common ancestry
- Romanian 2% Lithuanian 1% Slovak 1%
- Foreign-born
- 9% · Canada, China
- Languages at home
- 86% English-only · Spanish 9% French/Haitian/Cajun 1% Chinese 1%
Political lean MEDSL · Washington
- 2024 margin
- Strong R (+23.0) · D 37.3% · R 60.4% · Other 2.3%
- 2008→2024 swing
- -10.2pp toward R · 2008: -12.9pp · 2024: -23.0pp
- All cycles
- 2024: R+23.0 2020: R+20.9 2016: R+32.4 2012: R+18.5 2008: R+12.9
Not yet ingested
- Civics
- —
Market trends
- HPI YoY
- ▼ -248.38%
- Current HPI
- 264.8018
- Rent YoY
- ▲ 4.00%
- Metro
- Hagerstown-Martinsburg, MD-WV
- State GDP YoY
- ▲ 2.97%
- F500 in state
- 12
Industry mix (Fortune 500 HQ in MD)
| Industry | F500 HQs | Revenue |
|---|---|---|
| Aerospace / Defense | 1 | $71B |
|
||
| Utilities | 1 | $25B |
|
||
| Hotels | 1 | $24B |
|
||
| Consumer Goods | 1 | $7B |
|
||
| Real Estate | 1 | $6B |
|
||
| Chemicals | 1 | $2B |
|
||
Price history
-7.2% since first listed3 events — show timeline
- 2026-06-15 Price Changed $259,000 BRIGHT MLS
- 2026-06-04 Listed $279,000 BRIGHT MLS
- 2026-05-08 Coming Soon $279,000 BRIGHT MLS
Property tax history
+1.2%/yrLatest (2025): $2,078 · +8.6% YoY. Source: county tax records.
Cash-flow waterfall
monthlySold comps — $/sqft
last 12 mo · ≤1 miLoading sold comps…