4640 Whitefish Pl · Hornbrook, CA
Flood risk 10/10 · Severe
- FEMA flood zone
- A
- Chance of flooding over 30 yrs
- 0.99%
- Est. flood insurance / yr
- $1,009 – $1,996
Fire risk 7/10 · Major
- Est. fire insurance / yr
- $659 – $1,223
Heat risk 6/10 · Moderate
- Hot days now (above 97°F)
- 8 days/yr
- Hot days in 30 yrs
- 19 days/yr
Wind risk 1/10 · Minimal
- Chance of severe wind over 30 yrs
- —
Air-quality risk 10/10 · Severe
- Unhealthy air days now
- 32 days/yr
- Unhealthy air days in 30 yrs
- 34 days/yr
Risk factors via First Street. Map © Google.
Why this score? — see what drove the B- grade
The composite is a weighted blend of 9 inputs, each scored 0–100. Each bar is that input's sub-score; the figure is the points it added to the 100-point composite (weight × sub-score).
- Cash flow +24.9/30.0
- ARV discount +14.5/15.0
- DSCR +8.1/10.0
- 1% rule +5.8/10.0
- Appreciation +4.8/10.0
- Schools +3.9/10.0
- Rent growth +2.5/5.0
- Condition / age +2.5/5.0
- Livability +2.4/5.0
$112,000
🖨 Deal sheet 📄 Offer letter ✓ Due diligence
Listing remarks
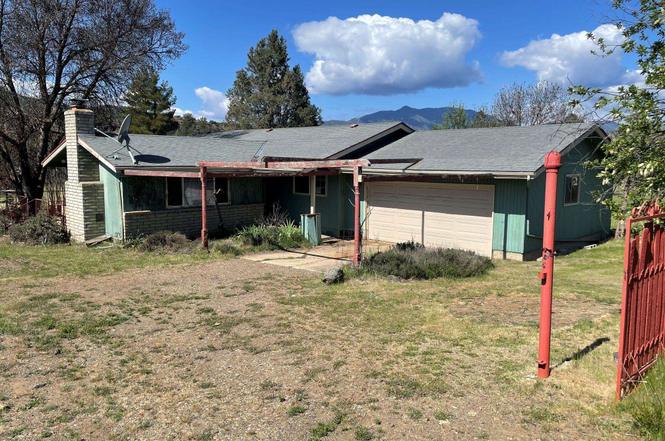
Looking for a diamond in the rough? This could be the one! Nestled on 1.1 acres in the Klamath River Country Estates, this property offers a peaceful setting where you can relax to the soothing sounds of the scenic Klamath River. With only a strip of HOA land between you and the river, you’ll enjoy the feel of riverfront living without the premium price. Ideally located near the entrance to community amenities, this parcel provides convenient access to river entry, a residents’ swimming pool, and an on-site fee campground—perfect for hosting friends and family or enjoying weekend getaways close to home. Bring your vision and make this hidden gem your own!
Key facts
- 1.1 acres
- Community amenities
- Riverfront living
Tags
Property features AI
Exterior
- Parking: Attached 2-car garage
- Utilities: Private well water; Septic tank
- Home design: Single-family residence; One story
- Construction: Wood siding; Composition roof
- Exterior features: Deck; Level lot; Zoned RR
Interior
- Kitchen: Cooktop; Dishwasher; Double oven
- Interior features: Cooktop; Dishwasher; Double oven
Neighborhood map
What this means for you Summary
Snapshot
- This is a 2-bed/2.0-bath single-family listed at $112k.
Deal economics
- At list price, monthly cash flow is $114 ($1k/yr) — positive.
- The deal already cash-flows at list — no discount required.
- Meets the 1% rule at list price ($1k rent vs $112k).
- Recommended offer: $102k (9.0% below list) — sets the bar for market timing.
Location & tenants
- Location reads 47/100 on livability (#1,256 in CA) — a working-class tenant base; expect higher turnover. Strengths: crime A; Watch: schools F, amenities F, commute F.
- Yreka Union High (town): math 25% / reading 65% proficiency, ranked #630 of 1,400 in CA (top 45%) — families likely to look elsewhere, expect single-tenant / working-renter base with shorter leases.
- Market conditions: 87 active listings in the ZIP; 50 units permitted in Siskiyou County in 2024 (0 in 5+ unit buildings).
Forward outlook
- In year one you build about $231 of equity ($774 loan paydown + $-543 appreciation (-0.5% local appreciation)).
- Siskiyou County population projected at -26% by 2050 — secular population decline; favor cash flow + early exit over multi-decade hold.
- At projected returns (-0.5% appreciation + 3.0% rent growth), your $31k cash investment doubles in ~10 years — after that, you're playing with house money.
Negotiation context
- It's been on market 118 days — a 9% lower offer ($102k) is reasonable based on typical stale-listing flexibility.
Risks & watch-outs
- Watch-outs: flood insurance adds $125/mo.
- Climate carrying-cost: in FEMA flood zone A (mandatory federal flood insurance); major wildfire risk; extreme-heat days projected 8→19/yr by 2055 (HVAC capex compounding) — expect insurance premiums to compound above CPI over the hold.
Questions for the listing agent
- It's been on market 118 days. Have you received any prior offers? Is the seller open to a 9% concession, seller financing, or rate buy-down credit?
- Built in 1970 — when were the roof, HVAC, electrical panel, plumbing, and water heater last replaced?
- What's the actual annual flood-insurance premium (NFIP or private), and is the property in a SFHA with mandatory coverage?
- Why hasn't it sold? Are there any deal-killer items the seller is aware of (foundation, flood, title, zoning, code violations)?
- Is there a deadline driving the sale (1031 exchange, divorce, estate, relocation)? That informs how much negotiation room exists.
- Schools are F-rated, which usually means shorter tenancies and higher turnover. Who's the typical renter profile here, and what's been the actual vacancy rate?
- What's the average days-on-market for RENTAL listings here right now (not sales)? A rising rental-DOM trend means longer vacancies and softer asking-rent achievability than the comps imply.
- What's the recent tenant-quality profile in this submarket — average credit score on applications, eviction rate, late-payment / NSF rate, and stable-employment percentage? A property-management company in the area should have these aggregated.
- How much new for-sale + rental construction is in the pipeline within 1–3 miles? Heavy new supply typically softens prices + rents 12–24 months out; constrained supply supports both.
Investment metrics
- 1% rule
- 1.08% ✓
- Cap rate
- 8.86%
- Cash-on-cash
- 9.15%
- DSCR
- 1.41
- GRM
- 7.7
CMA / ARV
- ARV (on-the-fly)
- $132,610
- Comps found
- 1
Show comp detail 1 sale within ~0.75 mi
| Address | Dist | Beds/Ba | Sqft | Sold | Price | $/sf | Match |
|---|---|---|---|---|---|---|---|
| 4510 Copco Rd | 0.13mi | 3/2.0 (+1) | 1,400 (-6%) | 23mo | $124,500 | $89 | 60 |
Match score weights: distance 35% · size 25% · config 20% · recency 20%. Top-matched comps best support the ARV.
Projected returns pro-forma
-0.48% appreciation · 3.0% rent growth · sell at horizon
- IRR
- 1.1%
- Equity multiple
- 1.05×
- Total profit
- $1,521
- Equity at exit
- $29,834
- IRR
- 7.1%
- Equity multiple
- 1.73×
- Total profit
- $22,824
- Equity at exit
- $33,783
Cash invested: $31,360 (down + closing). Projections, not guarantees.
Landlord ↔ Tenant lean methodology
- Overall (STATE)
- 18 Strongly Tenant-Friendly
- State California
- 18 Strongly Tenant-Friendly · D+13
- County
- — inherits STATE
- City
- — inherits STATE
ZIP-level market 96044
- Home prices YoY
- -0.3%
- Active inventory
- 87
- Price-to-rent
- 7.7×
Monthly cashflow live
- Estimated rent
- $1,212 medium interval (Pro) →
- Mortgage (P&I)
- −$587
- Tax from tax record
- −$84 /mo · $1,007/yr
- Insurance
- −$47
- Flood insurance flood zone
- −$125 /mo · $1,502/yr
- HOA
- −$0
- Vacancy / Maint / Mgmt
- −$254
- Net cashflow
- $114
Break-even live
UW: 25.0% down · 7.5% · 30yr · 1.5% tax · 5.0% vac · 8.0% maint · 8.0% mgmt
Financing live
Cash to close
- Down payment
- $28,000
- Closing costs
- $3,360
- Reserves months
- —
- Total cash needed
- —
Loan-product check · same deal, 3 products live
Conventional
25% down · 7.5% · 30yr
- Down + closing
- —
- Monthly P&I
- —
- Monthly cashflow
- —
- DSCR
- —
- Eligible?
- —
Personal DTI + credit; lowest rate.
DSCR
20% down · 8.5% · 30yr
- Down + closing
- —
- Monthly P&I
- —
- Monthly cashflow
- —
- DSCR
- —
- Eligible?
- —
No personal income docs; deal must DSCR.
Hard money
10% down · 12.0% · 12mo
- Down + closing
- —
- Monthly P&I
- —
- Monthly cashflow
- —
- DSCR
- —
- Eligible?
- —
Short-term bridge; refi at stabilization.
Listing history 19 events
-
2026-06-19days on market $112,000 Active 118 DOM
-
2026-06-18days on market $112,000 Active 117 DOM
-
2026-06-17days on market $112,000 Active 116 DOM
-
2026-06-16days on market $112,000 Active 115 DOM
-
2026-06-15days on market $112,000 Active 114 DOM
-
2026-06-14days on market $112,000 Active 112 DOM
-
2026-06-12pricedays on market $112,000 Active 111 DOM
-
2026-06-09days on market $148,500 Active 108 DOM
-
2026-06-08days on market $148,500 Active 107 DOM
-
2026-06-07days on market $148,500 Active 106 DOM
-
2026-06-05days on market $148,500 Active 104 DOM
-
2026-06-04days on market $148,500 Active 102 DOM
-
2026-06-02days on market $148,500 Active 101 DOM
-
2026-06-01days on market $148,500 Active 100 DOM
-
2026-05-31days on market $148,500 Active 99 DOM
-
2026-05-31days on market $148,500 Active 98 DOM
-
2026-04-27price $148,500
-
2026-03-30price $156,750
-
2026-02-21$165,000 Active
ⓘ Source: listings_history table (triggers on properties + properties_extension) + one-shot
backfill from property_details.listing_events for pre-trigger history.
Tax reassessment forecast CA · Resets to sale price
- Current annual tax
- $1,007 · $84/mo
- Projected year-2 tax
- $1,007 · $84/mo
- Expected delta
- $0/yr ($0/mo · 0.0%)
ⓘ Screening estimate from a state-policy table — verify with the county assessor before closing.
Climate risk First Street
- Flood 10/10 Extreme FEMA zone A · 99% chance over 30 yrs
- Wildfire 7/10 Severe
- Heat 6/10 Major 8 d/yr ≥97°F today · 19 d/yr by 30 yrs out
- Wind 1/10 Low
- Air quality 10/10 Extreme 32 unhealthy d/yr today · 34 by 30 yrs out
Nearby sold comps map
Loading sold comps map…
Walkable amenities ~0.75 mi
Loading nearby amenities…
Taxation est. · year 1
- Rental income
- $14,539
- − Mortgage interest
- −$6,274
- − Property taxes
- −$1,007
- − Insurance
- −$2,062
- − Repairs & maintenance
- −$1,163
- − Management
- −$1,163
- − Depreciation
- −$3,258
- Taxable loss
- −$389
- Est. tax savings @ 24.0%
- +$93
- After-tax cash flow
- $1,462/yr
For passive investors: Depreciation is non-cash, so a rental often shows a tax loss while cash-flowing — sheltering income. Rental losses are passive: they offset passive income freely, and up to $25,000/yr can offset ordinary (W-2) income if you actively participate and your MAGI is under $100k (phasing out to $0 by $150k); unused losses carry forward. On sale, claimed depreciation is recaptured at up to 25%, and gains may owe capital-gains tax (a 1031 exchange can defer both). Figures are a year-1 estimate at your 24.0% rate — not tax advice; consult a CPA.
Schools (NCES district)
- District
- Yreka Union High
- NCES district ID
- 0643410
- Math proficiency
- 25% ▼ -15.00%
- Reading proficiency
- 65% ▬ 0.00%
- Median HH income
- $34,206
- Composite
- 39.28/100
- National rank
- #8184
- State rank
- #630 of 1400 in CA
Livability — Hornbrook
- Score
- 47/100
- State rank
- #1256
- US rank
- #26373
Category grades
Schools grade is shown separately in the Schools card above.
Census & demographics
- Population (ZIP)
- 1,181
Population outlook (Siskiyou County) Hauer SSP2
- Today (2025)
- 39,337 people
- By 2030
- 36,930 · -6.1%
- By 2040
- 32,367 · -17.7%
- By 2050
- 29,030 · -26.2%
- By 2075
- 23,534 · -40.2%
- By 2100
- 19,312 · -50.9%
Race, ethnicity, and origin ACS 2023
- Neighborhood character
- Predominantly White (68%)
- Race & ethnicity
- White 68% Two or more races 24% Hispanic / Latino 10% Asian 3% Native American 2%
- Hispanic origin (detail)
- Mexican 5% Puerto Rican 3% Cuban 1%
- Common ancestry
- Italian 3% Russian 2% Slovak 1%
- Foreign-born
- 7% · Canada
- Languages at home
- 95% English-only · Spanish 4% Russian/Polish/Slavic 1%
Political lean MEDSL · Siskiyou
- 2024 margin
- R (+19.2) · D 38.8% · R 58.0% · Other 3.2%
- 2008→2024 swing
- -8.8pp toward R · 2008: -10.4pp · 2024: -19.2pp
- All cycles
- 2024: R+19.2 2020: R+15.8 2016: R+20.7 2012: R+15.6 2008: R+10.4
Not yet ingested
- Civics
- —
Market trends
- HPI YoY
- ▼ -0.48%
- Current HPI
- 175.8263
- Rent YoY
- —
- Metro
- —
- State GDP YoY
- ▲ 3.21%
- F500 in state
- 116
Industry mix (Fortune 500 HQ in CA)
| Industry | F500 HQs | Revenue |
|---|---|---|
| Technology | 27 | $1,492B |
|
||
| Financial Services | 3 | $174B |
|
||
| Retail | 3 | $44B |
|
||
| Insurance | 3 | $26B |
|
||
| Media / Entertainment | 2 | $115B |
|
||
| Pharmaceuticals / Biotech | 2 | $62B |
|
||
Price history
-10.0% since first listed3 events — show timeline
- 2026-04-27 Price Changed $148,500 SMLS
- 2026-03-30 Price Changed $156,750 SMLS
- 2026-02-21 Listed $165,000 SMLS
Property tax history
+1.4%/yrLatest (2025): $1,007 · -4.4% YoY. Source: county tax records.
Cash-flow waterfall
monthlySold comps — $/sqft
last 12 mo · ≤1 miLoading sold comps…