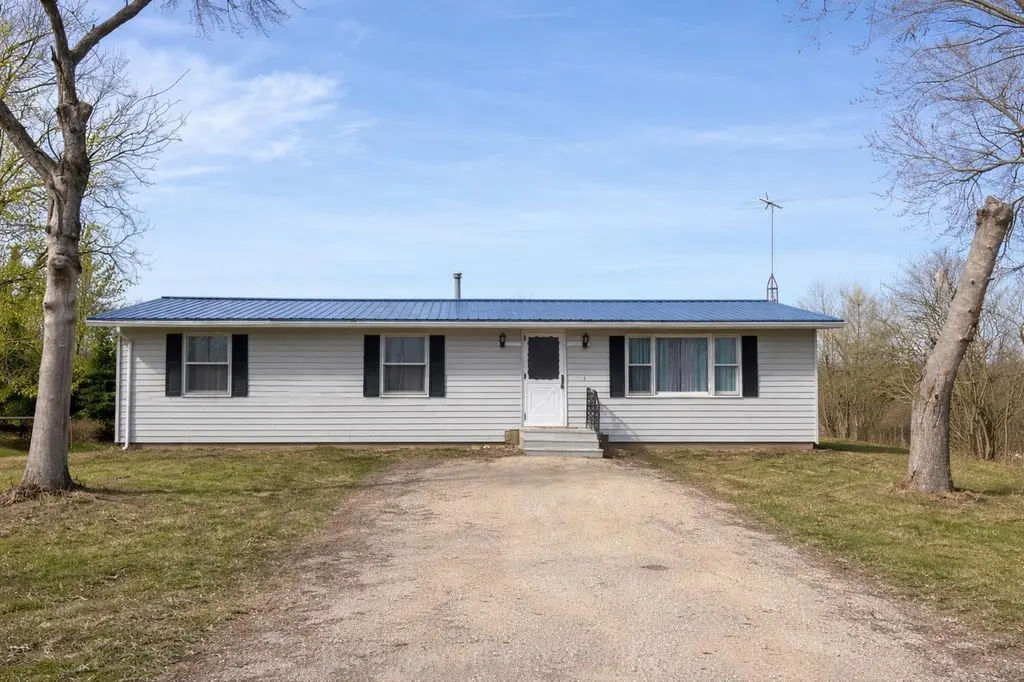
111 Skyline Dr · Guttenberg, IA
Flood risk 1/10 · Minimal
- FEMA flood zone
- X (unshaded)
- Chance of flooding over 30 yrs
- 0.0%
- Est. flood insurance / yr
- $473 – $860
Fire risk 3/10 · Minor
- Est. fire insurance / yr
- $902 – $1,676
Heat risk 2/10 · Minimal
- Hot days now (above 103°F)
- 7 days/yr
- Hot days in 30 yrs
- 15 days/yr
Wind risk 2/10 · Minimal
- Chance of severe wind over 30 yrs
- —
Air-quality risk 1/10 · Minimal
- Unhealthy air days now
- 0 days/yr
- Unhealthy air days in 30 yrs
- 0 days/yr
Risk factors via First Street. Map © Google.
Why this score? — see what drove the C- grade
The composite is a weighted blend of 9 inputs, each scored 0–100. Each bar is that input's sub-score; the figure is the points it added to the 100-point composite (weight × sub-score).
- ARV discount +15.0/15.0
- Cash flow +10.5/30.0
- Appreciation +8.9/10.0
- Schools +5.8/10.0
- Livability +3.8/5.0
- DSCR +3.0/10.0
- 1% rule +2.6/10.0
- Rent growth +2.5/5.0
- Condition / age +2.5/5.0
$155,000
🖨 Deal sheet 📄 Offer letter ✓ Due diligence
Listing remarks MLS
This charming 2-bedroom, 1.5-bath home offers the perfect blend of small-town convenience and peaceful, country-like living. Situated on a spacious lot in a quiet neighborhood, you’ll enjoy plenty of room to relax, entertain, or expand. The property features a rare 3-stall garage—ideal for vehicles, storage, or a workshop. Inside, the home has a functional layout with great potential, offering an excellent opportunity for buyers looking to add their own personal touch and updates. If you’re searching for a property with solid bones, a great location, and the chance to make it your own, this one is full of possibilities! (photos in this listing have been altered by AI for staging, removal of personal property and photo editing purposes)
Key facts
- Great location
- Spacious lot
- Functional layout
Tags
Neighborhood map
What this means for you Summary
Snapshot
- This is a 3-bed/1.5-bath single-family listed at $155k.
Deal economics
- At list price, monthly cash flow is $-79 ($-950/yr) — negative.
- To cash-flow at today's rent, offer at most $141k (9.0% below list).
- To meet the 1% rule (rent ≥ 1% of price), the offer needs to be $117k (24.4% below list).
- Recommended offer: $117k (24.4% below list) — sets the bar for 1% rule.
Location & tenants
- Location reads 76/100 on livability (#199 in IA, #3,648 nationally) — a middle-class / working-renter tenant base. Strengths: crime A+, cost of living A+, housing A+; Watch: employment D+, amenities F, commute F.
- Clayton Ridge Community School District (rural): math 66% / reading 72% proficiency, ranked #164 of 289 in IA (top 57%) — acceptable for families but not a draw, mixed tenant base, ~2y average lease.
- Market conditions: 40 active listings in the ZIP; 48 units permitted in Clayton County in 2024 (0 in 5+ unit buildings).
Forward outlook
- In year one you build about $13k of equity ($1k loan paydown + $12k appreciation (7.8% local appreciation)).
- Clayton County population projected at -21% by 2050 — secular population decline; favor cash flow + early exit over multi-decade hold.
- At projected returns (7.8% appreciation + 3.0% rent growth), your $43k cash investment doubles in ~4 years — after that, you're playing with house money.
- By year 3, paydown + projected appreciation supports a ~$33k cash-out refi (75% LTV) — recoverable capital for the next deal without selling this one.
Negotiation context
- It's been on market 78 days — a 6% lower offer ($146k) is reasonable based on typical stale-listing flexibility.
- 2 sale attempts since 5y ago; this cycle's ask has dropped $24k (13%) from the opening price — seller is motivated, your offer sets the floor, not the list.
- Current owner paid $100k; list at $155k implies a 55% gain — meaningful room to come down on a strong offer.
Questions for the listing agent
- What do current leases actually rent for vs. the listed asking? Can we see a recent rent roll and the last 12 months of T-12 income?
- It's been on market 78 days. Have you received any prior offers? Is the seller open to a 24% concession, seller financing, or rate buy-down credit?
- Built in 1974 — when were the roof, HVAC, electrical panel, plumbing, and water heater last replaced?
- Why hasn't it sold? Are there any deal-killer items the seller is aware of (foundation, flood, title, zoning, code violations)?
- Is there a deadline driving the sale (1031 exchange, divorce, estate, relocation)? That informs how much negotiation room exists.
- Schools are B-rated — typically a magnet for longer-tenancy family renters. What's the average tenant stay here, and is there a school-zone premium baked into asking?
- What's the average days-on-market for RENTAL listings here right now (not sales)? A rising rental-DOM trend means longer vacancies and softer asking-rent achievability than the comps imply.
- What's the recent tenant-quality profile in this submarket — average credit score on applications, eviction rate, late-payment / NSF rate, and stable-employment percentage? A property-management company in the area should have these aggregated.
- How much new for-sale + rental construction is in the pipeline within 1–3 miles? Heavy new supply typically softens prices + rents 12–24 months out; constrained supply supports both.
Investment metrics
- 1% rule
- 0.76% ✗
- Cap rate
- 5.68%
- Cash-on-cash
- -2.19%
- DSCR
- 0.90
- GRM
- 11.0
CMA / ARV
- ARV (median comp)
- $223,794
- List price
- $155,000
- Delta
- -30.74%
- Verdict
- UNDERPRICED
- Comps
- 3 within 1.0 mi
Show comp detail 1 sale within ~0.75 mi
| Address | Dist | Beds/Ba | Sqft | Sold | Price | $/sf | Match |
|---|---|---|---|---|---|---|---|
| 115 Skyline Dr | 0.04mi | 3/2.0 | 1,969 (-8%) | 20mo | $215,000 | $109 | 66 |
Match score weights: distance 35% · size 25% · config 20% · recency 20%. Top-matched comps best support the ARV.
Projected returns pro-forma
7.81% appreciation · 3.0% rent growth · sell at horizon
- IRR
- 17.9%
- Equity multiple
- 2.31×
- Total profit
- $56,928
- Equity at exit
- $115,779
- IRR
- 17.0%
- Equity multiple
- 4.89×
- Total profit
- $168,818
- Equity at exit
- $227,958
Cash invested: $43,400 (down + closing). Projections, not guarantees.
Landlord ↔ Tenant lean methodology
- Overall (STATE)
- 83 Strongly Landlord-Friendly
- State Iowa
- 83 Strongly Landlord-Friendly · R+6
- County
- — inherits STATE
- City
- — inherits STATE
ZIP-level market 52052
- Home prices YoY
- 3.5%
- Active inventory
- 40
- Price-to-rent
- 11.0×
Monthly cashflow live
- Estimated rent
- $1,171 medium interval (Pro) →
- Mortgage (P&I)
- −$813
- Tax from tax record
- −$127 /mo · $1,524/yr
- Insurance
- −$65
- HOA
- −$0
- Vacancy / Maint / Mgmt
- −$246
- Net cashflow
- $-79
Break-even live
UW: 25.0% down · 7.5% · 30yr · 1.5% tax · 5.0% vac · 8.0% maint · 8.0% mgmt
Financing live
Cash to close
- Down payment
- $38,750
- Closing costs
- $4,650
- Reserves months
- —
- Total cash needed
- —
Loan-product check · same deal, 3 products live
Conventional
25% down · 7.5% · 30yr
- Down + closing
- —
- Monthly P&I
- —
- Monthly cashflow
- —
- DSCR
- —
- Eligible?
- —
Personal DTI + credit; lowest rate.
DSCR
20% down · 8.5% · 30yr
- Down + closing
- —
- Monthly P&I
- —
- Monthly cashflow
- —
- DSCR
- —
- Eligible?
- —
No personal income docs; deal must DSCR.
Hard money
10% down · 12.0% · 12mo
- Down + closing
- —
- Monthly P&I
- —
- Monthly cashflow
- —
- DSCR
- —
- Eligible?
- —
Short-term bridge; refi at stabilization.
Listing history 20 events
-
2026-06-18days on market $155,000 Active 78 DOM
-
2026-06-17days on market $155,000 Active 77 DOM
-
2026-06-16days on market $155,000 Active 76 DOM
-
2026-06-15days on market $155,000 Active 75 DOM
-
2026-06-13days on market $155,000 Active 73 DOM
-
2026-06-12days on market $155,000 Active 72 DOM
-
2026-06-09days on market $155,000 Active 69 DOM
-
2026-06-09price $155,000 Active 68 DOM
-
2026-06-08days on market $179,000 Active 68 DOM
-
2026-06-07days on market $179,000 Active 67 DOM
-
2026-06-05days on market $179,000 Active 65 DOM
-
2026-06-04days on market $179,000 Active 63 DOM
-
2026-06-02days on market $179,000 Active 62 DOM
-
2026-06-01days on market $179,000 Active 61 DOM
-
2026-05-31days on market $179,000 Active 60 DOM
-
2026-05-31days on market $179,000 Active 59 DOM
-
2026-04-01$179,000 Active 764-char remark
Show marketing remark (764 chars)
This charming 2-bedroom, 1.5-bath home offers the perfect blend of small-town convenience and peaceful, country-like living. Situated on a spacious lot in a quiet neighborhood, you’ll enjoy plenty of room to relax, entertain, or expand. The property features a rare 3-stall garage—ideal for vehicles, storage, or a workshop. Inside, the home has a functional layout with great potential, offering an excellent opportunity for buyers looking to add their own personal touch and updates. If you’re searching for a property with solid bones, a great location, and the chance to make it your own, this one is full of possibilities! (photos in this listing have been altered by AI for staging, removal of personal property and photo editing purposes)
-
2021-10-13soldstatus $100,000
-
2021-09-30soldstatus $100,000 208-char remark
Show marketing remark (208 chars)
3 bedroom Ranch style home with family room addition and 3 car attached garage located on an oversized almost ½ Acre lot. New metal roof added in 2016, Lower level family room with walkout patio doors.
-
2021-08-18$124,000 208-char remark
Show marketing remark (208 chars)
3 bedroom Ranch style home with family room addition and 3 car attached garage located on an oversized almost ½ Acre lot. New metal roof added in 2016, Lower level family room with walkout patio doors.
ⓘ Source: listings_history table (triggers on properties + properties_extension) + one-shot
backfill from property_details.listing_events for pre-trigger history.
Tax reassessment forecast IA · Partial reset (capped growth)
- Current annual tax
- $1,524 · $127/mo
- Projected year-2 tax
- $1,979 · $165/mo
- Expected delta
- +$455/yr (+$38/mo · 29.8%)
ⓘ Screening estimate from a state-policy table — verify with the county assessor before closing.
Climate risk First Street
- Flood 1/10 Low FEMA zone X (unshaded) · 0% chance over 30 yrs
- Wildfire 3/10 Moderate
- Heat 2/10 Low 7 d/yr ≥103°F today · 15 d/yr by 30 yrs out
- Wind 2/10 Low
- Air quality 1/10 Low 0 unhealthy d/yr today · 0 by 30 yrs out
Nearby sold comps map
Loading sold comps map…
Walkable amenities ~0.75 mi
Loading nearby amenities…
Taxation est. · year 1
- Rental income
- $14,055
- − Mortgage interest
- −$8,682
- − Property taxes
- −$1,524
- − Insurance
- −$775
- − Repairs & maintenance
- −$1,124
- − Management
- −$1,124
- − Depreciation
- −$4,509
- Taxable loss
- −$3,684
- Est. tax savings @ 24.0%
- +$884
- After-tax cash flow
- $-65/yr
For passive investors: Depreciation is non-cash, so a rental often shows a tax loss while cash-flowing — sheltering income. Rental losses are passive: they offset passive income freely, and up to $25,000/yr can offset ordinary (W-2) income if you actively participate and your MAGI is under $100k (phasing out to $0 by $150k); unused losses carry forward. On sale, claimed depreciation is recaptured at up to 25%, and gains may owe capital-gains tax (a 1031 exchange can defer both). Figures are a year-1 estimate at your 24.0% rate — not tax advice; consult a CPA.
Schools (NCES district)
- District
- Clayton Ridge Community School District
- NCES district ID
- 1913350
- Math proficiency
- 66% ▼ -1.00%
- Reading proficiency
- 72% ▲ 3.00%
- Median HH income
- $46,597
- Composite
- 58.19/100
- National rank
- #1024
- State rank
- #164 of 289 in IA
Livability — Guttenberg
- Score
- 76/100
- State rank
- #199
- US rank
- #3648
Category grades
Schools grade is shown separately in the Schools card above.
Census & demographics
- Census place
- Guttenberg, IA
- Population (ZIP)
- 2,807
Population outlook (Clayton County) Hauer SSP2
- Today (2025)
- 16,656 people
- By 2030
- 15,986 · -4.0%
- By 2040
- 14,554 · -12.6%
- By 2050
- 13,187 · -20.8%
- By 2075
- 11,131 · -33.2%
- By 2100
- 9,733 · -41.6%
Race, ethnicity, and origin ACS 2023
- Neighborhood character
- Predominantly White (98%)
- Race & ethnicity
- White 98% Hispanic / Latino 2% Two or more races 1%
- Common ancestry
- Italian 2% Portuguese 2% Lithuanian 1%
- Foreign-born
- 1% · Canada
- Languages at home
- 98% English-only · Spanish 2% German/W. Germanic 1%
Political lean MEDSL · Clayton
- 2024 margin
- Solid R (+34.5) · D 32.2% · R 66.7% · Other 1.2%
- 2008→2024 swing
- -51.7pp toward R · 2008: 17.2pp · 2024: -34.5pp
- All cycles
- 2024: R+34.5 2020: R+28.8 2016: R+22.8 2012: D+6.9 2008: D+17.2
Not yet ingested
- Civics
- —
Market trends
- HPI YoY
- ▲ 7.81%
- Current HPI
- 232.2633
- Rent YoY
- —
- Metro
- —
- State GDP YoY
- ▲ 2.48%
- F500 in state
- 4
Industry mix (Fortune 500 HQ in IA)
| Industry | F500 HQs | Revenue |
|---|---|---|
| Financial Services | 1 | $16B |
|
||
| Retail / Convenience | 1 | $15B |
|
||
Price history
+44.4% since first listed4 events — show timeline
- 2026-04-01 Listed $179,000 NEIRBR as distributed by MLS GRID
- 2021-10-13 Sold (Public Records) $100,000 Public Records
- 2021-09-30 Sold (MLS) $100,000 NEIRBR as distributed by MLS GRID
- 2021-08-18 Listed $124,000 NEIRBR as distributed by MLS GRID
Property tax history
-3.5%/yrLatest (2025): $1,524 · -4.6% YoY. Source: county tax records.
Cash-flow waterfall
monthlySold comps — $/sqft
last 12 mo · ≤1 miLoading sold comps…