21722 Cussewago St · Venango, PA
Flood risk 1/10 · Minimal
- FEMA flood zone
- X (unshaded)
- Chance of flooding over 30 yrs
- 0.0%
- Est. flood insurance / yr
- $473 – $860
Fire risk 1/10 · Minimal
- Est. fire insurance / yr
- $511 – $949
Heat risk 2/10 · Minimal
- Hot days now (above 93°F)
- 7 days/yr
- Hot days in 30 yrs
- 18 days/yr
Wind risk 1/10 · Minimal
- Chance of severe wind over 30 yrs
- —
Air-quality risk 2/10 · Minimal
- Unhealthy air days now
- 1 days/yr
- Unhealthy air days in 30 yrs
- 3 days/yr
Risk factors via First Street. Map © Google.
Why this score? — see what drove the D grade
The composite is a weighted blend of 9 inputs, each scored 0–100. Each bar is that input's sub-score; the figure is the points it added to the 100-point composite (weight × sub-score).
- Cash flow +11.3/30.0
- ARV discount +7.5/15.0
- Appreciation +6.0/10.0
- Schools +3.5/10.0
- DSCR +3.3/10.0
- Livability +3.1/5.0
- 1% rule +2.7/10.0
- Rent growth +2.5/5.0
- Condition / age +2.5/5.0
$139,000
🖨 Deal sheet 📄 Offer letter ✓ Due diligence
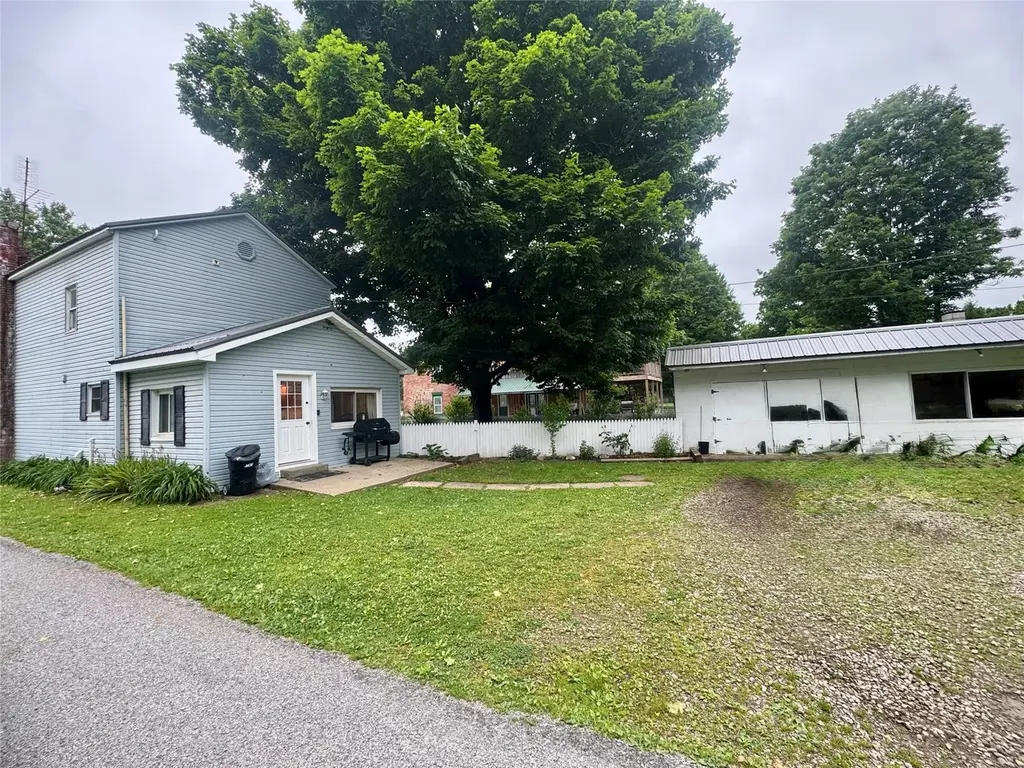
Listing remarks
Well maintained home in the heart of Venango. Has a beautiful, landscaped yard with a large patio great for entertaining or for children and pets. Large storage in a two car detached garage. New roof, new remodeled bathroom, new softner installed in 2025 and so much more! Don't miss out on this great home that is "move in ready. "
Key facts
- Remodeled bathroom
- Large patio
- Softener installed
Tags
Property features AI
Exterior
- Parking: Detached garage; 2 garage spaces
- Utilities: Well water; Septic sewer
- Home design: Single family residence; One and one half stories; Vinyl siding exterior; Residential property
- Construction: Vinyl siding construction; Asphalt roof
- Exterior features: Fenced yard; Corner lot; Landscaped lot; Level lot; Asphalt roof
Interior
- Flooring: Carpet; Hardwood; Laminate
- Bathrooms: 2 full bathrooms
- Heating & cooling: Forced air heating; Central air conditioning
- Interior features: Full basement
Neighborhood map
What this means for you Summary
Snapshot
- This is a 2-bed/2.0-bath single-family listed at $139k.
Deal economics
- At list price, monthly cash flow is $-50 ($-600/yr) — negative.
- To cash-flow at today's rent, offer at most $130k (6.4% below list).
- To meet the 1% rule (rent ≥ 1% of price), the offer needs to be $107k (22.8% below list).
- Recommended offer: $107k (22.8% below list) — sets the bar for 1% rule.
Location & tenants
- Location reads 61/100 on livability (#1,391 in PA) — a middle-class / working-renter tenant base. Strengths: cost of living A+, housing A+; Watch: crime C-, employment D, schools F.
- Penncrest SD (rural): math 31% / reading 50% proficiency, ranked #348 of 539 in PA (top 65%) — families likely to look elsewhere, expect single-tenant / working-renter base with shorter leases.
- Market conditions: 2 active listings in the ZIP; 83 units permitted in Crawford County in 2024 (0 in 5+ unit buildings).
Forward outlook
- In year one you build about $4k of equity ($961 loan paydown + $3k appreciation (1.9% local appreciation)).
- Crawford County population projected at -22% by 2050 — secular population decline; favor cash flow + early exit over multi-decade hold.
- At projected returns (1.9% appreciation + 3.0% rent growth), your $39k cash investment doubles in ~9 years — after that, you're playing with house money.
- By year 9, paydown + projected appreciation supports a ~$32k cash-out refi (75% LTV) — recoverable capital for the next deal without selling this one.
Negotiation context
- Only 3 days on market — expect competitive offers; lowballing is unlikely to land.
- Current owner paid $80k; list at $139k implies a 74% gain — meaningful room to come down on a strong offer.
Risks & watch-outs
- Watch-outs: built in 1900 — expect roof / HVAC / electrical / plumbing capex.
Questions for the listing agent
- What do current leases actually rent for vs. the listed asking? Can we see a recent rent roll and the last 12 months of T-12 income?
- Built in 1900 — when were the roof, HVAC, electrical panel, plumbing, and water heater last replaced?
- Is there a deadline driving the sale (1031 exchange, divorce, estate, relocation)? That informs how much negotiation room exists.
- Schools are F-rated, which usually means shorter tenancies and higher turnover. Who's the typical renter profile here, and what's been the actual vacancy rate?
- The area grade is low — what's the realistic commute time and amenity access for the typical tenant pool here? Any planned neighborhood developments (good or bad) we should know about?
- What's the average days-on-market for RENTAL listings here right now (not sales)? A rising rental-DOM trend means longer vacancies and softer asking-rent achievability than the comps imply.
- What's the recent tenant-quality profile in this submarket — average credit score on applications, eviction rate, late-payment / NSF rate, and stable-employment percentage? A property-management company in the area should have these aggregated.
- How much new for-sale + rental construction is in the pipeline within 1–3 miles? Heavy new supply typically softens prices + rents 12–24 months out; constrained supply supports both.
Investment metrics
- 1% rule
- 0.77% ✗
- Cap rate
- 5.86%
- Cash-on-cash
- -1.54%
- DSCR
- 0.93
- GRM
- 10.8
CMA / ARV
No comps found within radius.
Projected returns pro-forma
1.95% appreciation · 3.0% rent growth · sell at horizon
- IRR
- 2.9%
- Equity multiple
- 1.15×
- Total profit
- $5,986
- Equity at exit
- $54,466
- IRR
- 6.7%
- Equity multiple
- 1.91×
- Total profit
- $35,574
- Equity at exit
- $78,156
Cash invested: $38,920 (down + closing). Projections, not guarantees.
Landlord ↔ Tenant lean methodology
- Overall (STATE)
- 62 Landlord-Friendly
- State Pennsylvania
- 62 Landlord-Friendly · EVEN
- County
- — inherits STATE
- City
- — inherits STATE
ZIP-level market 16440
- Home prices YoY
- 1.9%
- Active inventory
- 2
- Price-to-rent
- 10.8×
Monthly cashflow live
- Estimated rent
- $1,074 medium interval (Pro) →
- Mortgage (P&I)
- −$729
- Tax from tax record
- −$111 /mo · $1,335/yr
- Insurance
- −$58
- HOA
- −$0
- Vacancy / Maint / Mgmt
- −$225
- Net cashflow
- $-50
Break-even live
UW: 25.0% down · 7.5% · 30yr · 1.5% tax · 5.0% vac · 8.0% maint · 8.0% mgmt
Financing live
Cash to close
- Down payment
- $34,750
- Closing costs
- $4,170
- Reserves months
- —
- Total cash needed
- —
Loan-product check · same deal, 3 products live
Conventional
25% down · 7.5% · 30yr
- Down + closing
- —
- Monthly P&I
- —
- Monthly cashflow
- —
- DSCR
- —
- Eligible?
- —
Personal DTI + credit; lowest rate.
DSCR
20% down · 8.5% · 30yr
- Down + closing
- —
- Monthly P&I
- —
- Monthly cashflow
- —
- DSCR
- —
- Eligible?
- —
No personal income docs; deal must DSCR.
Hard money
10% down · 12.0% · 12mo
- Down + closing
- —
- Monthly P&I
- —
- Monthly cashflow
- —
- DSCR
- —
- Eligible?
- —
Short-term bridge; refi at stabilization.
Listing history 4 events
-
2026-06-16status $139,000 Pending 3 DOM
-
2026-06-15days on market $139,000 Active 3 DOM
-
2026-06-13remarks 332-char remark
-
2026-06-13$139,000 Active 1 DOM
ⓘ Source: listings_history table (triggers on properties + properties_extension) + one-shot
backfill from property_details.listing_events for pre-trigger history.
Tax reassessment forecast PA · Partial reset (capped growth)
- Current annual tax
- $1,335 · $111/mo
- Projected year-2 tax
- $1,765 · $147/mo
- Expected delta
- +$431/yr (+$36/mo · 32.3%)
ⓘ Screening estimate from a state-policy table — verify with the county assessor before closing.
Climate risk First Street
- Flood 1/10 Low FEMA zone X (unshaded) · 0% chance over 30 yrs
- Wildfire 1/10 Low
- Heat 2/10 Low 7 d/yr ≥93°F today · 18 d/yr by 30 yrs out
- Wind 1/10 Low
- Air quality 2/10 Low 1 unhealthy d/yr today · 3 by 30 yrs out
Nearby sold comps map
Loading sold comps map…
Walkable amenities ~0.75 mi
Loading nearby amenities…
Taxation est. · year 1
- Rental income
- $12,882
- − Mortgage interest
- −$7,786
- − Property taxes
- −$1,335
- − Insurance
- −$695
- − Repairs & maintenance
- −$1,031
- − Management
- −$1,031
- − Depreciation
- −$4,044
- Taxable loss
- −$3,038
- Est. tax savings @ 24.0%
- +$729
- After-tax cash flow
- $129/yr
For passive investors: Depreciation is non-cash, so a rental often shows a tax loss while cash-flowing — sheltering income. Rental losses are passive: they offset passive income freely, and up to $25,000/yr can offset ordinary (W-2) income if you actively participate and your MAGI is under $100k (phasing out to $0 by $150k); unused losses carry forward. On sale, claimed depreciation is recaptured at up to 25%, and gains may owe capital-gains tax (a 1031 exchange can defer both). Figures are a year-1 estimate at your 24.0% rate — not tax advice; consult a CPA.
Schools (NCES district)
- District
- Penncrest SD
- NCES district ID
- 4218740
- Math proficiency
- 31% ▼ -10.00%
- Reading proficiency
- 50% ▼ -8.00%
- Median HH income
- $47,927
- Composite
- 34.64/100
- National rank
- #5146
- State rank
- #348 of 539 in PA
Livability — Venango
- Score
- 61/100
- State rank
- #1391
- US rank
- #17578
Category grades
Schools grade is shown separately in the Schools card above.
Census & demographics
- Census place
- Venango, PA
- Population (ZIP)
- 741
Population outlook (Crawford County) Hauer SSP2
- Today (2025)
- 81,399 people
- By 2030
- 77,977 · -4.2%
- By 2040
- 70,659 · -13.2%
- By 2050
- 63,841 · -21.6%
- By 2075
- 50,198 · -38.3%
- By 2100
- 37,898 · -53.4%
Race, ethnicity, and origin ACS 2023
- Neighborhood character
- Predominantly White (88%)
- Race & ethnicity
- White 88% Two or more races 10% Black 1%
- Common ancestry
- Romanian 13% Lithuanian 3% Slovak 1%
- Foreign-born
- 2% · Canada
- Languages at home
- 99% English-only · French/Haitian/Cajun 1%
Political lean MEDSL · Crawford
- 2024 margin
- Solid R (+39.2) · D 30.0% · R 69.2%
- 2008→2024 swing
- -28.8pp toward R · 2008: -10.4pp · 2024: -39.2pp
- All cycles
- 2024: R+39.2 2020: R+37.2 2016: R+38.5 2012: R+19.6 2008: R+10.4
Not yet ingested
- Civics
- —
Market trends
- HPI YoY
- ▲ 1.95%
- Current HPI
- 105.9513
- Rent YoY
- —
- Metro
- —
- State GDP YoY
- ▲ 1.68%
- F500 in state
- 34
Industry mix (Fortune 500 HQ in PA)
| Industry | F500 HQs | Revenue |
|---|---|---|
| Healthcare | 2 | $309B |
|
||
| Insurance | 2 | $27B |
|
||
| Telecommunications / Media | 1 | $124B |
|
||
| Industrial Distribution | 1 | $22B |
|
||
| Financial Services | 1 | $20B |
|
||
| Chemicals / Materials | 1 | $18B |
|
||
Price history
+73.8% since first listed2 events — show timeline
- 2026-06-12 Listed $139,000 GEBOR
- 2022-09-12 Sold (Public Records) $80,000 Public Records
Property tax history
+1.5%/yrLatest (2025): $1,335 · +4.9% YoY. Source: county tax records.
Cash-flow waterfall
monthlySold comps — $/sqft
last 12 mo · ≤1 miLoading sold comps…