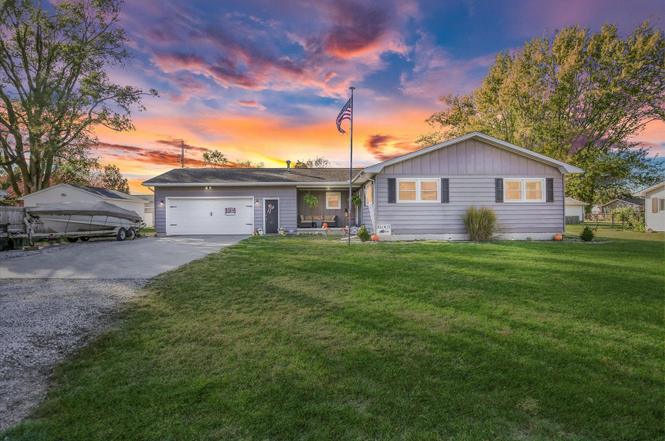
407 S Washington St · Sidney, IL
Flood risk 1/10 · Minimal
- FEMA flood zone
- X (unshaded)
- Chance of flooding over 30 yrs
- 0.0%
- Est. flood insurance / yr
- $507 – $1,088
Fire risk 1/10 · Minimal
- Est. fire insurance / yr
- $804 – $1,492
Heat risk 3/10 · Minor
- Hot days now (above 104°F)
- 7 days/yr
- Hot days in 30 yrs
- 19 days/yr
Wind risk 2/10 · Minimal
- Chance of severe wind over 30 yrs
- 1.0%
Air-quality risk 2/10 · Minimal
- Unhealthy air days now
- 1 days/yr
- Unhealthy air days in 30 yrs
- 2 days/yr
Risk factors via First Street. Map © Google.
Why this score? — see what drove the D- grade
The composite is a weighted blend of 9 inputs, each scored 0–100. Each bar is that input's sub-score; the figure is the points it added to the 100-point composite (weight × sub-score).
- Cash flow +15.4/30.0
- DSCR +4.7/10.0
- 1% rule +3.9/10.0
- Livability +3.4/5.0
- Schools +3.2/10.0
- Rent growth +2.5/5.0
- Condition / age +2.5/5.0
- ARV discount +0.0/15.0
- Appreciation +0.0/10.0
$218,500
🖨 Deal sheet (PDF) 📄 Offer letter ✓ Due diligence
Listing remarks MLS
HEATED GARAGE, MATURE TREES, SWING SET, 2 STORAGE SHE DS, BOILER 1990.C-AIR1992,5 CEILING FANS, NEWER CARP ET IN 2 BEDROOMS, BATHS RECENTLY REMODELED, NICELY L ANDSCAPED, WELL MAINTAINED HOME. GARDEN.
Key facts
- 0.27 acre lot
- 2 garage spots
- Built 1968
Neighborhood map
What this means for you Summary
Snapshot
- This is a 3-bed/2.0-bath single-family listed at $218k.
Deal economics
- At list price, monthly cash flow is $85 ($1k/yr) — positive.
- The deal already cash-flows at list — no discount required.
- To meet the 1% rule (rent ≥ 1% of price), the offer needs to be $195k (10.8% below list).
- Recommended offer: $195k (10.8% below list) — sets the bar for 1% rule.
Location & tenants
- Location reads 68/100 on livability (#476 in IL) — a middle-class / working-renter tenant base. Strengths: crime A+, cost of living A+, housing A+; Watch: amenities F, commute F, health & safety F.
- Tolono CUSD 7 (rural): math 35% / reading 36% proficiency, ranked #164 of 620 in IL (top 26%) — families likely to look elsewhere, expect single-tenant / working-renter base with shorter leases.
- Zoned schools: Unity Jr High School (math 32% / reading 38%, grade F, #191 of 665 statewide, top 30%, 346 students, 0% FRL); Unity High School (math 42% / reading 47%, grade F, #62 of 693 statewide, top 10%, 528 students, 0% FRL) — zoned schools average 0% FRL vs 25% district-wide (25 pts lower); this property's tenant base skews higher-income than the district average.
- Market conditions: 11 active listings in the ZIP; 1 comparable units currently listed for rent nearby; 573 units permitted in Champaign County in 2024 (359 in 5+ unit buildings).
Forward outlook
- Local home prices are declining (-3.0%/yr); year-one equity from $2k of loan paydown is wiped out by about $7k of value loss. Plan a longer hold.
- Champaign County population projected at +15% by 2050 — modest demand growth; plan on rents tracking national, not racing it.
Negotiation context
- It's been on market 92 days — a 9% lower offer ($199k) is reasonable based on typical stale-listing flexibility.
- 4 sale attempts since 27y ago with the ask held roughly flat each time — persistent listings suggest the price (not the market) is what's stuck; bring a comps-based counter.
Questions for the listing agent
- It's been on market 92 days. Have you received any prior offers? Is the seller open to a 11% concession, seller financing, or rate buy-down credit?
- Built in 1968 — when were the roof, HVAC, electrical panel, plumbing, and water heater last replaced?
- Why hasn't it sold? Are there any deal-killer items the seller is aware of (foundation, flood, title, zoning, code violations)?
- Is there a deadline driving the sale (1031 exchange, divorce, estate, relocation)? That informs how much negotiation room exists.
- Schools are D-rated, which usually means shorter tenancies and higher turnover. Who's the typical renter profile here, and what's been the actual vacancy rate?
- The area grade is low — what's the realistic commute time and amenity access for the typical tenant pool here? Any planned neighborhood developments (good or bad) we should know about?
- What's the average days-on-market for RENTAL listings here right now (not sales)? A rising rental-DOM trend means longer vacancies and softer asking-rent achievability than the comps imply.
- What's the recent tenant-quality profile in this submarket — average credit score on applications, eviction rate, late-payment / NSF rate, and stable-employment percentage? A property-management company in the area should have these aggregated.
- How much new for-sale + rental construction is in the pipeline within 1–3 miles? Heavy new supply typically softens prices + rents 12–24 months out; constrained supply supports both.
Investment metrics
- 1% rule
- 0.89% ✗
- Cap rate
- 6.76%
- Cash-on-cash
- 1.66%
- DSCR
- 1.07
- GRM
- 9.3
CMA / ARV
- ARV (on-the-fly)
- $150,800
- Comps found
- 11
Show comp detail 11 sales within ~0.75 mi
| Address | Dist | Beds/Ba | Sqft | Sold | Price | $/sf | Match |
|---|---|---|---|---|---|---|---|
| 407 S Washington St | 0.00mi | 3/2.0 | 1,355 (+4%) | 1mo | $214,000 | $158 | 92 |
| 206 Maple St W | 0.35mi | 2/2.0 (-1) | 1,243 (-4%) | 4mo | $199,000 | $160 | 68 |
| 107 W Byron St | 0.37mi | 3/1.0 | 1,226 (-6%) | 4mo | $107,000 | $87 | 66 |
| 512 S Scarborough St | 0.24mi | 3/2.0 | 1,468 (+13%) | 12mo | $210,000 | $143 | 58 |
| 104 Maple St | 0.23mi | 3/2.0 | 1,484 (+14%) | 16mo | $175,000 | $118 | 52 |
| 104 N Harrison St | 0.43mi | 3/1.0 | 1,376 (+6%) | 21mo | $154,900 | $113 | 49 |
| 216 E Main St | 0.39mi | 3/1.0 | 1,119 (-14%) | 8mo | $118,500 | $106 | 47 |
| 207 Hazel St | 0.43mi | 3/1.5 | 1,468 (+13%) | 13mo | $170,000 | $116 | 45 |
| 106 W Byron St | 0.38mi | 3/1.0 | 1,181 (-9%) | 21mo | $90,000 | $76 | 45 |
| 106 S Washington St | 0.33mi | 3/2.0 | 1,120 (-14%) | 21mo | $215,900 | $193 | 44 |
| 202 Alley St | 0.54mi | 2/1.0 (-1) | 1,244 (-4%) | 22mo | $95,000 | $76 | 41 |
Match score weights: distance 35% · size 25% · config 20% · recency 20%. Top-matched comps best support the ARV.
Projected returns pro-forma
-3.0% appreciation · 3.0% rent growth · sell at horizon
- IRR
- -13.7%
- Equity multiple
- 0.51×
- Total profit
- $-30,020
- Equity at exit
- $32,579
- IRR
- -4.8%
- Equity multiple
- 0.69×
- Total profit
- $-19,217
- Equity at exit
- $18,892
Cash invested: $61,180 (down + closing). Projections, not guarantees.
Landlord ↔ Tenant lean methodology
- Overall (STATE)
- 43 Moderately Tenant-Leaning
- State Illinois
- 43 Moderately Tenant-Leaning · D+7
- County
- — inherits STATE
- City
- — inherits STATE
ZIP-level market 61877
- Home prices YoY
- -5.8%
- Active inventory
- 11
- Price-to-rent
- 9.3×
Monthly cashflow live
- Estimated rent
- $1,950 medium interval (Pro) →
- Mortgage (P&I)
- −$1,146
- Tax from tax record
- −$219 /mo · $2,628/yr
- Insurance
- −$91
- HOA
- −$0
- Vacancy / Maint / Mgmt
- −$410
- Net cashflow
- $85
Break-even live
Sensitivity live
| Price | -10% $208 | -5% $146 | +0% $85 | +5% $23 | +10% $-39 |
|---|---|---|---|---|---|
| Rent | -10% $-69 | -5% $8 | +0% $85 | +5% $162 | +10% $239 |
| Rate | -1.0pp $195 | -0.5pp $140 | base $85 | +0.5pp $28 | +1.0pp $-30 |
UW: 25.0% down · 7.5% · 30yr · 1.5% tax · 5.0% vac · 8.0% maint · 8.0% mgmt
Financing live
Cash to close
- Down payment
- $54,625
- Closing costs
- $6,555
- Reserves months
- —
- Total cash needed
- —
Loan-product check · same deal, 3 products live
Conventional
25% down · 7.5% · 30yr
- Down + closing
- —
- Monthly P&I
- —
- Monthly cashflow
- —
- DSCR
- —
- Eligible?
- —
Personal DTI + credit; lowest rate.
DSCR
20% down · 8.5% · 30yr
- Down + closing
- —
- Monthly P&I
- —
- Monthly cashflow
- —
- DSCR
- —
- Eligible?
- —
No personal income docs; deal must DSCR.
Hard money
10% down · 12.0% · 12mo
- Down + closing
- —
- Monthly P&I
- —
- Monthly cashflow
- —
- DSCR
- —
- Eligible?
- —
Short-term bridge; refi at stabilization.
Rent comps 1 comps
| Address | Beds | Baths | Sqft | Rent | $/sqft | DOM | Units | Dist |
|---|---|---|---|---|---|---|---|---|
| 601 S David St Sidney, IL | 3.0 | 2.0 | 1800 | $1,950 | $1.08 | 15d | 1 | 0.19mi |
Listing history 17 events
-
2026-04-25status Pending
-
2026-04-01price $218,500
-
2026-02-20price $224,500
-
2026-02-16status Temporarily No Showings
-
2025-11-26status Pending
-
2025-11-01$218,500 Active
-
2024-08-20soldstatus $276,000
-
2015-08-03soldstatus $130,000
-
2015-07-31soldstatus $130,000
-
2015-06-11historical
-
2015-06-11$129,900
-
2006-07-24soldstatus $118,000
-
1999-12-28soldstatus $82,000 200-char remark
Show marketing remark (200 chars)
HEATED GARAGE, MATURE TREES, SWING SET, 2 STORAGE SHE DS, BOILER 1990.C-AIR1992,5 CEILING FANS, NEWER CARP ET IN 2 BEDROOMS, BATHS RECENTLY REMODELED, NICELY L ANDSCAPED, WELL MAINTAINED HOME. GARDEN.
-
1999-12-28soldstatus $82,000
Show marketing remark (200 chars)
HEATED GARAGE, MATURE TREES, SWING SET, 2 STORAGE SHE DS, BOILER 1990.C-AIR1992,5 CEILING FANS, NEWER CARP ET IN 2 BEDROOMS, BATHS RECENTLY REMODELED, NICELY L ANDSCAPED, WELL MAINTAINED HOME. GARDEN.
-
1999-11-23historical 200-char remark
Show marketing remark (200 chars)
HEATED GARAGE, MATURE TREES, SWING SET, 2 STORAGE SHE DS, BOILER 1990.C-AIR1992,5 CEILING FANS, NEWER CARP ET IN 2 BEDROOMS, BATHS RECENTLY REMODELED, NICELY L ANDSCAPED, WELL MAINTAINED HOME. GARDEN.
-
1999-07-09$86,500 200-char remark
Show marketing remark (200 chars)
HEATED GARAGE, MATURE TREES, SWING SET, 2 STORAGE SHE DS, BOILER 1990.C-AIR1992,5 CEILING FANS, NEWER CARP ET IN 2 BEDROOMS, BATHS RECENTLY REMODELED, NICELY L ANDSCAPED, WELL MAINTAINED HOME. GARDEN.
-
1994-08-29soldstatus $48,333
ⓘ Source: listings_history table (triggers on properties + properties_extension) + one-shot
backfill from property_details.listing_events for pre-trigger history.
Tax reassessment forecast IL · Partial reset (capped growth)
- Current annual tax
- $2,628 · $219/mo
- Projected year-2 tax
- $3,794 · $316/mo
- Expected delta
- +$1,166/yr (+$97/mo · 44.4%)
ⓘ Screening estimate from a state-policy table — verify with the county assessor before closing.
Climate risk First Street
- Flood 1/10 Low FEMA zone X (unshaded) · 0% chance over 30 yrs
- Wildfire 1/10 Low
- Heat 3/10 Moderate 7 d/yr ≥104°F today · 19 d/yr by 30 yrs out
- Wind 2/10 Low 100% chance of damaging wind over 30 yrs
- Air quality 2/10 Low 1 unhealthy d/yr today · 2 by 30 yrs out
Nearby sold comps map
Loading sold comps map…
Walkable amenities ~0.75 mi
Loading nearby amenities…
Taxation est. · year 1
- Rental income
- $23,400
- − Mortgage interest
- −$12,239
- − Property taxes
- −$2,628
- − Insurance
- −$1,092
- − Repairs & maintenance
- −$1,872
- − Management
- −$1,872
- − Depreciation
- −$6,356
- Taxable loss
- −$2,660
- Est. tax savings @ 24.0%
- +$638
- After-tax cash flow
- $1,654/yr
For passive investors: Depreciation is non-cash, so a rental often shows a tax loss while cash-flowing — sheltering income. Rental losses are passive: they offset passive income freely, and up to $25,000/yr can offset ordinary (W-2) income if you actively participate and your MAGI is under $100k (phasing out to $0 by $150k); unused losses carry forward. On sale, claimed depreciation is recaptured at up to 25%, and gains may owe capital-gains tax (a 1031 exchange can defer both). Figures are a year-1 estimate at your 24.0% rate — not tax advice; consult a CPA.
Schools (NCES district)
- District
- Tolono CUSD 7
- NCES district ID
- 1739120
- Math proficiency
- 35% ▬ 0.00%
- Reading proficiency
- 36% ▼ -2.00%
- Median HH income
- $67,482
- Composite
- 32.43/100
- National rank
- #5723
- State rank
- #164 of 620 in IL
Livability — Sidney
- Score
- 68/100
- State rank
- #476
- US rank
- #9882
Category grades
Schools grade is shown separately in the Schools card above.
Census & demographics
- Census place
- Sidney, IL
- Population (ZIP)
- 1,055
Population outlook (Champaign County) Hauer SSP2
- Today (2025)
- 223,848 people
- By 2030
- 231,416 · +3.4%
- By 2040
- 244,321 · +9.1%
- By 2050
- 256,432 · +14.6%
- By 2075
- 285,823 · +27.7%
- By 2100
- 296,406 · +32.4%
Race, ethnicity, and origin ACS 2023
- Neighborhood character
- Predominantly White (94%)
- Race & ethnicity
- White 94% Hispanic / Latino 5% Two or more races 2%
- Common ancestry
- Italian 4% Romanian 3% Slovak 2%
- Foreign-born
- 3%
- Languages at home
- 97% English-only · Arabic 2% Other Indo-European 1%
Political lean MEDSL · Champaign
- 2024 margin
- Strong D (+24.1) · D 61.3% · R 37.2% · Other 1.5%
- 2008→2024 swing
- +6.6pp toward D · 2008: 17.5pp · 2024: 24.1pp
- All cycles
- 2024: D+24.1 2020: D+22.8 2016: D+18.4 2012: D+6.8 2008: D+17.5
Not yet ingested
- Civics
- —
Market trends
- HPI YoY
- ▼ -15.38%
- Current HPI
- 247.6701
- Rent YoY
- —
- Metro
- —
- State GDP YoY
- ▲ 1.59%
- F500 in state
- 60
Industry mix (Fortune 500 HQ in IL)
| Industry | F500 HQs | Revenue |
|---|---|---|
| Insurance | 4 | $201B |
|
||
| Consumer Goods | 4 | $87B |
|
||
| Industrial Machinery | 3 | $64B |
|
||
| Healthcare | 2 | $55B |
|
||
| Retail / Pharmacy | 1 | $148B |
|
||
| Agriculture / Food | 1 | $86B |
|
||
Price history
+352.1% since first listed17 events — show timeline
- 2026-04-25 Pending — MRED as Distributed by MLS Grid
- 2026-04-01 Price Changed $218,500 MRED as Distributed by MLS Grid
- 2026-02-20 Price Changed $224,500 MRED as Distributed by MLS Grid
- 2026-02-16 Relisted — MRED as Distributed by MLS Grid
- 2025-11-26 Pending — MRED as Distributed by MLS Grid
- 2025-11-01 Listed $218,500 MRED as Distributed by MLS Grid
- 2024-08-20 Sold (Public Records) $276,000 Public Records
- 2015-08-03 Sold (MLS) $130,000 MRED as Distributed by MLS Grid
- 2015-07-31 Sold (Public Records) $130,000 Public Records
- 2015-06-11 Listed $129,900 MRED as Distributed by MLS Grid
- 2015-06-11 Listing Removed — MRED as Distributed by MLS Grid
- 2006-07-24 Sold (Public Records) $118,000 Public Records
- 1999-12-28 Sold (MLS) $82,000 MRED as Distributed by MLS Grid
- 1999-12-28 Sold (Public Records) $82,000 Public Records
- 1999-11-23 Listing Removed — MRED as Distributed by MLS Grid
- 1999-07-09 Listed $86,500 MRED as Distributed by MLS Grid
- 1994-08-29 Sold (Public Records) $48,333 Public Records
Property tax history
+2.1%/yrLatest (2024): $2,628 · +4.5% YoY. Source: county tax records.
Cash-flow waterfall
monthlySold comps — $/sqft
last 12 mo · ≤1 miLoading sold comps…