 Multi-family
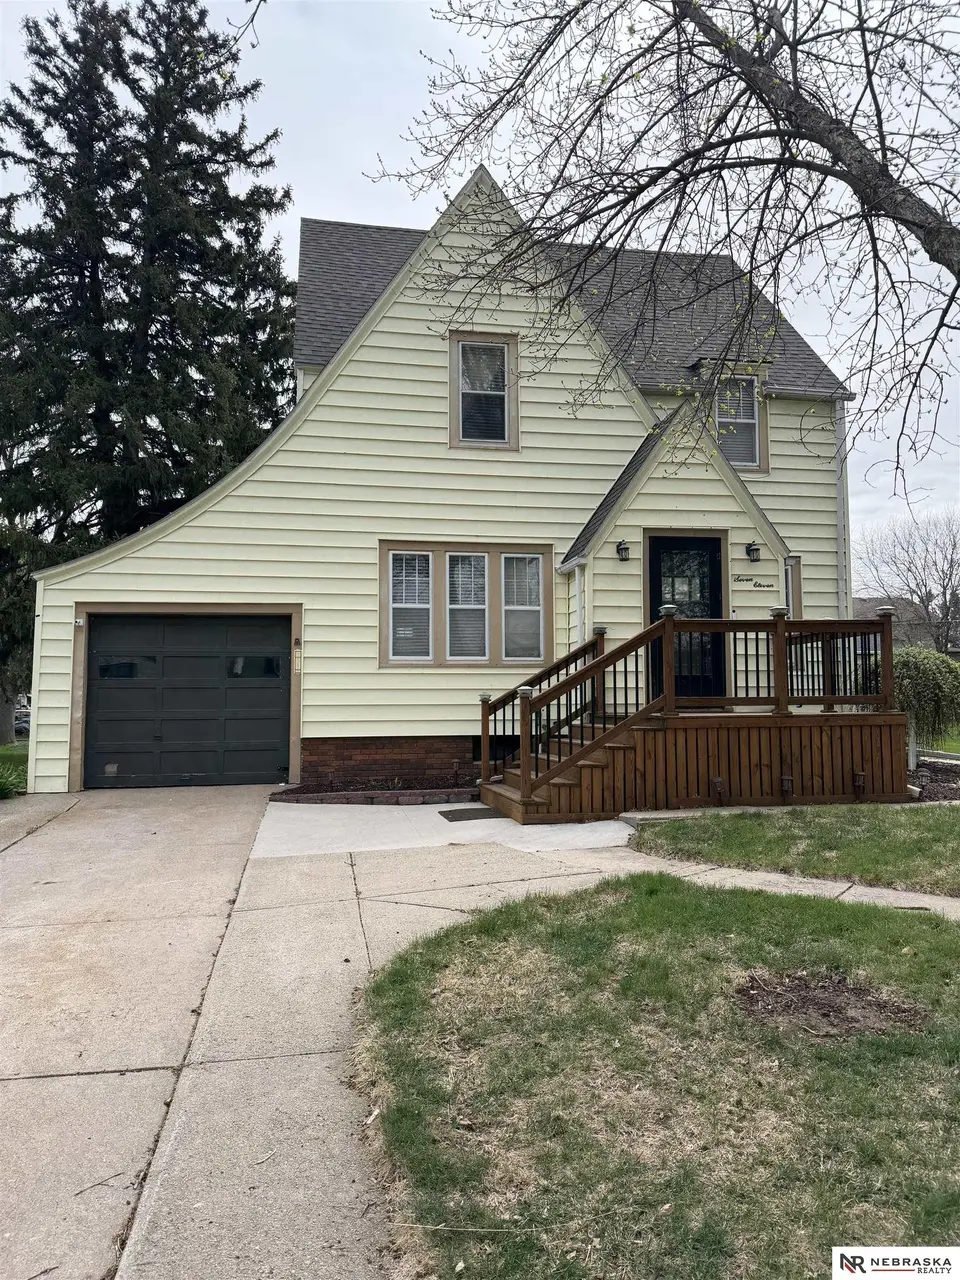
711 N Thomas Ave · Oakland, NE
Flood risk 1/10 · Minimal
- FEMA flood zone
- X (unshaded)
- Chance of flooding over 30 yrs
- 0.0%
- Est. flood insurance / yr
- $473 – $860
Fire risk 1/10 · Minimal
- Est. fire insurance / yr
- $1,161 – $2,155
Heat risk 3/10 · Minor
- Hot days now (above 103°F)
- 7 days/yr
- Hot days in 30 yrs
- 15 days/yr
Wind risk 2/10 · Minimal
- Chance of severe wind over 30 yrs
- —
Air-quality risk 1/10 · Minimal
- Unhealthy air days now
- 0 days/yr
- Unhealthy air days in 30 yrs
- 0 days/yr
Risk factors via First Street. Map © Google.
Why this score? — see what drove the B+ grade
The composite is a weighted blend of 9 inputs, each scored 0–100. Each bar is that input's sub-score; the figure is the points it added to the 100-point composite (weight × sub-score).
- Cash flow +30.0/30.0
- DSCR +10.0/10.0
- Appreciation +8.8/10.0
- 1% rule +7.8/10.0
- ARV discount +7.5/15.0
- Schools +4.7/10.0
- Livability +3.8/5.0
- Rent growth +2.5/5.0
- Condition / age +2.5/5.0
$150,000
🖨 Deal sheet 📄 Offer letter ✓ Due diligence
Multi-family units
County records classify this as Multi-Family (5+ Unit). Listing-text estimate: 1 unit. estimate disagrees with records
5+ unit building — per-unit beds/baths from public records are typically unavailable; the breakdown below (if shown) is an estimate from the listing text.
Listing remarks
AMA; AATLA; Check out this charming 2 1/2 story home featuring exceptional curb appeal. A welcoming deck sets the tone as you approach the entrance. Inside, you'll find lovely wood floors throughout the spacious living room, with a dining area that flows seamlessly into the kitchen-perfect for both everyday living and entertaining. Upstairs offers three comfortable bedrooms, all with wood flooring, along with a tastefully updated full bathroom. Continue to the attic level to discover a versatile bonus space that can serve as a non-conforming bedroom, home office, or play area. The home also features a newer roof, with the east side replaced in fall 2025 and the west side updated approximate
Key facts
- Wood floors
- Newer roof
- Welcoming deck
Tags
Neighborhood map
What this means for you Summary
Snapshot
- This is a 4-bed/2.0-bath multifamily listed at $150k.
Deal economics
- At list price, monthly cash flow is $584 ($7k/yr) — positive.
- The deal already cash-flows at list — no discount required.
- Meets the 1% rule at list price ($2k rent vs $150k).
Location & tenants
- Location reads 75/100 on livability (#98 in NE, #3,931 nationally) — a middle-class / working-renter tenant base. Strengths: crime A+, cost of living A+, housing A+; Watch: employment D, amenities F, commute F.
- Oakland Craig Public Schools (rural): math 55% / reading 55% proficiency, ranked #39 of 111 in NE (top 35%) — acceptable for families but not a draw, mixed tenant base, ~2y average lease.
- Zoned schools: Oakland Craig Elementary (math 47% / reading 52%, grade D, #233 of 502 statewide, top 52%, 223 students, 15% FRL); Oakland Craig Junior-Senior High (math 62% / reading 57%, grade C+, #49 of 261 statewide, top 26%, 193 students, 4% FRL) — zoned schools average 9% FRL vs 27% district-wide (18 pts lower); this property's tenant base skews higher-income than the district average.
- Market conditions: 8 active listings in the ZIP; 15 units permitted in Burt County in 2024 (0 in 5+ unit buildings).
Forward outlook
- In year one you build about $12k of equity ($1k loan paydown + $11k appreciation (7.6% local appreciation)).
- Burt County population projected at -18% by 2050 — secular population decline; favor cash flow + early exit over multi-decade hold.
- At projected returns (7.6% appreciation + 3.0% rent growth), your $42k cash investment doubles in ~3 years — after that, you're playing with house money.
- By year 3, paydown + projected appreciation supports a ~$31k cash-out refi (75% LTV) — recoverable capital for the next deal without selling this one.
Negotiation context
- Only 6 days on market — expect competitive offers; lowballing is unlikely to land.
Risks & watch-outs
- Watch-outs: built in 1931 — expect roof / HVAC / electrical / plumbing capex.
Questions for the listing agent
- Built in 1931 — when were the roof, HVAC, electrical panel, plumbing, and water heater last replaced?
- Is there a deadline driving the sale (1031 exchange, divorce, estate, relocation)? That informs how much negotiation room exists.
- Schools are B-rated — typically a magnet for longer-tenancy family renters. What's the average tenant stay here, and is there a school-zone premium baked into asking?
- What's the average days-on-market for RENTAL listings here right now (not sales)? A rising rental-DOM trend means longer vacancies and softer asking-rent achievability than the comps imply.
- What's the recent tenant-quality profile in this submarket — average credit score on applications, eviction rate, late-payment / NSF rate, and stable-employment percentage? A property-management company in the area should have these aggregated.
- How much new apartment / multifamily construction is in the pipeline within 1–3 miles? Heavy new supply (>2% of stock underway) typically softens rents 12–24 months out; light construction supports rent growth.
Investment metrics
- 1% rule
- 1.28% ✓
- Cap rate
- 10.97%
- Cash-on-cash
- 16.69%
- DSCR
- 1.74
- GRM
- 6.5
CMA / ARV
No comps found within radius.
Projected returns pro-forma
7.61% appreciation · 3.0% rent growth · sell at horizon
- IRR
- 32.3%
- Equity multiple
- 3.27×
- Total profit
- $95,192
- Equity at exit
- $109,956
- IRR
- 29.0%
- Equity multiple
- 6.92×
- Total profit
- $248,430
- Equity at exit
- $214,549
Cash invested: $42,000 (down + closing). Projections, not guarantees.
Landlord ↔ Tenant lean methodology
- Overall (STATE)
- 83 Strongly Landlord-Friendly
- State Nebraska
- 83 Strongly Landlord-Friendly · R+13
- County
- — inherits STATE
- City
- — inherits STATE
ZIP-level market 68045
- Home prices YoY
- 2.8%
- Active inventory
- 8
- Price-to-rent
- 13.1×
Monthly cashflow live
- Estimated rent
- $1,914 medium interval (Pro) →
- Mortgage (P&I)
- −$787
- Tax from tax record
- −$79 /mo · $946/yr
- Insurance
- −$62
- HOA
- −$0
- Vacancy / Maint / Mgmt
- −$402
- Net cashflow
- $584
Break-even live
2-unit breakdown (identical units grouped — click to expand)
| Units | Beds | Baths | Est. rent |
|---|---|---|---|
| 2× units | 2 | 1 | $1,914 |
| #1 | 2 | 1 | $957 |
| #2 | 2 | 1 | $957 |
| Total (2 units) | $1,914 | ||
UW: 25.0% down · 7.5% · 30yr · 1.5% tax · 5.0% vac · 8.0% maint · 8.0% mgmt
Financing live
Cash to close
- Down payment
- $37,500
- Closing costs
- $4,500
- Reserves months
- —
- Total cash needed
- —
Loan-product check · same deal, 3 products live
Conventional
25% down · 7.5% · 30yr
- Down + closing
- —
- Monthly P&I
- —
- Monthly cashflow
- —
- DSCR
- —
- Eligible?
- —
Personal DTI + credit; lowest rate.
DSCR
20% down · 8.5% · 30yr
- Down + closing
- —
- Monthly P&I
- —
- Monthly cashflow
- —
- DSCR
- —
- Eligible?
- —
No personal income docs; deal must DSCR.
Hard money
10% down · 12.0% · 12mo
- Down + closing
- —
- Monthly P&I
- —
- Monthly cashflow
- —
- DSCR
- —
- Eligible?
- —
Short-term bridge; refi at stabilization.
Listing history 2 events
-
2026-04-24status Pending
-
2026-04-18$150,000 New
ⓘ Source: listings_history table (triggers on properties + properties_extension) + one-shot
backfill from property_details.listing_events for pre-trigger history.
Tax reassessment forecast NE · Resets to sale price
- Current annual tax
- $946 · $79/mo
- Projected year-2 tax
- $2,595 · $216/mo
- Expected delta
- +$1,649/yr (+$137/mo · 174.3%)
ⓘ Screening estimate from a state-policy table — verify with the county assessor before closing.
Climate risk First Street
- Flood 1/10 Low FEMA zone X (unshaded) · 0% chance over 30 yrs
- Wildfire 1/10 Low
- Heat 3/10 Moderate 7 d/yr ≥103°F today · 15 d/yr by 30 yrs out
- Wind 2/10 Low
- Air quality 1/10 Low 0 unhealthy d/yr today · 0 by 30 yrs out
Nearby sold comps map
Loading sold comps map…
Walkable amenities ~0.75 mi
Loading nearby amenities…
Taxation est. · year 1
- Rental income
- $22,968
- − Mortgage interest
- −$8,402
- − Property taxes
- −$946
- − Insurance
- −$750
- − Repairs & maintenance
- −$1,837
- − Management
- −$1,837
- − Depreciation
- −$4,364
- Taxable income
- $4,831
- Est. tax owed @ 24.0%
- −$1,159
- After-tax cash flow
- $5,850/yr
For passive investors: Depreciation is non-cash, so a rental often shows a tax loss while cash-flowing — sheltering income. Rental losses are passive: they offset passive income freely, and up to $25,000/yr can offset ordinary (W-2) income if you actively participate and your MAGI is under $100k (phasing out to $0 by $150k); unused losses carry forward. On sale, claimed depreciation is recaptured at up to 25%, and gains may owe capital-gains tax (a 1031 exchange can defer both). Figures are a year-1 estimate at your 24.0% rate — not tax advice; consult a CPA.
Schools (NCES district)
- District
- Oakland Craig Public Schools
- NCES district ID
- 3174640
- Math proficiency
- 55% ▼ -6.00%
- Reading proficiency
- 55% ▼ -2.00%
- Median HH income
- $50,268
- Composite
- 46.97/100
- National rank
- #2354
- State rank
- #39 of 111 in NE
Livability — Oakland
- Score
- 75/100
- State rank
- #98
- US rank
- #3931
Category grades
Schools grade is shown separately in the Schools card above.
Census & demographics
- Census place
- Oakland, NE
- Population (ZIP)
- 2,191
Population outlook (Burt County) Hauer SSP2
- Today (2025)
- 6,136 people
- By 2030
- 5,896 · -3.9%
- By 2040
- 5,446 · -11.2%
- By 2050
- 5,044 · -17.8%
- By 2075
- 4,535 · -26.1%
- By 2100
- 3,973 · -35.3%
Race, ethnicity, and origin ACS 2023
- Neighborhood character
- Predominantly White (93%)
- Race & ethnicity
- White 93% Two or more races 4%
- Common ancestry
- Slovak 2% Portuguese 2% Lithuanian 1%
- Languages at home
- 99% English-only · Spanish 1%
Political lean MEDSL · Burt
- 2024 margin
- Solid R (+45.1) · D 26.9% · R 72.0% · Other 1.1%
- 2008→2024 swing
- -30.5pp toward R · 2008: -14.6pp · 2024: -45.1pp
- All cycles
- 2024: R+45.1 2020: R+40.6 2016: R+40.6 2012: R+22.0 2008: R+14.6
Not yet ingested
- Civics
- —
Market trends
- HPI YoY
- ▲ 7.61%
- Current HPI
- 284.0072
- Rent YoY
- —
- Metro
- —
- State GDP YoY
- ▲ 0.68%
- F500 in state
- 2
Industry mix (Fortune 500 HQ in NE)
| Industry | F500 HQs | Revenue |
|---|---|---|
| Conglomerate | 1 | $371B |
|
||
Price history
2 events — show timeline
- 2026-04-24 Pending — GPRMLS
- 2026-04-18 Listed $150,000 GPRMLS
Property tax history
-2.3%/yrLatest (2025): $946 · -2.2% YoY. Source: county tax records.
Cash-flow waterfall
monthlySold comps — $/sqft
last 12 mo · ≤1 miLoading sold comps…