7500 144th St · Slaughterville, OK
Flood risk 1/10 · Minimal
- FEMA flood zone
- X (unshaded)
- Chance of flooding over 30 yrs
- 0.0%
- Est. flood insurance / yr
- $507 – $1,088
Fire risk 5/10 · Moderate
- Est. fire insurance / yr
- $2,463 – $4,575
Heat risk 5/10 · Moderate
- Hot days now (above 109°F)
- 7 days/yr
- Hot days in 30 yrs
- 18 days/yr
Wind risk 3/10 · Minor
- Chance of severe wind over 30 yrs
- 6.0%
Air-quality risk 2/10 · Minimal
- Unhealthy air days now
- 1 days/yr
- Unhealthy air days in 30 yrs
- 1 days/yr
Risk factors via First Street. Map © Google.
Why this score? — see what drove the C+ grade
The composite is a weighted blend of 9 inputs, each scored 0–100. Each bar is that input's sub-score; the figure is the points it added to the 100-point composite (weight × sub-score).
- Cash flow +27.5/30.0
- DSCR +9.6/10.0
- ARV discount +7.5/15.0
- 1% rule +6.3/10.0
- Livability +3.2/5.0
- Rent growth +2.5/5.0
- Condition / age +2.5/5.0
- Schools +2.1/10.0
- Appreciation +0.0/10.0
$129,500
🖨 Deal sheet (PDF) 📄 Offer letter ✓ Due diligence
Listing remarks
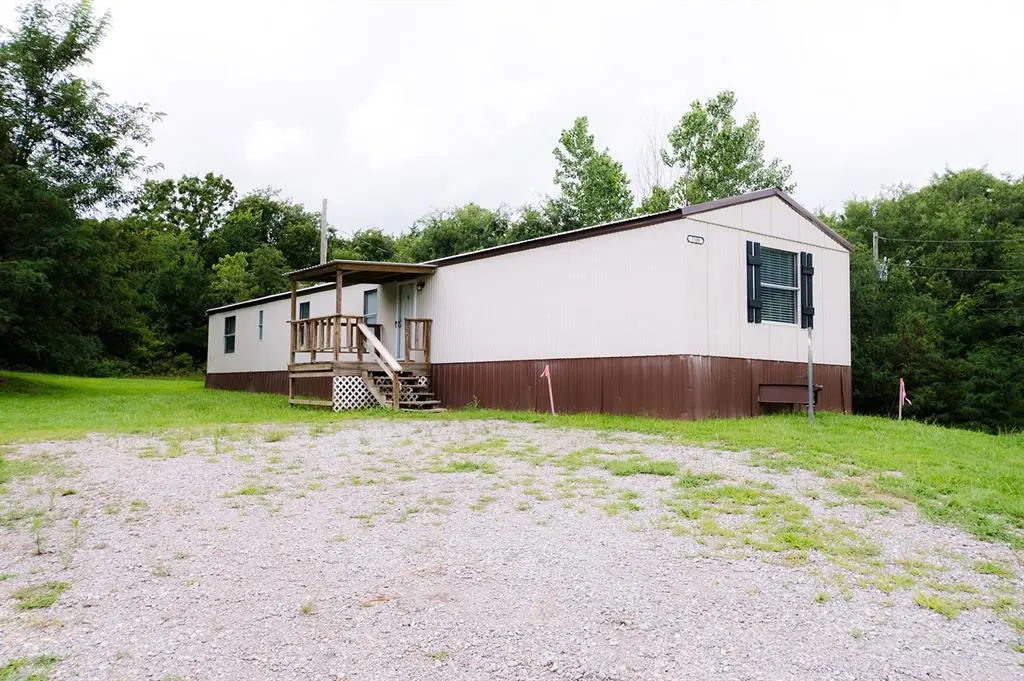
Discover peaceful country living with this inviting 3-bedroom, 2-bathroom mobile home set on a generous 1.3-acre lot in Hideaway Estates at 7500 144th St, Noble, OK, 73068. This property offers a tranquil retreat with plenty of outdoor space for relaxation, recreation, or room to expand. Enjoy easy access via County Road, making daily commutes and errands convenient. Inside, you'll find a comfortable layout featuring a bright living area and a well-appointed kitchen. The primary bedroom includes an ensuite bathroom for added comfort. For those looking for even more space, an adjacent 1.5-acre lot is also available for sale. Embrace the space, privacy, and convenience this property offers&md
Key facts
- Generous lot
- Bright living area
- Outdoor space
Tags
Property features AI
Finance
- Other: Property is existing (not new construction); Located in Hideaway Acres 1
- Financial info: Conventional financing available; Seller will finance; Not assumable; Loan qualification possible
- HOA & community: No mandatory association dues
Exterior
- Utilities: Electricity available; Propane
- Home design: Single family residence; One-level home; Manufactured construction
- Construction: Metal roof; Combination foundation; Manufactured construction
- Exterior features: Wooded lot; No exterior features listed
Interior
- Kitchen: Range
- Bedrooms: 3 bedrooms
- Bathrooms: 2 full bathrooms
- Heating & cooling: Electric heat
- Interior features: One living area; No fireplace; Vacant
Neighborhood map
What this means for you Summary
Snapshot
- This is a 3-bed/2.0-bath manufactured listed at $130k.
Deal economics
- At list price, monthly cash flow is $382 ($5k/yr) — positive.
- The deal already cash-flows at list — no discount required.
- Meets the 1% rule at list price ($1k rent vs $130k).
- Recommended offer: $122k (6.0% below list) — sets the bar for market timing.
- Cap rate 9.8% vs local median 4.4% in Slaughterville — top-decile yield for the area; either an underpriced asset or a hidden risk that comps aren't pricing in. Stress-test before assuming the spread holds.
Location & tenants
- Location reads 63/100 on livability (#228 in OK) — a middle-class / working-renter tenant base. Strengths: cost of living A+, housing A+, employment A; Watch: amenities F, commute F, health & safety F.
- Noble (suburban): math 23% / reading 25% proficiency, ranked #108 of 270 in OK (top 40%) — low school quality limits family demand, transient renter base, plan for 1-2y turnover.
- Zoned schools: John K Hubbard Es (math 27% / reading 27%, grade F, #311 of 845 statewide, top 40%, 646 students, 0% FRL); Noble Hs (math 17% / reading 27%, grade F, #222 of 447 statewide, top 52%, 883 students, 0% FRL) — zoned schools average 0% FRL vs 53% district-wide (53 pts lower); this property's tenant base skews higher-income than the district average.
- Market conditions: 215 active listings in the ZIP; 2 comparable units currently listed for rent nearby; 592 units permitted in Cleveland County in 2024 (12 in 5+ unit buildings).
Forward outlook
- Local home prices are declining (-3.0%/yr); year-one equity from $895 of loan paydown is wiped out by about $4k of value loss. Plan a longer hold.
- Cleveland County population projected at +40% by 2050 — long-run rental-demand tailwind backs the buy-and-hold thesis.
- At projected returns (-3.0% appreciation + 3.0% rent growth), your $36k cash investment doubles in ~9 years — after that, you're playing with house money.
Negotiation context
- It's been on market 68 days — a 6% lower offer ($122k) is reasonable based on typical stale-listing flexibility.
- 4 sale attempts since 9y ago with the ask held roughly flat each time — persistent listings suggest the price (not the market) is what's stuck; bring a comps-based counter.
- Current owner paid $62k; list at $130k implies a 107% gain — meaningful room to come down on a strong offer.
Risks & watch-outs
- Climate carrying-cost: moderate wildfire risk; extreme-heat days projected 7→18/yr by 2055 (HVAC capex compounding) — expect insurance premiums to compound above CPI over the hold.
Questions for the listing agent
- It's been on market 68 days. Have you received any prior offers? Is the seller open to a 6% concession, seller financing, or rate buy-down credit?
- Why hasn't it sold? Are there any deal-killer items the seller is aware of (foundation, flood, title, zoning, code violations)?
- Is there a deadline driving the sale (1031 exchange, divorce, estate, relocation)? That informs how much negotiation room exists.
- Schools are F-rated, which usually means shorter tenancies and higher turnover. Who's the typical renter profile here, and what's been the actual vacancy rate?
- What's the average days-on-market for RENTAL listings here right now (not sales)? A rising rental-DOM trend means longer vacancies and softer asking-rent achievability than the comps imply.
- What's the recent tenant-quality profile in this submarket — average credit score on applications, eviction rate, late-payment / NSF rate, and stable-employment percentage? A property-management company in the area should have these aggregated.
- How much new for-sale + rental construction is in the pipeline within 1–3 miles? Heavy new supply typically softens prices + rents 12–24 months out; constrained supply supports both.
Investment metrics
- 1% rule
- 1.13% ✓
- Cap rate
- 9.84%
- Cash-on-cash
- 12.65%
- DSCR
- 1.56
- GRM
- 7.4
CMA / ARV
No comps found within radius.
Projected returns pro-forma
-3.0% appreciation · 3.0% rent growth · sell at horizon
- IRR
- 2.4%
- Equity multiple
- 1.09×
- Total profit
- $3,314
- Equity at exit
- $19,309
- IRR
- 11.9%
- Equity multiple
- 1.94×
- Total profit
- $34,024
- Equity at exit
- $11,197
Cash invested: $36,260 (down + closing). Projections, not guarantees.
Landlord ↔ Tenant lean methodology
- Overall (STATE)
- 83 Strongly Landlord-Friendly
- State Oklahoma
- 83 Strongly Landlord-Friendly · R+20
- County
- — inherits STATE
- City
- — inherits STATE
ZIP-level market 73068
- Home prices YoY
- -4.8%
- Active inventory
- 215
- Price-to-rent
- 7.4×
Monthly cashflow live
- Estimated rent
- $1,460 medium interval (Pro) →
- Mortgage (P&I)
- −$679
- Tax from tax record
- −$38 /mo · $458/yr
- Insurance
- −$54
- HOA
- −$0
- Vacancy / Maint / Mgmt
- −$307
- Net cashflow
- $382
Break-even live
Sensitivity live
| Price | -10% $456 | -5% $419 | +0% $382 | +5% $346 | +10% $309 |
|---|---|---|---|---|---|
| Rent | -10% $267 | -5% $325 | +0% $382 | +5% $440 | +10% $498 |
| Rate | -1.0pp $448 | -0.5pp $415 | base $382 | +0.5pp $349 | +1.0pp $315 |
UW: 25.0% down · 7.5% · 30yr · 1.5% tax · 5.0% vac · 8.0% maint · 8.0% mgmt
Financing live
Cash to close
- Down payment
- $32,375
- Closing costs
- $3,885
- Reserves months
- —
- Total cash needed
- —
Loan-product check · same deal, 3 products live
Conventional
25% down · 7.5% · 30yr
- Down + closing
- —
- Monthly P&I
- —
- Monthly cashflow
- —
- DSCR
- —
- Eligible?
- —
Personal DTI + credit; lowest rate.
DSCR
20% down · 8.5% · 30yr
- Down + closing
- —
- Monthly P&I
- —
- Monthly cashflow
- —
- DSCR
- —
- Eligible?
- —
No personal income docs; deal must DSCR.
Hard money
10% down · 12.0% · 12mo
- Down + closing
- —
- Monthly P&I
- —
- Monthly cashflow
- —
- DSCR
- —
- Eligible?
- —
Short-term bridge; refi at stabilization.
Rent comps 2 comps
| Address | Beds | Baths | Sqft | Rent | $/sqft | DOM | Units | Dist |
|---|---|---|---|---|---|---|---|---|
| 7500 144th St Unit 17 Noble, OK | 3.0 | 2.0 | 1216 | $1,350 | $1.11 | 3d | 1 | 0.01mi |
| 7351 142nd St Unit 37 Noble, OK | 3.0 | 2.0 | 1216 | $1,350 | $1.11 | 3d | 1 | 0.11mi |
Listing history 36 events
-
2026-06-21days on market $129,500 Active 68 DOM
-
2026-06-18days on market $129,500 Active 65 DOM
-
2026-06-17days on market $129,500 Active 64 DOM
-
2026-06-16days on market $129,500 Active 63 DOM
-
2026-06-15days on market $129,500 Active 62 DOM
-
2026-06-13days on market $129,500 Active 60 DOM
-
2026-06-13days on market $129,500 Active 59 DOM
-
2026-06-09days on market $129,500 Active 56 DOM
-
2026-06-08days on market $129,500 Active 55 DOM
-
2026-06-07days on market $129,500 Active 54 DOM
-
2026-06-03days on market $129,500 Active 50 DOM
-
2026-06-02days on market $129,500 Active 49 DOM
-
2026-06-01days on market $129,500 Active 48 DOM
-
2026-05-31days on market $129,500 Active 47 DOM
-
2026-04-14$129,500 Active
-
2026-03-31historical
-
2025-12-22price $129,500
-
2025-08-25price $132,000
-
2025-07-12price $127,000
-
2025-04-24price $132,000
-
2025-01-06$145,000 Active
-
2018-06-01historical
-
2018-01-07$40,000 Active
-
2018-01-03historical
-
2017-10-19price $40,000
-
2017-09-20price $41,000
-
2017-08-18price $43,000
-
2017-08-11price $45,000
-
2017-07-13price $46,600
-
2017-06-27price $48,000
-
2017-05-24price $50,000
-
2017-05-19$53,000 Active
-
2008-12-09soldstatus $62,500
-
2005-02-03soldstatus $46,000
-
2004-06-10soldstatus $37,500
-
2004-06-09soldstatus $205,000
ⓘ Source: listings_history table (triggers on properties + properties_extension) + one-shot
backfill from property_details.listing_events for pre-trigger history.
Tax reassessment forecast OK · Resets to sale price
- Current annual tax
- $458 · $38/mo
- Projected year-2 tax
- $1,166 · $97/mo
- Expected delta
- +$708/yr (+$59/mo · 154.5%)
ⓘ Screening estimate from a state-policy table — verify with the county assessor before closing.
Climate risk First Street
- Flood 1/10 Low FEMA zone X (unshaded) · 0% chance over 30 yrs
- Wildfire 5/10 Major
- Heat 5/10 Major 7 d/yr ≥109°F today · 18 d/yr by 30 yrs out
- Wind 3/10 Moderate 6% chance of damaging wind over 30 yrs
- Air quality 2/10 Low 1 unhealthy d/yr today · 1 by 30 yrs out
Nearby sold comps map
Loading sold comps map…
Walkable amenities ~0.75 mi
Loading nearby amenities…
Taxation est. · year 1
- Rental income
- $17,523
- − Mortgage interest
- −$7,254
- − Property taxes
- −$458
- − Insurance
- −$648
- − Repairs & maintenance
- −$1,402
- − Management
- −$1,402
- − Depreciation
- −$3,767
- Taxable income
- $2,592
- Est. tax owed @ 24.0%
- −$622
- After-tax cash flow
- $3,966/yr
For passive investors: Depreciation is non-cash, so a rental often shows a tax loss while cash-flowing — sheltering income. Rental losses are passive: they offset passive income freely, and up to $25,000/yr can offset ordinary (W-2) income if you actively participate and your MAGI is under $100k (phasing out to $0 by $150k); unused losses carry forward. On sale, claimed depreciation is recaptured at up to 25%, and gains may owe capital-gains tax (a 1031 exchange can defer both). Figures are a year-1 estimate at your 24.0% rate — not tax advice; consult a CPA.
Schools (NCES district)
- District
- Noble
- NCES district ID
- 4021630
- Math proficiency
- 23% ▼ -8.00%
- Reading proficiency
- 25% ▼ -7.00%
- Median HH income
- $50,812
- Composite
- 21.31/100
- National rank
- #8384
- State rank
- #108 of 270 in OK
Livability — Slaughterville
- Score
- 63/100
- State rank
- #228
- US rank
- #15883
Category grades
Schools grade is shown separately in the Schools card above.
Census & demographics
- Census place
- Slaughterville, OK
- County
- Cleveland County · 239,547 people
- City population
- 12,003
- Metro
- Oklahoma City, OK
- Population (ZIP)
- 12,258
- Household income
- $73,821
- Rent vs Own
- Severe rent burden
- 301.0
Population outlook (Cleveland County) Hauer SSP2
- Today (2025)
- 323,621 people
- By 2030
- 349,070 · +7.9%
- By 2040
- 400,168 · +23.7%
- By 2050
- 454,101 · +40.3%
- By 2075
- 602,926 · +86.3%
- By 2100
- 734,485 · +127.0%
Race, ethnicity, and origin ACS 2023
- Neighborhood character
- Predominantly White (82%)
- Race & ethnicity
- White 82% Two or more races 8% Hispanic / Latino 5% Native American 5% Black 1%
- Hispanic origin (detail)
- Mexican 4% Puerto Rican 1%
- Common ancestry
- Slovak 3% Lithuanian 2% Italian 2%
- Foreign-born
- 1% · Canada
- Languages at home
- 98% English-only · Spanish 1%
Political lean MEDSL · Cleveland
- 2024 margin
- R (+14.9) · D 41.4% · R 56.4% · Other 2.2%
- 2008→2024 swing
- +9.1pp toward D · 2008: -24.0pp · 2024: -14.9pp
- All cycles
- 2024: R+14.9 2020: R+14.1 2016: R+21.7 2012: R+25.9 2008: R+24.0
Not yet ingested
- Civics
- —
Market trends
- HPI YoY
- ▼ -13.99%
- Current HPI
- 278.428
- Rent YoY
- —
- Metro
- Oklahoma City, OK
- State GDP YoY
- ▲ 1.55%
- F500 in state
- 6
Industry mix (Fortune 500 HQ in OK)
| Industry | F500 HQs | Revenue |
|---|---|---|
| Energy | 3 | $48B |
|
||
Price history
-36.8% since first listed22 events — show timeline
- 2026-04-14 Listed $129,500 MLSOK
- 2026-03-31 Listing Removed — MLSOK
- 2025-12-22 Price Changed $129,500 MLSOK
- 2025-08-25 Price Changed $132,000 MLSOK
- 2025-07-12 Price Changed $127,000 MLSOK
- 2025-04-24 Price Changed $132,000 MLSOK
- 2025-01-06 Listed $145,000 MLSOK
- 2018-06-01 Listing Removed — MLSOK
- 2018-01-07 Listed $40,000 MLSOK
- 2018-01-03 Listing Removed — MLSOK
- 2017-10-19 Price Changed $40,000 MLSOK
- 2017-09-20 Price Changed $41,000 MLSOK
- 2017-08-18 Price Changed $43,000 MLSOK
- 2017-08-11 Price Changed $45,000 MLSOK
- 2017-07-13 Price Changed $46,600 MLSOK
- 2017-06-27 Price Changed $48,000 MLSOK
- 2017-05-24 Price Changed $50,000 MLSOK
- 2017-05-19 Listed $53,000 MLSOK
- 2008-12-09 Sold (Public Records) $62,500 Public Records
- 2005-02-03 Sold (Public Records) $46,000 Public Records
- 2004-06-10 Sold (Public Records) $37,500 Public Records
- 2004-06-09 Sold (Public Records) $205,000 Public Records
Property tax history
-0.3%/yrLatest (2024): $458 · +5.0% YoY. Source: county tax records.
Cash-flow waterfall
monthlySold comps — $/sqft
last 12 mo · ≤1 miLoading sold comps…