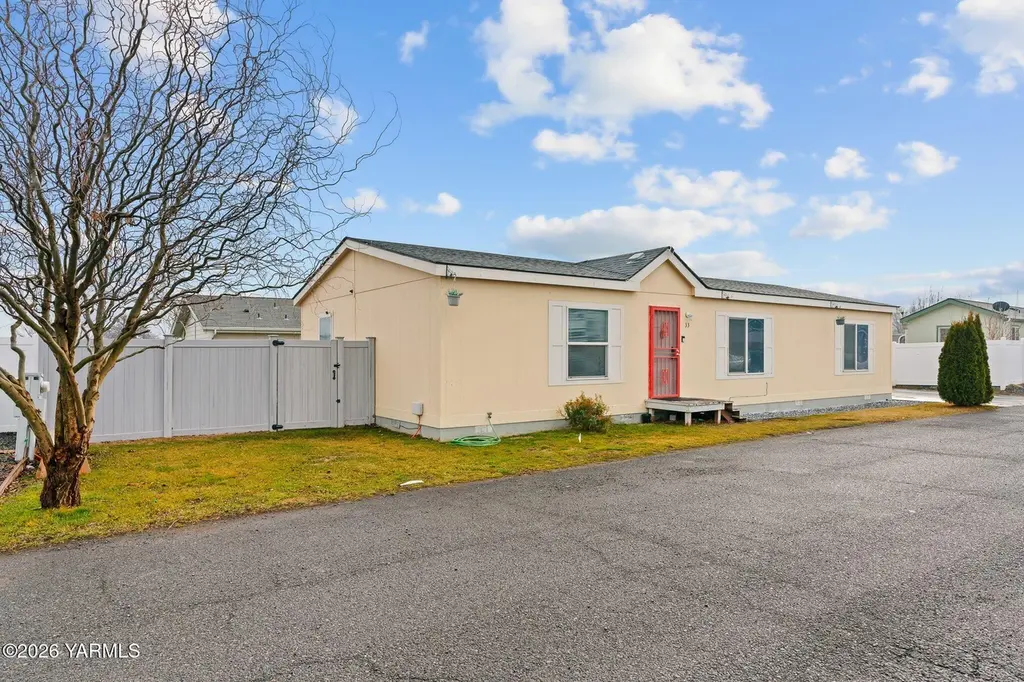
2802 S 5th Ave #33 · Union Gap, WA
Flood risk No data
- FEMA flood zone
- —
- Chance of flooding over 30 yrs
- —
- Est. flood insurance / yr
- —
Fire risk No data
- Est. fire insurance / yr
- —
Heat risk No data
- Hot days now (above threshold)
- —
- Hot days in 30 yrs
- —
Wind risk No data
- Chance of severe wind over 30 yrs
- —
Air-quality risk No data
- Unhealthy air days now
- —
- Unhealthy air days in 30 yrs
- —
Risk factors via First Street. Map © Google.
Why this score? — see what drove the B grade
The composite is a weighted blend of 9 inputs, each scored 0–100. Each bar is that input's sub-score; the figure is the points it added to the 100-point composite (weight × sub-score).
- Cash flow +30.0/30.0
- DSCR +10.0/10.0
- ARV discount +8.8/15.0
- 1% rule +8.2/10.0
- Schools +4.9/10.0
- Livability +3.3/5.0
- Rent growth +2.5/5.0
- Condition / age +2.5/5.0
- Appreciation +0.0/10.0
$138,320
🖨 Deal sheet 📄 Offer letter ✓ Due diligence
Listing remarks MLS
Spacious 3 bed, 2 bath home built in 2019 and located in Union Gap. Functional layout with great natural light, comfortable living space, and walk-in closets in every bedroom. Nice backyard for relaxing or entertaining, with convenient access to shopping and everyday amenities.
Key facts
- Convenient access
- Natural light
- Walk-in closets
Tags
Neighborhood map
What this means for you Summary
Snapshot
- This is a 3-bed/2.0-bath single-family listed at $138k.
Deal economics
- At list price, monthly cash flow is $607 ($7k/yr) — positive.
- The deal already cash-flows at list — no discount required.
- Meets the 1% rule at list price ($2k rent vs $138k).
- Recommended offer: $122k (12.0% below list) — sets the bar for market timing.
- Cap rate 11.6% vs local median 4.5% in Union Gap — top-decile yield for the area; either an underpriced asset or a hidden risk that comps aren't pricing in. Stress-test before assuming the spread holds.
Location & tenants
- Location reads 66/100 on livability (#315 in WA) — a middle-class / working-renter tenant base. Strengths: cost of living A+, housing A+, health & safety A-; Watch: schools D, crime F, amenities F.
- Union Gap School District (suburban): math 54% / reading 59% proficiency, ranked #105 of 291 in WA (top 36%) — acceptable for families but not a draw, mixed tenant base, ~2y average lease; 71% free/reduced lunch — lower-income household profile, screen leases tightly.
- Market conditions: 172 active listings in the ZIP; 6 comparable units currently listed for rent nearby; rentals at typical pace (median 21d on market — plan ~3-4 weeks tenant-placement turnaround); 468 units permitted in Yakima County in 2024 (23 in 5+ unit buildings).
Forward outlook
- Local home prices are declining (-3.0%/yr); year-one equity from $956 of loan paydown is wiped out by about $4k of value loss. Plan a longer hold.
- Yakima County population projected at +6% by 2050 — modest demand growth; plan on rents tracking national, not racing it.
- At projected returns (-3.0% appreciation + 3.0% rent growth), your $39k cash investment doubles in ~7 years — after that, you're playing with house money.
Negotiation context
- It's been on market 137 days — a 12% lower offer ($122k) is reasonable based on typical stale-listing flexibility.
- 3 sale attempts since 7y ago with the ask held roughly flat each time — persistent listings suggest the price (not the market) is what's stuck; bring a comps-based counter.
Questions for the listing agent
- It's been on market 137 days. Have you received any prior offers? Is the seller open to a 12% concession, seller financing, or rate buy-down credit?
- Why hasn't it sold? Are there any deal-killer items the seller is aware of (foundation, flood, title, zoning, code violations)?
- Is there a deadline driving the sale (1031 exchange, divorce, estate, relocation)? That informs how much negotiation room exists.
- Schools are D-rated, which usually means shorter tenancies and higher turnover. Who's the typical renter profile here, and what's been the actual vacancy rate?
- Crime grade is F in this area — have there been break-ins, vandalism, or insurance claims at this property in the last 3 years? What carrier currently insures it and at what premium?
- What's the average days-on-market for RENTAL listings here right now (not sales)? A rising rental-DOM trend means longer vacancies and softer asking-rent achievability than the comps imply.
- What's the recent tenant-quality profile in this submarket — average credit score on applications, eviction rate, late-payment / NSF rate, and stable-employment percentage? A property-management company in the area should have these aggregated.
- How much new for-sale + rental construction is in the pipeline within 1–3 miles? Heavy new supply typically softens prices + rents 12–24 months out; constrained supply supports both.
Investment metrics
- 1% rule
- 1.32% ✓
- Cap rate
- 11.56%
- Cash-on-cash
- 18.80%
- DSCR
- 1.84
- GRM
- 6.3
CMA / ARV
- ARV (median comp)
- $142,500
- List price
- $138,320
- Delta
- -2.93%
- Verdict
- FAIR
- Comps
- 7 within 1.0 mi
Show comp detail 1 sale within ~0.75 mi
| Address | Dist | Beds/Ba | Sqft | Sold | Price | $/sf | Match |
|---|---|---|---|---|---|---|---|
| 2203 S 5th Ave | 0.67mi | 3/1.0 | 1,424 (-2%) | 8mo | $250,000 | $176 | 55 |
Match score weights: distance 35% · size 25% · config 20% · recency 20%. Top-matched comps best support the ARV.
Projected returns pro-forma
-3.0% appreciation · 3.0% rent growth · sell at horizon
- IRR
- 10.6%
- Equity multiple
- 1.42×
- Total profit
- $16,195
- Equity at exit
- $20,624
- IRR
- 19.6%
- Equity multiple
- 2.64×
- Total profit
- $63,690
- Equity at exit
- $11,959
Cash invested: $38,730 (down + closing). Projections, not guarantees.
Landlord ↔ Tenant lean methodology
- Overall (STATE)
- 28 Tenant-Leaning
- State Washington
- 28 Tenant-Leaning · D+8
- County
- — inherits STATE
- City
- — inherits STATE
ZIP-level market 98903
- Home prices YoY
- -21.8%
- Active inventory
- 172
- Price-to-rent
- 6.3×
Monthly cashflow live
- Estimated rent
- $1,827 high interval (Pro) →
- Mortgage (P&I)
- −$725
- Tax from tax record
- −$53 /mo · $637/yr
- Insurance
- −$58
- HOA
- −$0
- Vacancy / Maint / Mgmt
- −$384
- Net cashflow
- $607
Break-even live
UW: 25.0% down · 7.5% · 30yr · 1.5% tax · 5.0% vac · 8.0% maint · 8.0% mgmt
Financing live
Cash to close
- Down payment
- $34,580
- Closing costs
- $4,150
- Reserves months
- —
- Total cash needed
- —
Loan-product check · same deal, 3 products live
Conventional
25% down · 7.5% · 30yr
- Down + closing
- —
- Monthly P&I
- —
- Monthly cashflow
- —
- DSCR
- —
- Eligible?
- —
Personal DTI + credit; lowest rate.
DSCR
20% down · 8.5% · 30yr
- Down + closing
- —
- Monthly P&I
- —
- Monthly cashflow
- —
- DSCR
- —
- Eligible?
- —
No personal income docs; deal must DSCR.
Hard money
10% down · 12.0% · 12mo
- Down + closing
- —
- Monthly P&I
- —
- Monthly cashflow
- —
- DSCR
- —
- Eligible?
- —
Short-term bridge; refi at stabilization.
Rent comps 6 comps
| Address | Beds | Baths | Sqft | Rent | $/sqft | DOM | Units | Dist |
|---|---|---|---|---|---|---|---|---|
| Samantha Ct Union Gap, WA | 3.0 | 2.5 | 1437 | $1,900 | $1.32 | 21d | 1 | 0.68mi |
| 2212 S 1st Ave Unit 1-3 Union Gap, WA | 3.0 | 2.0 | 1200 | $1,900 | $1.58 | 13d | 1 | 0.69mi |
| 1917 Landon Ave Union Gap, WA | 3.0 | 2.0 | 1400 | $2,100 | $1.50 | 43d | 1 | 1.03mi |
| 809 W Washington Ave Yakima, WA | 2.0 | 2.0 | 1264 | $1,595 | $1.26 | 13d | 1 | 1.15mi |
| 1106 Spokane St Yakima, WA | 3.0 | 1.0 | 1400 | $1,795 | $1.28 | 21d | 1 | 1.30mi |
| 1606 S 1st Ave Unit 1 Yakima, WA | 2.0 | 1.0 | 911 | $1,250 | $1.37 | 13d | 1 | 1.45mi |
Listing history 19 events
-
2026-06-19days on market $138,320 Active 137 DOM
-
2026-06-18days on market $138,320 Active 136 DOM
-
2026-06-17days on market $138,320 Active 135 DOM
-
2026-06-16days on market $138,320 Active 134 DOM
-
2026-06-15days on market $138,320 Active 133 DOM
-
2026-06-14days on market $138,320 Active 131 DOM
-
2026-06-13days on market $138,320 Active 130 DOM
-
2026-06-10days on market $138,320 Active 128 DOM
-
2026-06-09days on market $138,320 Active 127 DOM
-
2026-06-08days on market $138,320 Active 126 DOM
-
2026-06-07days on market $138,320 Active 125 DOM
-
2026-06-03days on market $138,320 Active 121 DOM
-
2026-06-02days on market $138,320 Active 120 DOM
-
2026-06-01days on market $138,320 Active 119 DOM
-
2026-05-31days on market $138,320 Active 118 DOM
-
2026-05-30days on market $138,320 Active 117 DOM
-
2026-02-02$138,320 Active 278-char remark
Show marketing remark (278 chars)
Spacious 3 bed, 2 bath home built in 2019 and located in Union Gap. Functional layout with great natural light, comfortable living space, and walk-in closets in every bedroom. Nice backyard for relaxing or entertaining, with convenient access to shopping and everyday amenities.
-
2019-08-16$94,999
-
2019-08-16$94,999
ⓘ Source: listings_history table (triggers on properties + properties_extension) + one-shot
backfill from property_details.listing_events for pre-trigger history.
Tax reassessment forecast WA · Resets to sale price
- Current annual tax
- $637 · $53/mo
- Projected year-2 tax
- $1,356 · $113/mo
- Expected delta
- +$719/yr (+$60/mo · 112.8%)
ⓘ Screening estimate from a state-policy table — verify with the county assessor before closing.
Nearby sold comps map
Loading sold comps map…
Walkable amenities ~0.75 mi
Loading nearby amenities…
Taxation est. · year 1
- Rental income
- $21,919
- − Mortgage interest
- −$7,748
- − Property taxes
- −$637
- − Insurance
- −$692
- − Repairs & maintenance
- −$1,754
- − Management
- −$1,754
- − Depreciation
- −$4,024
- Taxable income
- $5,311
- Est. tax owed @ 24.0%
- −$1,275
- After-tax cash flow
- $6,008/yr
For passive investors: Depreciation is non-cash, so a rental often shows a tax loss while cash-flowing — sheltering income. Rental losses are passive: they offset passive income freely, and up to $25,000/yr can offset ordinary (W-2) income if you actively participate and your MAGI is under $100k (phasing out to $0 by $150k); unused losses carry forward. On sale, claimed depreciation is recaptured at up to 25%, and gains may owe capital-gains tax (a 1031 exchange can defer both). Figures are a year-1 estimate at your 24.0% rate — not tax advice; consult a CPA.
Schools (NCES district)
- District
- Union Gap School District
- NCES district ID
- 5309150
- Math proficiency
- 54% ▬ 0.00%
- Reading proficiency
- 59% ▲ 4.00%
- Median HH income
- $35,603
- Composite
- 48.54/100
- National rank
- #4614
- State rank
- #105 of 291 in WA
Livability — Union Gap
- Score
- 66/100
- State rank
- #315
- US rank
- #11294
Category grades
Schools grade is shown separately in the Schools card above.
Census & demographics
- Census place
- Union Gap, WA
- Population (ZIP)
- 19,010
Population outlook (Yakima County) Hauer SSP2
- Today (2025)
- 256,514 people
- By 2030
- 259,403 · +1.1%
- By 2040
- 265,677 · +3.6%
- By 2050
- 273,061 · +6.5%
- By 2075
- 296,991 · +15.8%
- By 2100
- 315,291 · +22.9%
Race, ethnicity, and origin ACS 2023
- Neighborhood character
- Diverse neighborhood (Simpson 0.58)
- Race & ethnicity
- White 49% Hispanic / Latino 42% Two or more races 19% Asian 3% Native American 3%
- Hispanic origin (detail)
- Mexican 38%
- Common ancestry
- Italian 3% Portuguese 2% Lithuanian 1%
- Foreign-born
- 15% · Canada, Vietnam
- Languages at home
- 63% English-only · Spanish 33% Other Asian/Pacific 1% Other Indo-European 1%
Political lean MEDSL · Yakima
- 2024 margin
- R (+14.3) · D 41.6% · R 55.9% · Other 2.5%
- 2008→2024 swing
- -3.8pp toward R · 2008: -10.6pp · 2024: -14.3pp
- All cycles
- 2024: R+14.3 2020: R+7.7 2016: R+15.4 2012: R+15.1 2008: R+10.6
Not yet ingested
- Civics
- —
Market trends
- HPI YoY
- ▼ -83.90%
- Current HPI
- 300.5753
- Rent YoY
- —
- Metro
- —
- State GDP YoY
- ▲ 4.65%
- F500 in state
- 22
Industry mix (Fortune 500 HQ in WA)
| Industry | F500 HQs | Revenue |
|---|---|---|
| Retail | 2 | $269B |
|
||
| Technology / Retail | 1 | $638B |
|
||
| Technology | 1 | $245B |
|
||
| Telecommunications | 1 | $38B |
|
||
| Food / Beverage | 1 | $36B |
|
||
| Automotive / Trucks | 1 | $34B |
|
||
Price history
+45.6% since first listed3 events — show timeline
- 2026-02-02 Listed $138,320 YAMLS
- 2019-08-16 Listed $94,999 YAMLS
- 2019-08-16 Listed $94,999 PACMLS
Property tax history
-4.9%/yrLatest (2026): $637 · -9.1% YoY. Source: county tax records.
Cash-flow waterfall
monthlySold comps — $/sqft
last 12 mo · ≤1 miLoading sold comps…