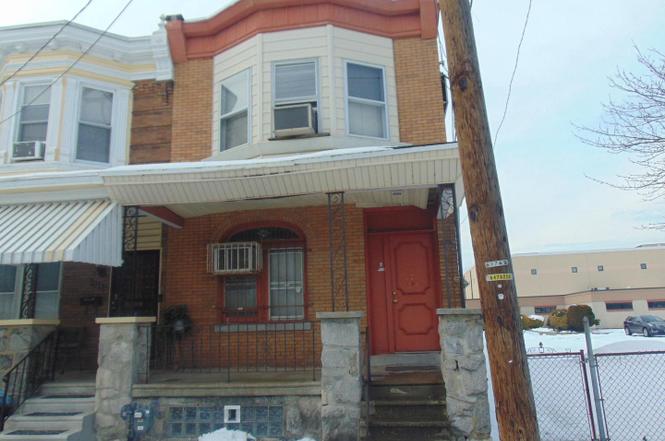
1909 7th S · Camden, NJ
Flood risk 1/10 · Minimal
- FEMA flood zone
- X (unshaded)
- Chance of flooding over 30 yrs
- 0.0%
- Est. flood insurance / yr
- $507 – $1,088
Fire risk 1/10 · Minimal
- Est. fire insurance / yr
- $526 – $976
Heat risk 7/10 · Major
- Hot days now (above 103°F)
- 7 days/yr
- Hot days in 30 yrs
- 15 days/yr
Wind risk 6/10 · Moderate
- Chance of severe wind over 30 yrs
- 40.0%
Air-quality risk 4/10 · Minor
- Unhealthy air days now
- 5 days/yr
- Unhealthy air days in 30 yrs
- 6 days/yr
Risk factors via First Street. Map © Google.
Why this score? — see what drove the C grade
The composite is a weighted blend of 9 inputs, each scored 0–100. Each bar is that input's sub-score; the figure is the points it added to the 100-point composite (weight × sub-score).
- Cash flow +29.2/30.0
- DSCR +10.0/10.0
- 1% rule +8.2/10.0
- Livability +3.5/5.0
- Rent growth +2.5/5.0
- Condition / age +1.0/5.0
- Schools +0.7/10.0
- ARV discount +0.0/15.0
- Appreciation +0.0/10.0
$129,000
🖨 Deal sheet (PDF) 📄 Offer letter ✓ Due diligence
Listing remarks
This 3-bedroom twin home offers a prime opportunity for investors or savvy buyers looking to restore and add value. Located in a growing urban neighborhood, the property is in need of substantial renovations throughout, including updates to major systems, interior finishes, and exterior improvements. With the right vision and repairs, this home has the potential to be transformed into a solid income-producing property or comfortable residence. Positioned in an area experiencing significant redevelopment, the surrounding community has seen the addition of newly constructed senior citizen housing and modern affordable housing developments in the immediate vicinity. This ongoing revitalization
Key facts
- Interior finishes
- Community amenities
- Built 1940
Tags
Neighborhood map
What this means for you Summary
Snapshot
- This is a 3-bed/1.0-bath townhouse listed at $129k. Condition is rated poor.
Deal economics
- At list price, monthly cash flow is $451 ($5k/yr) — positive.
- The deal already cash-flows at list — no discount required.
- Meets the 1% rule at list price ($2k rent vs $129k).
- Recommended offer: $127k (1.5% below list) — sets the bar for market timing.
- Cap rate 10.5% vs local median 7.0% in Camden — top-decile yield for the area; either an underpriced asset or a hidden risk that comps aren't pricing in. Stress-test before assuming the spread holds.
Location & tenants
- Location reads 70/100 on livability (#262 in NJ) — a middle-class / working-renter tenant base. Strengths: amenities A+, commute A+, cost of living A; Watch: schools F, crime F, employment F.
- Camden City School District (urban): math 3% / reading 16% proficiency, ranked #472 of 472 in NJ (top 100%) — low school quality limits family demand, transient renter base, plan for 1-2y turnover; 86% free/reduced lunch — lower-income household profile, screen leases tightly.
- Market conditions: 96 active listings in the ZIP; 15 comparable units currently listed for rent nearby; rentals at typical pace (median 20d on market — plan ~3-4 weeks tenant-placement turnaround); 1,018 units permitted in Camden County in 2024 (509 in 5+ unit buildings).
Forward outlook
- Local home prices are declining (-3.0%/yr); year-one equity from $892 of loan paydown is wiped out by about $4k of value loss. Plan a longer hold.
- Camden County population projected to shrink 8% by 2050 — rents likely to lag national; underwrite the cash flow, not the appreciation.
- At projected returns (-3.0% appreciation + 3.0% rent growth), your $36k cash investment doubles in ~8 years — after that, you're playing with house money.
Negotiation context
- It's been on market 18 days — a 2% lower offer ($127k) is reasonable based on typical stale-listing flexibility.
Risks & watch-outs
- Watch-outs: built in 1940 — expect roof / HVAC / electrical / plumbing capex.
- Climate carrying-cost: major wind risk, 40% chance of damaging wind over 30y; extreme-heat days projected 7→15/yr by 2055 (HVAC capex compounding) — expect insurance premiums to compound above CPI over the hold.
Questions for the listing agent
- Have any recent inspections been done? Can we get a copy of the seller's disclosures and any deferred-maintenance estimates?
- Built in 1940 — when were the roof, HVAC, electrical panel, plumbing, and water heater last replaced?
- Is there a deadline driving the sale (1031 exchange, divorce, estate, relocation)? That informs how much negotiation room exists.
- Schools are F-rated, which usually means shorter tenancies and higher turnover. Who's the typical renter profile here, and what's been the actual vacancy rate?
- Crime grade is F in this area — have there been break-ins, vandalism, or insurance claims at this property in the last 3 years? What carrier currently insures it and at what premium?
- What's the average days-on-market for RENTAL listings here right now (not sales)? A rising rental-DOM trend means longer vacancies and softer asking-rent achievability than the comps imply.
- What's the recent tenant-quality profile in this submarket — average credit score on applications, eviction rate, late-payment / NSF rate, and stable-employment percentage? A property-management company in the area should have these aggregated.
- How much new for-sale + rental construction is in the pipeline within 1–3 miles? Heavy new supply typically softens prices + rents 12–24 months out; constrained supply supports both.
Investment metrics
- 1% rule
- 1.32% ✓
- Cap rate
- 10.49%
- Cash-on-cash
- 14.99%
- DSCR
- 1.67
- GRM
- 6.3
CMA / ARV
- ARV (on-the-fly)
- $97,500
- Comps found
- 12
Show comp detail 12 sales within ~0.75 mi
| Address | Dist | Beds/Ba | Sqft | Sold | Price | $/sf | Match |
|---|---|---|---|---|---|---|---|
| 1522 S 10th St | 0.52mi | 3/1.0 | 1,429 (-5%) | 2mo | $125,000 | $87 | 66 |
| 1099 Morton St | 0.55mi | 3/1.0 | 1,431 (-5%) | 1mo | $65,000 | $45 | 66 |
| 1165 Morton St | 0.63mi | 3/1.0 | 1,557 (+4%) | 2mo | $80,000 | $51 | 62 |
| 936 Mechanic St | 0.70mi | 3/1.0 | 1,408 (-6%) | 1mo | $78,750 | $56 | 56 |
| 1514 Newport St | 0.59mi | 3/1.0 | 1,629 (+9%) | 2mo | $72,000 | $44 | 56 |
| 933 Lansdowne Ave | 0.63mi | 3/1.0 | 1,372 (-8%) | 1mo | $219,000 | $160 | 55 |
| 1155 Whitman Ave | 0.72mi | 3/1.5 | 1,431 (-5%) | 2mo | $206,000 | $144 | 55 |
| 1175 Chase St | 0.62mi | 3/1.0 | 1,390 (-7%) | 5mo | $55,000 | $40 | 55 |
| 808 Morgan St | 0.56mi | 3/1.5 | 1,680 (+12%) | 1mo | $200,000 | $119 | 51 |
| 1085 Morton St | 0.53mi | 3/1.0 | 1,280 (-15%) | 1mo | $83,000 | $65 | 50 |
| 1173 Whitman Ave | 0.74mi | 3/1.0 | 1,343 (-10%) | 4mo | $106,000 | $79 | 45 |
| 425 Atlantic Ave | 0.68mi | 3/1.0 | 1,289 (-14%) | 4mo | $64,000 | $50 | 41 |
Match score weights: distance 35% · size 25% · config 20% · recency 20%. Top-matched comps best support the ARV.
Projected returns pro-forma
-3.0% appreciation · 3.0% rent growth · sell at horizon
- IRR
- 5.6%
- Equity multiple
- 1.22×
- Total profit
- $7,852
- Equity at exit
- $19,234
- IRR
- 15.0%
- Equity multiple
- 2.22×
- Total profit
- $43,936
- Equity at exit
- $11,154
Cash invested: $36,120 (down + closing). Projections, not guarantees.
Landlord ↔ Tenant lean methodology
- Overall (STATE)
- 21 Tenant-Leaning
- State New Jersey
- 21 Tenant-Leaning · D+6
- County
- — inherits STATE
- City
- — inherits STATE
ZIP-level market 08104
- Active inventory
- 96
- Price-to-rent
- 6.3×
Monthly cashflow live
- Estimated rent
- $1,699 high interval (Pro) →
- Mortgage (P&I)
- −$676
- Tax est. 1.5%
- −$161 /mo · $1,935/yr
- Insurance
- −$54
- HOA
- −$0
- Vacancy / Maint / Mgmt
- −$357
- Net cashflow
- $451
Break-even live
Sensitivity live
| Price | -10% $540 | -5% $496 | +0% $451 | +5% $407 | +10% $362 |
|---|---|---|---|---|---|
| Rent | -10% $317 | -5% $384 | +0% $451 | +5% $518 | +10% $585 |
| Rate | -1.0pp $516 | -0.5pp $484 | base $451 | +0.5pp $418 | +1.0pp $384 |
UW: 25.0% down · 7.5% · 30yr · 1.5% tax · 5.0% vac · 8.0% maint · 8.0% mgmt
Financing live
Cash to close
- Down payment
- $32,250
- Closing costs
- $3,870
- Reserves months
- —
- Total cash needed
- —
Loan-product check · same deal, 3 products live
Conventional
25% down · 7.5% · 30yr
- Down + closing
- —
- Monthly P&I
- —
- Monthly cashflow
- —
- DSCR
- —
- Eligible?
- —
Personal DTI + credit; lowest rate.
DSCR
20% down · 8.5% · 30yr
- Down + closing
- —
- Monthly P&I
- —
- Monthly cashflow
- —
- DSCR
- —
- Eligible?
- —
No personal income docs; deal must DSCR.
Hard money
10% down · 12.0% · 12mo
- Down + closing
- —
- Monthly P&I
- —
- Monthly cashflow
- —
- DSCR
- —
- Eligible?
- —
Short-term bridge; refi at stabilization.
Rent comps 15 comps
| Address | Beds | Baths | Sqft | Rent | $/sqft | DOM | Units | Dist |
|---|---|---|---|---|---|---|---|---|
| 1502 S 9th St Camden, NJ | 2.0 | 1.0 | 1050 | $1,475 | $1.40 | 21d | 1 | 0.52mi |
| 457 Mechanic St Camden, NJ | 3.0 | 2.0 | 1200 | $1,950 | $1.62 | 20d | 1 | 0.73mi |
| 209 Cedar Ave Oaklyn, NJ | 2.0 | 1.0 | 1400 | $1,500 | $1.07 | 18d | 1 | 0.85mi |
| 209 Cedar Ave Oaklyn, NJ | 2.0 | 1.0 | 1400 | $1,800 | $1.29 | 6d | 1 | 0.85mi |
| 1055 Kenwood Ave Camden, NJ | 4.0 | 1.0 | 1088 | $1,875 | $1.72 | 25d | 1 | 1.15mi |
| 840 Haddon Ave Unit A Camden, NJ | 2.0 | 1.0 | 2032 | $1,725 | $0.85 | 25d | 1 | 1.17mi |
| 1455 Wildwood Ave Camden, NJ | 3.0 | 1.5 | 1353 | $1,900 | $1.40 | 11d | 1 | 1.19mi |
| 708 Royden St Camden, NJ | 3.0 | 1.0 | 1113 | $1,595 | $1.43 | 19d | 1 | 1.22mi |
| 537 Newton Ave Camden, NJ | 2.0 | 1.0 | 1092 | $1,500 | $1.37 | 14d | 1 | 1.25mi |
| 537 Newton Ave Camden, NJ | 2.0 | 1.0 | 1092 | $1,500 | $1.37 | 20d | 1 | 1.25mi |
| 609 Henry St Camden, NJ | 3.0 | 1.0 | 1290 | $1,600 | $1.24 | 25d | 1 | 1.28mi |
| 3132 Independence Rd Camden, NJ | 3.0 | 1.5 | 1168 | $1,595 | $1.37 | 23d | 1 | 1.30mi |
| 1509 Park Blvd Camden, NJ | 1.0–2.0 | 1.0 | 1075 | $1,650 | $1.53 | 25d | 1 | 1.31mi |
| 440 Henry St Camden, NJ | 3.0 | 1.5 | 1224 | $2,200 | $1.80 | 25d | 1 | 1.43mi |
| 1034 Collings Ave Oaklyn, NJ | 2.0 | 1.0 | 1100 | $1,750 | $1.59 | 20d | 1 | 1.47mi |
Listing history 4 events
-
2026-06-21days on market $129,000 Active 18 DOM
-
2026-06-18status $129,000 Active 15 DOM
-
2026-03-20status Pending
-
2026-03-05$129,000 Active
ⓘ Source: listings_history table (triggers on properties + properties_extension) + one-shot
backfill from property_details.listing_events for pre-trigger history.
Climate risk First Street
- Flood 1/10 Low FEMA zone X (unshaded) · 0% chance over 30 yrs
- Wildfire 1/10 Low
- Heat 7/10 Severe 7 d/yr ≥103°F today · 15 d/yr by 30 yrs out
- Wind 6/10 Major 40% chance of damaging wind over 30 yrs
- Air quality 4/10 Moderate 5 unhealthy d/yr today · 6 by 30 yrs out
Nearby sold comps map
Loading sold comps map…
Walkable amenities ~0.75 mi
Loading nearby amenities…
Taxation est. · year 1
- Rental income
- $20,394
- − Mortgage interest
- −$7,226
- − Property taxes
- −$1,935
- − Insurance
- −$645
- − Repairs & maintenance
- −$1,631
- − Management
- −$1,631
- − Depreciation
- −$3,753
- Taxable income
- $3,572
- Est. tax owed @ 24.0%
- −$857
- After-tax cash flow
- $4,556/yr
For passive investors: Depreciation is non-cash, so a rental often shows a tax loss while cash-flowing — sheltering income. Rental losses are passive: they offset passive income freely, and up to $25,000/yr can offset ordinary (W-2) income if you actively participate and your MAGI is under $100k (phasing out to $0 by $150k); unused losses carry forward. On sale, claimed depreciation is recaptured at up to 25%, and gains may owe capital-gains tax (a 1031 exchange can defer both). Figures are a year-1 estimate at your 24.0% rate — not tax advice; consult a CPA.
Condition & rehab AI · 14 photos
This 3-bedroom twin home is in poor condition and requires extensive renovations throughout, including updates to major systems, interior finishes, and exterior improvements. With the right vision and repairs, this home has the potential to be transformed into a solid income-producing property or comfortable residence.
Repairs flagged
- Major roof — The roof appears to be in poor condition, with visible damage and potential leaks.
- Major exterior siding — The exterior siding is in poor condition, with visible wear and tear. The paint is peeling and the overall appearance is dilapidated.
- Major flooring — The flooring appears to be in poor condition, with visible wear and tear. The carpet is frayed and the flooring is uneven.
- Major interior walls — The interior walls are in poor condition, with visible damage and potential water damage. The paint is peeling and the walls are uneven.
- Major HVAC and mechanical systems — The HVAC and mechanical systems appear to be in poor condition, with visible damage and potential issues.
Value-add opportunities
- Both roof replacement — A new roof will improve the overall appearance and functionality of the property, making it more attractive to buyers and renters.
- Both exterior siding and paint — Updating the exterior siding and repainting will improve the curb appeal and overall appearance of the property, making it more attractive to buyers and renters.
- Both flooring — Replacing the flooring with new, durable flooring will improve the overall appearance and functionality of the property, making it more attractive to buyers and renters.
- Both interior walls and paint — Repainting the interior walls and repairing any damage will improve the overall appearance and functionality of the property, making it more attractive to buyers and renters.
- Both HVAC and mechanical systems — Updating the HVAC and mechanical systems will improve the overall functionality and energy efficiency of the property, making it more attractive to buyers and renters.
Renovation cost estimate screening
| Repair item | Severity | Est. cost |
|---|---|---|
| roof · The roof appears to be in poor condition, with visible damage and potential leaks. | Major | $15,000–50,000 |
| exterior siding · The exterior siding is in poor condition, with visible wear and tear. The paint is peeling and the overall appearance is dilapidated. | Major | $15,000–50,000 |
| flooring · The flooring appears to be in poor condition, with visible wear and tear. The carpet is frayed and the flooring is uneven. | Major | $15,000–50,000 |
| interior walls · The interior walls are in poor condition, with visible damage and potential water damage. The paint is peeling and the walls are uneven. | Major | $15,000–50,000 |
| HVAC and mechanical systems · The HVAC and mechanical systems appear to be in poor condition, with visible damage and potential issues. | Major | $15,000–50,000 |
| Total estimated repair cost · 5 items | $75,000–250,000 |
Value-add ROI direction
- Both roof replacement — A new roof will improve the overall appearance and functionality of the property, making it more attractive to buyers and renters. ↑
- Both exterior siding and paint — Updating the exterior siding and repainting will improve the curb appeal and overall appearance of the property, making it more attractive to buyers and renters. ↑
- Both flooring — Replacing the flooring with new, durable flooring will improve the overall appearance and functionality of the property, making it more attractive to buyers and renters. ↑
- Both interior walls and paint — Repainting the interior walls and repairing any damage will improve the overall appearance and functionality of the property, making it more attractive to buyers and renters. ↑
- Both HVAC and mechanical systems — Updating the HVAC and mechanical systems will improve the overall functionality and energy efficiency of the property, making it more attractive to buyers and renters. ↑
ⓘ Cost ranges are severity-bucket heuristics (US national rule-of-thumb). Get contractor quotes + a written scope before underwriting a rehab budget.
Schools (NCES district)
- District
- Camden City School District
- NCES district ID
- 3402640
- Math proficiency
- 3% ▼ -6.00%
- Reading proficiency
- 16% ▬ 0.00%
- Median HH income
- $25,845
- Composite
- 6.85/100
- National rank
- #9981
- State rank
- #472 of 472 in NJ
Livability — Camden
- Score
- 70/100
- State rank
- #262
- US rank
- #7721
Category grades
Schools grade is shown separately in the Schools card above.
Census & demographics
- Census place
- Camden, NJ
- City population
- 20,865
- Population (ZIP)
- 21,508
Population outlook (Camden County) Hauer SSP2
- Today (2025)
- 507,964 people
- By 2030
- 502,182 · -1.1%
- By 2040
- 485,602 · -4.4%
- By 2050
- 465,630 · -8.3%
- By 2075
- 419,986 · -17.3%
- By 2100
- 369,492 · -27.3%
Race, ethnicity, and origin ACS 2023
- Neighborhood character
- Diverse neighborhood (Simpson 0.56)
- Race & ethnicity
- Black 53% Hispanic / Latino 40% Two or more races 9% White 2% Asian 1%
- Hispanic origin (detail)
- Mexican 2% Puerto Rican 22% Cuban 2% Dominican 9%
- Common ancestry
- Hispanic 2%
- Foreign-born
- 9% · Canada, Vietnam
- Languages at home
- 69% English-only · Spanish 29% Vietnamese 1%
Political lean MEDSL · Camden
- 2024 margin
- Strong D (+27.4) · D 63.0% · R 35.5% · Other 1.5%
- 2008→2024 swing
- -8.8pp toward R · 2008: 36.2pp · 2024: 27.4pp
- All cycles
- 2024: D+27.4 2020: D+33.5 2016: D+32.4 2012: D+36.6 2008: D+36.2
Not yet ingested
- Civics
- —
Market trends
- HPI YoY
- ▼ -123.43%
- Current HPI
- 209.3596
- Rent YoY
- —
- Metro
- —
- State GDP YoY
- ▲ 2.05%
- F500 in state
- 34
Industry mix (Fortune 500 HQ in NJ)
| Industry | F500 HQs | Revenue |
|---|---|---|
| Consumer Goods | 3 | $31B |
|
||
| Pharmaceuticals | 2 | $153B |
|
||
| Technology | 2 | $21B |
|
||
| Insurance | 2 | $20B |
|
||
| Healthcare | 2 | $19B |
|
||
| Financial Services | 1 | $70B |
|
||
Price history
2 events — show timeline
- 2026-03-20 Pending — BRIGHT MLS
- 2026-03-05 Listed $129,000 BRIGHT MLS
Cash-flow waterfall
monthlySold comps — $/sqft
last 12 mo · ≤1 miLoading sold comps…