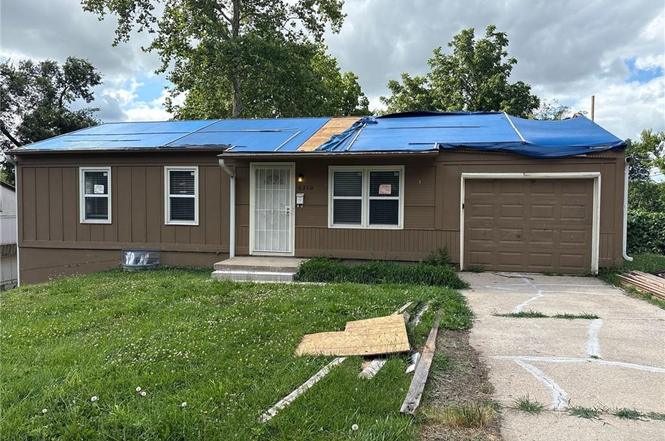
6310 E 153rd St · Grandview, MO
Flood risk 1/10 · Minimal
- FEMA flood zone
- X (unshaded)
- Chance of flooding over 30 yrs
- 0.0%
- Est. flood insurance / yr
- $473 – $860
Fire risk 3/10 · Minor
- Est. fire insurance / yr
- $1,054 – $1,958
Heat risk 4/10 · Minor
- Hot days now (above 106°F)
- 7 days/yr
- Hot days in 30 yrs
- 17 days/yr
Wind risk 2/10 · Minimal
- Chance of severe wind over 30 yrs
- —
Air-quality risk 2/10 · Minimal
- Unhealthy air days now
- 2 days/yr
- Unhealthy air days in 30 yrs
- 2 days/yr
Risk factors via First Street. Map © Google.
Why this score? — see what drove the B- grade
The composite is a weighted blend of 9 inputs, each scored 0–100. Each bar is that input's sub-score; the figure is the points it added to the 100-point composite (weight × sub-score).
- Cash flow +26.5/30.0
- ARV discount +15.0/15.0
- DSCR +9.0/10.0
- 1% rule +6.8/10.0
- Rent growth +4.0/5.0
- Livability +3.1/5.0
- Condition / age +2.5/5.0
- Schools +2.1/10.0
- Appreciation +0.0/10.0
$114,000
🖨 Deal sheet (PDF) 📄 Offer letter ✓ Due diligence
Listing remarks MLS
Wonderful Investment Opportunity! Already rented out and cash flowing! Nothing left to do but start collecting rents. Seller is willing to sell 19 similar homes individually or as a package. Please do not approach tenants. No sign in yard. Rents for $719 Buyer to verify information
Key facts
- Solid wood cabinetry
- Black appliances
- Desirable location
Tags
Property features AI
Finance
- Other: Above-grade living area reported as 925 (owner provided); Property age described as 51–75 years
- Financial info: No financial or investor-specific details provided
- HOA & community: No association fees
Exterior
- Parking: Attached garage that faces the front (1 garage space)
- Security: No security details provided
- Utilities: Public water; Public sewer
- Home design: Single-family residence; Residential property; North-facing
- Construction: Vinyl siding and wood siding exterior; Other roof type
- Exterior features: Property is in a flood plain; Lot reported as approximately 9,583 square feet
Interior
- Kitchen: No specific kitchen appliance details provided
- Bedrooms: 3 bedrooms (all on the first level)
- Flooring: No flooring details provided
- Bathrooms: 1 full bathroom; 1 half bathroom
- Heating & cooling: Natural gas heating; Electric cooling (central cooling present)
- Interior features: Basement other features; Open floor plan described as 'Other'
- Laundry & utility: No laundry or utility appliance details provided
Neighborhood map
What this means for you Summary
Snapshot
- This is a 3-bed/1.5-bath single-family listed at $114k.
Deal economics
- At list price, monthly cash flow is $301 ($4k/yr) — positive.
- The deal already cash-flows at list — no discount required.
- Meets the 1% rule at list price ($1k rent vs $114k).
- Recommended offer: $100k (12.0% below list) — sets the bar for market timing.
- Cap rate 9.5% vs local median 5.0% in Grandview — top-decile yield for the area; either an underpriced asset or a hidden risk that comps aren't pricing in. Stress-test before assuming the spread holds.
Location & tenants
- Location reads 61/100 on livability (#454 in MO) — a middle-class / working-renter tenant base. Strengths: cost of living A+, housing A+; Watch: employment D, crime F, amenities F.
- Grandview C-4 (suburban): math 17% / reading 32% proficiency, ranked #284 of 324 in MO (top 88%) — low school quality limits family demand, transient renter base, plan for 1-2y turnover; 65% free/reduced lunch — lower-income household profile, screen leases tightly.
- Zoned schools: Belvidere Elem. (math 17% / reading 27%, grade F, #910 of 1,115 statewide, top 83%, 294 students, 65% FRL); Grandview Middle (math 18% / reading 39%, grade F, #303 of 391 statewide, top 78%, 517 students, 68% FRL); Grandview Sr. High (math 15% / reading 41%, grade F, #414 of 521 statewide, top 80%, 1,122 students, 62% FRL) — zoned schools at 65% FRL track the district average.
- Market conditions: Rents rising fast (+6.1%/yr); 120 active listings in the ZIP; 7 comparable units currently listed for rent nearby; rentals at typical pace (median 26d on market — plan ~3-4 weeks tenant-placement turnaround); 43% of comp listings sitting > 30 days — soft ceiling on asking rent; 4,002 units permitted in Jackson County in 2024 (2,271 in 5+ unit buildings).
- This rent runs 30% of the median local income ($53k/yr) — at the standard rent-burdened threshold; future hikes will face affordability resistance.
Forward outlook
- Local home prices are declining (-3.0%/yr); year-one equity from $788 of loan paydown is wiped out by about $3k of value loss. Plan a longer hold.
- Jackson County population projected at +4% by 2050 — modest demand growth; plan on rents tracking national, not racing it.
- At projected returns (-3.0% appreciation + 6.1% rent growth), your $32k cash investment doubles in ~8 years — after that, you're playing with house money.
Negotiation context
- It's been on market 328 days — a 12% lower offer ($100k) is reasonable based on typical stale-listing flexibility.
- 8 sale attempts since 29y ago; this cycle's ask has dropped $47k (29%) from the opening price — seller is motivated, your offer sets the floor, not the list.
Questions for the listing agent
- It's been on market 328 days. Have you received any prior offers? Is the seller open to a 12% concession, seller financing, or rate buy-down credit?
- Built in 1960 — when were the roof, HVAC, electrical panel, plumbing, and water heater last replaced?
- Why hasn't it sold? Are there any deal-killer items the seller is aware of (foundation, flood, title, zoning, code violations)?
- Is there a deadline driving the sale (1031 exchange, divorce, estate, relocation)? That informs how much negotiation room exists.
- Schools are D-rated, which usually means shorter tenancies and higher turnover. Who's the typical renter profile here, and what's been the actual vacancy rate?
- Crime grade is F in this area — have there been break-ins, vandalism, or insurance claims at this property in the last 3 years? What carrier currently insures it and at what premium?
- What's the average days-on-market for RENTAL listings here right now (not sales)? A rising rental-DOM trend means longer vacancies and softer asking-rent achievability than the comps imply.
- What's the recent tenant-quality profile in this submarket — average credit score on applications, eviction rate, late-payment / NSF rate, and stable-employment percentage? A property-management company in the area should have these aggregated.
- How much new for-sale + rental construction is in the pipeline within 1–3 miles? Heavy new supply typically softens prices + rents 12–24 months out; constrained supply supports both.
Investment metrics
- 1% rule
- 1.18% ✓
- Cap rate
- 9.46%
- Cash-on-cash
- 11.33%
- DSCR
- 1.50
- GRM
- 7.0
CMA / ARV
- ARV (on-the-fly)
- $170,200
- Comps found
- 12
Show comp detail 12 sales within ~0.75 mi
| Address | Dist | Beds/Ba | Sqft | Sold | Price | $/sf | Match |
|---|---|---|---|---|---|---|---|
| 6307 E 153rd St | 0.03mi | 3/1.0 | 925 (0%) | 2mo | $169,900 | $184 | 95 |
| 6105 E 152nd St | 0.16mi | 3/1.0 | 962 (+4%) | 2mo | $175,000 | $182 | 82 |
| 6207 E 150th Ter | 0.25mi | 2/1.0 (-1) | 925 (0%) | 2mo | $152,000 | $164 | 79 |
| 6107 E 149th Ter | 0.36mi | 3/1.5 | 925 (0%) | 8mo | $174,900 | $189 | 76 |
| 6205 E 150th Ter | 0.25mi | 3/2.0 | 925 (0%) | 12mo | $184,900 | $200 | 76 |
| 14920 Fuller Ave | 0.51mi | 3/1.5 | 925 (0%) | 6mo | $130,000 | $141 | 71 |
| 6202 E 150th Ter | 0.33mi | 3/1.0 | 962 (+4%) | 8mo | $169,900 | $177 | 69 |
| 15215 White Ave | 0.09mi | 3/1.0 | 1,034 (+12%) | 10mo | $214,900 | $208 | 66 |
| 6017 E 149th St | 0.42mi | 3/1.0 | 876 (-5%) | 12mo | $188,000 | $215 | 60 |
| 15513 Allen Ave | 0.48mi | 3/1.0 | 960 (+4%) | 12mo | $195,000 | $203 | 59 |
| 6310 E 149th Ter | 0.47mi | 3/1.0 | 1,032 (+12%) | 1mo | $155,000 | $150 | 56 |
| 14808 Bellaire Ave | 0.55mi | 4/2.0 (+1) | 976 (+6%) | 8mo | $180,000 | $184 | 51 |
Match score weights: distance 35% · size 25% · config 20% · recency 20%. Top-matched comps best support the ARV.
Projected returns pro-forma
-3.0% appreciation · 6.1% rent growth · sell at horizon
- IRR
- 4.0%
- Equity multiple
- 1.16×
- Total profit
- $5,059
- Equity at exit
- $16,998
- IRR
- 16.1%
- Equity multiple
- 2.51×
- Total profit
- $48,098
- Equity at exit
- $9,857
Cash invested: $31,920 (down + closing). Projections, not guarantees.
Landlord ↔ Tenant lean methodology
- Overall (STATE)
- 81 Strongly Landlord-Friendly
- State Missouri
- 81 Strongly Landlord-Friendly · R+10
- County
- — inherits STATE
- City
- — inherits STATE
ZIP-level market 64030
- Home prices YoY
- -30.7%
- Rents YoY
- 6.1%
- Active inventory
- 120
- Price-to-rent
- 7.0×
Monthly cashflow live
- Estimated rent
- $1,348 high interval (Pro) →
- Mortgage (P&I)
- −$598
- Tax from tax record
- −$118 /mo · $1,419/yr
- Insurance
- −$48
- HOA
- −$0
- Vacancy / Maint / Mgmt
- −$283
- Net cashflow
- $301
Break-even live
Sensitivity live
| Price | -10% $366 | -5% $334 | +0% $301 | +5% $269 | +10% $237 |
|---|---|---|---|---|---|
| Rent | -10% $195 | -5% $248 | +0% $301 | +5% $355 | +10% $408 |
| Rate | -1.0pp $359 | -0.5pp $330 | base $301 | +0.5pp $272 | +1.0pp $242 |
UW: 25.0% down · 7.5% · 30yr · 1.5% tax · 5.0% vac · 8.0% maint · 8.0% mgmt
Financing live
Cash to close
- Down payment
- $28,500
- Closing costs
- $3,420
- Reserves months
- —
- Total cash needed
- —
Loan-product check · same deal, 3 products live
Conventional
25% down · 7.5% · 30yr
- Down + closing
- —
- Monthly P&I
- —
- Monthly cashflow
- —
- DSCR
- —
- Eligible?
- —
Personal DTI + credit; lowest rate.
DSCR
20% down · 8.5% · 30yr
- Down + closing
- —
- Monthly P&I
- —
- Monthly cashflow
- —
- DSCR
- —
- Eligible?
- —
No personal income docs; deal must DSCR.
Hard money
10% down · 12.0% · 12mo
- Down + closing
- —
- Monthly P&I
- —
- Monthly cashflow
- —
- DSCR
- —
- Eligible?
- —
Short-term bridge; refi at stabilization.
Rent comps 7 comps
| Address | Beds | Baths | Sqft | Rent | $/sqft | DOM | Units | Dist |
|---|---|---|---|---|---|---|---|---|
| 6205 E 152 Ter Unit B Grandview, MO | 2.0 | 1.0 | 550 | $850 | $1.55 | 9d | 1 | 0.13mi |
| 6003 E 151st Ter Unit A Grandview, MO | 2.0 | 1.0 | 650 | $975 | $1.50 | 46d | 1 | 0.26mi |
| 15319 Grand Summit Ext Grandview, MO | 1.0–2.0 | 1.0–2.0 | 818 | $1,150 | $1.41 | 46d | 1 | 0.34mi |
| 6302 E 149th Ter Grandview, MO | 3.0 | 1.0 | 1032 | $1,445 | $1.40 | 26d | 1 | 0.41mi |
| 6410 E 149th Ter Grandview, MO | 3.0 | 1.0 | 960 | $1,395 | $1.45 | 46d | 1 | 0.50mi |
| 6311 E 148th Ter Grandview, MO | 3.0 | 1.0 | 924 | $1,400 | $1.52 | 26d | 1 | 0.58mi |
| 6820 Chapel Dr Belton, MO | 4.0 | 1.0–2.5 | 1081 | $1,561 | $1.44 | 0d | 6 | 1.32mi |
Listing history 48 events
-
2026-06-21days on market $114,000 Active 328 DOM
-
2026-06-19price $114,000 Active 325 DOM
-
2026-06-18days on market $115,000 Active 325 DOM
-
2026-06-17days on market $115,000 Active 324 DOM
-
2026-06-16days on market $115,000 Active 323 DOM
-
2026-06-15days on market $115,000 Active 322 DOM
-
2026-06-13days on market $115,000 Active 320 DOM
-
2026-06-13days on market $115,000 Active 319 DOM
-
2026-06-09days on market $115,000 Active 316 DOM
-
2026-06-08days on market $115,000 Active 315 DOM
-
2026-06-07days on market $115,000 Active 314 DOM
-
2026-06-03days on market $115,000 Active 310 DOM
-
2026-06-02days on market $115,000 Active 309 DOM
-
2026-06-01days on market $115,000 Active 308 DOM
-
2026-05-31days on market $115,000 Active 307 DOM
-
2026-05-21status Active
-
2026-05-01status Pending
-
2026-04-24price $115,000
-
2026-03-20price $117,000
-
2026-02-27price $118,000
-
2026-01-30price $122,000
-
2026-01-09price $124,000
-
2025-12-05price $128,000
-
2025-11-07price $132,000
-
2025-10-03price $135,000
-
2025-09-19price $138,000
-
2025-09-05price $142,000
-
2025-08-21price $146,000
-
2025-08-07price $151,000
-
2025-07-25price $156,000
-
2025-07-08$161,000 Active
-
2025-06-25historical $1,415
-
2025-06-23$1,415
-
2025-06-15historical $1,415
-
2025-05-30price $1,415
-
2025-05-01historical $1,440
-
2025-04-01$1,440
-
2025-03-30price $1,440
-
2025-03-28$1,505
-
2022-09-01price $1,185
-
2017-02-10historical 282-char remark
Show marketing remark (282 chars)
Wonderful Investment Opportunity! Already rented out and cash flowing! Nothing left to do but start collecting rents. Seller is willing to sell 19 similar homes individually or as a package. Please do not approach tenants. No sign in yard. Rents for $719 Buyer to verify information
-
2016-10-21$69,900 Active 282-char remark
Show marketing remark (282 chars)
Wonderful Investment Opportunity! Already rented out and cash flowing! Nothing left to do but start collecting rents. Seller is willing to sell 19 similar homes individually or as a package. Please do not approach tenants. No sign in yard. Rents for $719 Buyer to verify information
-
2007-11-02soldstatus 540-char remark
Show marketing remark (540 chars)
This home is owned by the U. S. Department of Housing and Urban Development (HUD). This home is sold "as is with all faults" & “where is”. Agents must be registered with HUD for the bidding process. This home is case number: 291-314880. Call listing office for help bidding any price you want to offer. AGENTS: Bids can get cancelled or contracts rejected, check bidselect.com daily for status. When showing this house HUD needs you to sign the log in sheet at the house. Please lock the doors when done showing.
-
2007-08-03$40,000 540-char remark
Show marketing remark (540 chars)
This home is owned by the U. S. Department of Housing and Urban Development (HUD). This home is sold "as is with all faults" & “where is”. Agents must be registered with HUD for the bidding process. This home is case number: 291-314880. Call listing office for help bidding any price you want to offer. AGENTS: Bids can get cancelled or contracts rejected, check bidselect.com daily for status. When showing this house HUD needs you to sign the log in sheet at the house. Please lock the doors when done showing.
-
1998-02-20soldstatus
-
1998-02-20soldstatus
-
1997-11-10$51,475
-
1995-01-26soldstatus
ⓘ Source: listings_history table (triggers on properties + properties_extension) + one-shot
backfill from property_details.listing_events for pre-trigger history.
Tax reassessment forecast MO · Resets to sale price
- Current annual tax
- $1,419 · $118/mo
- Projected year-2 tax
- $1,419 · $118/mo
- Expected delta
- $0/yr ($0/mo · 0.0%)
ⓘ Screening estimate from a state-policy table — verify with the county assessor before closing.
Climate risk First Street
- Flood 1/10 Low FEMA zone X (unshaded) · 0% chance over 30 yrs
- Wildfire 3/10 Moderate
- Heat 4/10 Moderate 7 d/yr ≥106°F today · 17 d/yr by 30 yrs out
- Wind 2/10 Low
- Air quality 2/10 Low 2 unhealthy d/yr today · 2 by 30 yrs out
Nearby sold comps map
Loading sold comps map…
Walkable amenities ~0.75 mi
Loading nearby amenities…
Taxation est. · year 1
- Rental income
- $16,176
- − Mortgage interest
- −$6,386
- − Property taxes
- −$1,419
- − Insurance
- −$570
- − Repairs & maintenance
- −$1,294
- − Management
- −$1,294
- − Depreciation
- −$3,316
- Taxable income
- $1,897
- Est. tax owed @ 24.0%
- −$455
- After-tax cash flow
- $3,161/yr
For passive investors: Depreciation is non-cash, so a rental often shows a tax loss while cash-flowing — sheltering income. Rental losses are passive: they offset passive income freely, and up to $25,000/yr can offset ordinary (W-2) income if you actively participate and your MAGI is under $100k (phasing out to $0 by $150k); unused losses carry forward. On sale, claimed depreciation is recaptured at up to 25%, and gains may owe capital-gains tax (a 1031 exchange can defer both). Figures are a year-1 estimate at your 24.0% rate — not tax advice; consult a CPA.
Schools (NCES district)
- District
- Grandview C-4
- NCES district ID
- 2913140
- Math proficiency
- 17% ▼ -12.00%
- Reading proficiency
- 32% ▼ -3.00%
- Median HH income
- $48,934
- Composite
- 21.49/100
- National rank
- #8326
- State rank
- #284 of 324 in MO
Livability — Grandview
- Score
- 61/100
- State rank
- #454
- US rank
- #18350
Category grades
Schools grade is shown separately in the Schools card above.
Census & demographics
- Census place
- Grandview, MO
- County
- Jackson County · 687,798 people
- City population
- 26,422
- Metro
- Kansas City, MO-KS
- Population (ZIP)
- 26,422
- Household income
- $53,216
- Rent vs Own
- Severe rent burden
- 1449.0
Population outlook (Jackson County) Hauer SSP2
- Today (2025)
- 719,589 people
- By 2030
- 731,456 · +1.6%
- By 2040
- 746,689 · +3.8%
- By 2050
- 749,289 · +4.1%
- By 2075
- 736,227 · +2.3%
- By 2100
- 668,210 · -7.1%
Race, ethnicity, and origin ACS 2023
- Neighborhood character
- Diverse neighborhood (Simpson 0.68)
- Race & ethnicity
- White 44% Black 33% Hispanic / Latino 14% Two or more races 7% Asian 3%
- Hispanic origin (detail)
- Mexican 8%
- Common ancestry
- Lithuanian 1% Romanian 1% Slovak 1%
- Foreign-born
- 9% · Canada, South Korea
- Languages at home
- 86% English-only · Spanish 11% Korean 1% Arabic 1%
Political lean MEDSL · Jackson
- 2024 margin
- D (+19.3) · D 58.9% · R 39.5% · Other 1.6%
- 2008→2024 swing
- -6.1pp toward R · 2008: 25.4pp · 2024: 19.3pp
- All cycles
- 2024: D+19.3 2020: D+22.0 2016: D+16.6 2012: D+19.0 2008: D+25.4
Not yet ingested
- Civics
- —
Market trends
- HPI YoY
- ▼ -142.24%
- Current HPI
- 321.6905
- Rent YoY
- ▲ 6.10%
- Metro
- Kansas City, MO-KS
- State GDP YoY
- ▲ 1.84%
- F500 in state
- 20
Industry mix (Fortune 500 HQ in MO)
| Industry | F500 HQs | Revenue |
|---|---|---|
| Healthcare | 1 | $163B |
|
||
| Insurance | 1 | $21B |
|
||
| Industrial Technology | 1 | $17B |
|
||
| Retail | 1 | $16B |
|
||
| Industrial Distribution | 1 | $10B |
|
||
| Utilities | 1 | $9B |
|
||
Price history
+123.4% since first listed33 events — show timeline
- 2026-05-21 Relisted — Heartland MLS as Distributed by MLS Grid
- 2026-05-01 Pending — Heartland MLS as Distributed by MLS Grid
- 2026-04-24 Price Changed $115,000 Heartland MLS as Distributed by MLS Grid
- 2026-03-20 Price Changed $117,000 Heartland MLS as Distributed by MLS Grid
- 2026-02-27 Price Changed $118,000 Heartland MLS as Distributed by MLS Grid
- 2026-01-30 Price Changed $122,000 Heartland MLS as Distributed by MLS Grid
- 2026-01-09 Price Changed $124,000 Heartland MLS as Distributed by MLS Grid
- 2025-12-05 Price Changed $128,000 Heartland MLS as Distributed by MLS Grid
- 2025-11-07 Price Changed $132,000 Heartland MLS as Distributed by MLS Grid
- 2025-10-03 Price Changed $135,000 Heartland MLS as Distributed by MLS Grid
- 2025-09-19 Price Changed $138,000 Heartland MLS as Distributed by MLS Grid
- 2025-09-05 Price Changed $142,000 Heartland MLS as Distributed by MLS Grid
- 2025-08-21 Price Changed $146,000 Heartland MLS as Distributed by MLS Grid
- 2025-08-07 Price Changed $151,000 Heartland MLS as Distributed by MLS Grid
- 2025-07-25 Price Changed $156,000 Heartland MLS as Distributed by MLS Grid
- 2025-07-08 Listed $161,000 Heartland MLS as Distributed by MLS Grid
- 2025-06-25 Rental Removed $1,415 RENTLY
- 2025-06-23 Listed for Rent $1,415 RENTLY
- 2025-06-15 Rental Removed $1,415 RENTLY
- 2025-05-30 Price Changed $1,415 RENTLY
- 2025-05-01 Rental Removed $1,440 RENT.
- 2025-04-01 Listed for Rent $1,440 RENT.
- 2025-03-30 Price Changed $1,440 RENTLY
- 2025-03-28 Listed for Rent $1,505 RENTLY
- 2022-09-01 Price Changed $1,185 RENT.
- 2017-02-10 Listing Removed — Heartland MLS as Distributed by MLS Grid
- 2016-10-21 Listed $69,900 Heartland MLS as Distributed by MLS Grid
- 2007-11-02 Sold (MLS) — Heartland MLS as Distributed by MLS Grid
- 2007-08-03 Listed $40,000 Heartland MLS as Distributed by MLS Grid
- 1998-02-20 Sold (Public Records) — Public Records
- 1998-02-20 Sold (MLS) — Heartland MLS as Distributed by MLS Grid
- 1997-11-10 Listed $51,475 Heartland MLS as Distributed by MLS Grid
- 1995-01-26 Sold (Public Records) — Public Records
Property tax history
+8.1%/yrLatest (2025): $1,419 · -0.1% YoY. Source: county tax records.
Cash-flow waterfall
monthlySold comps — $/sqft
last 12 mo · ≤1 miLoading sold comps…