 Duplex
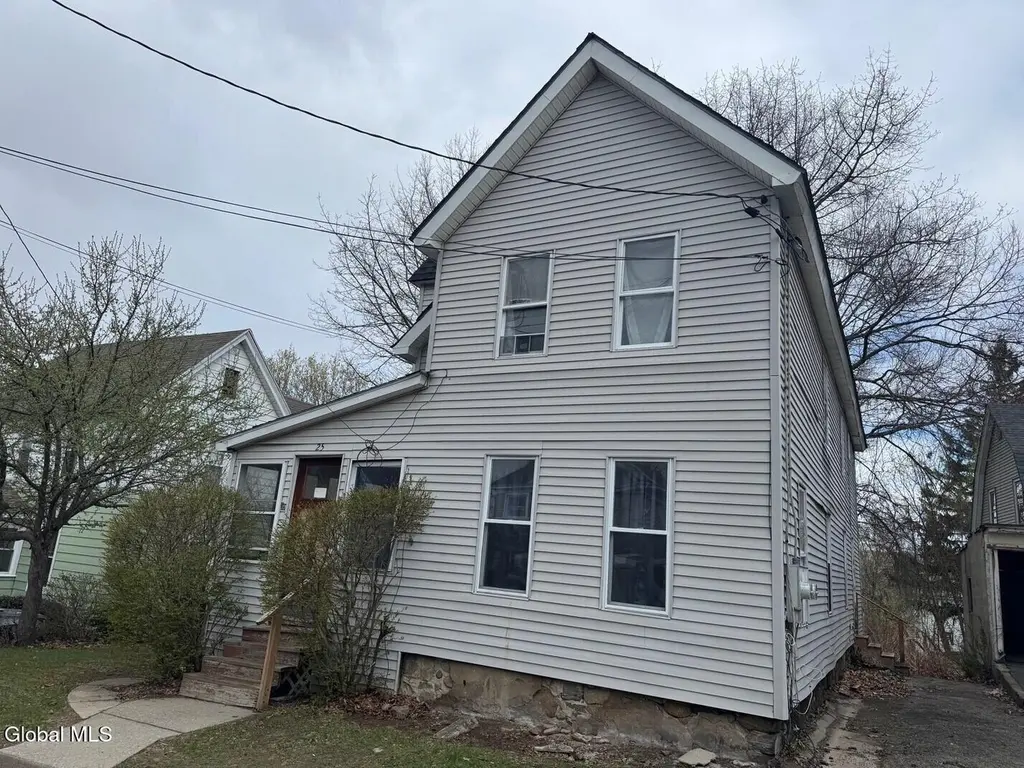
25 Steele Ave · Gloversville, NY
Flood risk 1/10 · Minimal
- FEMA flood zone
- X
- Chance of flooding over 30 yrs
- 0.0%
- Est. flood insurance / yr
- $473 – $860
Fire risk 1/10 · Minimal
- Est. fire insurance / yr
- $691 – $1,283
Heat risk 3/10 · Minor
- Hot days now (above 93°F)
- 7 days/yr
- Hot days in 30 yrs
- 17 days/yr
Wind risk 2/10 · Minimal
- Chance of severe wind over 30 yrs
- 3.0%
Air-quality risk 1/10 · Minimal
- Unhealthy air days now
- 0 days/yr
- Unhealthy air days in 30 yrs
- 0 days/yr
Risk factors via First Street. Map © Google.
Why this score? — see what drove the A grade
The composite is a weighted blend of 9 inputs, each scored 0–100. Each bar is that input's sub-score; the figure is the points it added to the 100-point composite (weight × sub-score).
- Cash flow +30.0/30.0
- ARV discount +13.8/15.0
- 1% rule +10.0/10.0
- DSCR +10.0/10.0
- Appreciation +10.0/10.0
- Livability +4.1/5.0
- Schools +2.8/10.0
- Rent growth +2.5/5.0
- Condition / age +2.5/5.0
$114,900
🖨 Deal sheet (PDF) 📄 Offer letter ✓ Due diligence
Multi-family units
County records classify this as Multi-Family (2-4 Unit). Listing-text estimate: 2 units. confirmed
Listing remarks MLS
This 2 unit Gloversville home is priced to sell. Up and down unit, separate utilities. Top unit is currently rented bottom unit is vacant. Owner is motivated and willing to help with closing costs.
Key facts
- 8,712 sq ft lot
- 2 parking spots
- Built 1915
Neighborhood map
What this means for you Summary
Snapshot
- This is a 2 × 2-bed/1.0-bath units multifamily listed at $115k.
Deal economics
- At list price, monthly cash flow is $771 ($9k/yr) — positive. Per door: $386/mo.
- The deal already cash-flows at list — no discount required.
- Meets the 1% rule at list price ($2k rent vs $115k).
- Recommended offer: $111k (3.0% below list) — sets the bar for market timing.
- Cap rate 14.3% vs local median 8.6% in Gloversville — top-decile yield for the area; either an underpriced asset or a hidden risk that comps aren't pricing in. Stress-test before assuming the spread holds.
Location & tenants
- Location reads 82/100 on livability (#70 in NY, #1,048 nationally) — a professional / high-income tenant draw. Strengths: amenities A+, commute A+, cost of living A+; Watch: schools D, employment F.
- Gloversville City School District (town): math 26% / reading 42% proficiency, ranked #565 of 590 in NY (top 96%) — families likely to look elsewhere, expect single-tenant / working-renter base with shorter leases.
- Market conditions: 173 active listings in the ZIP; 112 units permitted in Fulton County in 2024 (50 in 5+ unit buildings).
Forward outlook
- In year one you build about $12k of equity ($794 loan paydown + $11k appreciation (10.0% local appreciation)).
- Fulton County population projected at -23% by 2050 — secular population decline; favor cash flow + early exit over multi-decade hold.
- At projected returns (10.0% appreciation + 3.0% rent growth), your $32k cash investment doubles in ~2 years — after that, you're playing with house money.
- By year 3, paydown + projected appreciation supports a ~$31k cash-out refi (75% LTV) — recoverable capital for the next deal without selling this one.
Negotiation context
- It's been on market 55 days — a 3% lower offer ($111k) is reasonable based on typical stale-listing flexibility.
- 3 sale attempts since 24y ago with the ask held roughly flat each time — persistent listings suggest the price (not the market) is what's stuck; bring a comps-based counter.
- Current owner paid $38k; list at $115k implies a 202% gain — meaningful room to come down on a strong offer.
Risks & watch-outs
- Watch-outs: built in 1915 — expect roof / HVAC / electrical / plumbing capex.
Questions for the listing agent
- It's been on market 55 days. Have you received any prior offers? Is the seller open to a 3% concession, seller financing, or rate buy-down credit?
- Can we see the unit-by-unit rent roll, current vacancy, and any below-market leases? What's the average tenancy length?
- What capital expenditures (roof, boiler, parking lot, exteriors) have been made in the last 5 years, and what's planned in the next 2?
- Built in 1915 — when were the roof, HVAC, electrical panel, plumbing, and water heater last replaced?
- Is there a deadline driving the sale (1031 exchange, divorce, estate, relocation)? That informs how much negotiation room exists.
- Schools are D-rated, which usually means shorter tenancies and higher turnover. Who's the typical renter profile here, and what's been the actual vacancy rate?
- What's the average days-on-market for RENTAL listings here right now (not sales)? A rising rental-DOM trend means longer vacancies and softer asking-rent achievability than the comps imply.
- What's the recent tenant-quality profile in this submarket — average credit score on applications, eviction rate, late-payment / NSF rate, and stable-employment percentage? A property-management company in the area should have these aggregated.
- How much new apartment / multifamily construction is in the pipeline within 1–3 miles? Heavy new supply (>2% of stock underway) typically softens rents 12–24 months out; light construction supports rent growth.
Investment metrics
- 1% rule
- 1.73% ✓
- Cap rate
- 14.35%
- Cash-on-cash
- 28.76%
- DSCR
- 2.28
- GRM
- 4.8
CMA / ARV
- ARV (median comp)
- $133,621
- List price
- $114,900
- Delta
- -14.01%
- Verdict
- UNDERPRICED
- Comps
- 20 within 1.0 mi
Show comp detail 12 sales within ~0.75 mi
| Address | Dist | Beds/Ba | Sqft | Sold | Price | $/sf | Match |
|---|---|---|---|---|---|---|---|
| 73 Fremont St | 0.26mi | 5/2.0 | 1,914 (-0%) | 8mo | $75,000 | $39 | 81 |
| 82 E Pine St | 0.16mi | 4/2.0 (-1) | 1,939 (+1%) | 12mo | $105,000 | $54 | 76 |
| 55 Montgomery St | 0.08mi | 6/2.0 (+1) | 2,044 (+7%) | 10mo | $147,000 | $72 | 72 |
| 73 Park St | 0.22mi | 4/2.0 (-1) | 1,848 (-4%) | 18mo | $59,500 | $32 | 64 |
| 26 E Pine St | 0.31mi | 4/2.0 (-1) | 1,856 (-3%) | 18mo | $65,000 | $35 | 60 |
| 75 Park St | 0.23mi | 6/2.0 (+1) | 2,080 (+9%) | 20mo | $80,000 | $38 | 53 |
| 96 Woodside Ave | 0.65mi | 4/2.0 (-1) | 2,020 (+6%) | 8mo | $70,000 | $35 | 48 |
| 73 Grand St | 0.72mi | 4/2.0 (-1) | 1,920 (+0%) | 18mo | $95,000 | $49 | 46 |
| 260 S Main St | 0.64mi | 4/2.0 (-1) | 2,130 (+11%) | 13mo | $142,000 | $67 | 36 |
| 35 Pearl St | 0.69mi | 4/2.0 (-1) | 2,080 (+9%) | 17mo | $135,000 | $65 | 34 |
| 69 Yale St | 0.75mi | 4/2.0 (-1) | 2,016 (+5%) | 21mo | $70,000 | $35 | 34 |
| 78 Third Ave | 0.74mi | 4/2.0 (-1) | 2,084 (+9%) | 18mo | $85,000 | $41 | 31 |
Match score weights: distance 35% · size 25% · config 20% · recency 20%. Top-matched comps best support the ARV.
Projected returns pro-forma
10.0% appreciation · 3.0% rent growth · sell at horizon
- IRR
- 46.1%
- Equity multiple
- 4.47×
- Total profit
- $111,726
- Equity at exit
- $103,511
- IRR
- 40.0%
- Equity multiple
- 10.03×
- Total profit
- $290,459
- Equity at exit
- $223,225
Cash invested: $32,172 (down + closing). Projections, not guarantees.
Landlord ↔ Tenant lean methodology
- Overall (STATE)
- 15 Strongly Tenant-Friendly
- State New York
- 15 Strongly Tenant-Friendly · D+10
- County
- — inherits STATE
- City
- — inherits STATE
ZIP-level market 12078
- Home prices YoY
- 12.2%
- Active inventory
- 173
- Price-to-rent
- 9.6×
Monthly cashflow live
- Estimated rent
- $1,990 medium interval (Pro) →
- Mortgage (P&I)
- −$603
- Tax from tax record
- −$151 /mo · $1,807/yr
- Insurance
- −$48
- HOA
- −$0
- Vacancy / Maint / Mgmt
- −$418
- Net cashflow
- $771
Break-even live
Sensitivity live
| Price | -10% $836 | -5% $804 | +0% $771 | +5% $739 | +10% $706 |
|---|---|---|---|---|---|
| Rent | -10% $614 | -5% $693 | +0% $771 | +5% $850 | +10% $928 |
| Rate | -1.0pp $829 | -0.5pp $800 | base $771 | +0.5pp $741 | +1.0pp $711 |
2-unit breakdown (identical units grouped — click to expand)
| Units | Beds | Baths | Est. rent |
|---|---|---|---|
| 2× units | 2 | 1 | $1,990 |
| #1 | 2 | 1 | $995 |
| #2 | 2 | 1 | $995 |
| Total (2 units) | $1,990 | ||
UW: 25.0% down · 7.5% · 30yr · 1.5% tax · 5.0% vac · 8.0% maint · 8.0% mgmt
Financing live
Cash to close
- Down payment
- $28,725
- Closing costs
- $3,447
- Reserves months
- —
- Total cash needed
- —
Loan-product check · same deal, 3 products live
Conventional
25% down · 7.5% · 30yr
- Down + closing
- —
- Monthly P&I
- —
- Monthly cashflow
- —
- DSCR
- —
- Eligible?
- —
Personal DTI + credit; lowest rate.
DSCR
20% down · 8.5% · 30yr
- Down + closing
- —
- Monthly P&I
- —
- Monthly cashflow
- —
- DSCR
- —
- Eligible?
- —
No personal income docs; deal must DSCR.
Hard money
10% down · 12.0% · 12mo
- Down + closing
- —
- Monthly P&I
- —
- Monthly cashflow
- —
- DSCR
- —
- Eligible?
- —
Short-term bridge; refi at stabilization.
Listing history 22 events
-
2026-06-21days on market $114,900 Active 55 DOM
-
2026-06-21days on market $114,900 Active 54 DOM
-
2026-06-18days on market $114,900 Active 52 DOM
-
2026-06-17days on market $114,900 Active 51 DOM
-
2026-06-16days on market $114,900 Active 50 DOM
-
2026-06-15days on market $114,900 Active 49 DOM
-
2026-06-13days on market $114,900 Active 47 DOM
-
2026-06-12pricestatusdays on market $114,900 Active 46 DOM
-
2026-06-07statusdays on market $119,900 Pending 44 DOM
-
2026-06-04days on market $119,900 Active 43 DOM
-
2026-06-02days on market $119,900 Active 42 DOM
-
2026-06-01days on market $119,900 Active 41 DOM
-
2026-05-31days on market $119,900 Active 40 DOM
-
2026-04-21$119,900 Active 199-char remark
Show marketing remark (199 chars)
This 2 unit Gloversville home is priced to sell. Up and down unit, separate utilities. Top unit is currently rented bottom unit is vacant. Owner is motivated and willing to help with closing costs.
-
2025-07-14$899,000 Active 412-char remark
Show marketing remark (412 chars)
Property consists of 3 parcels totaling 29.9 acres on busy Route 30A in Gloversville, just minutes from Walmart Plaza. Great development opportunity with frontage on both 30A (1,500+ feet) and Steele Avenue. NYS approved break in access from Route 30A. See documents for more information from the local municipality. * Property is in OPPORTUNITY ZONE where new investments may be eligible for tax incentives. *
-
2017-02-23soldstatus $38,000
-
2002-10-16soldstatus $55,000
-
2002-10-02soldstatus $18,250
-
2002-04-03historical
-
2002-03-07$19,000
-
1999-05-18soldstatus $28,600
-
1997-04-07soldstatus $12,500
ⓘ Source: listings_history table (triggers on properties + properties_extension) + one-shot
backfill from property_details.listing_events for pre-trigger history.
Tax reassessment forecast NY · Partial reset (capped growth)
- Current annual tax
- $1,807 · $151/mo
- Projected year-2 tax
- $1,874 · $156/mo
- Expected delta
- +$68/yr (+$6/mo · 3.7%)
ⓘ Screening estimate from a state-policy table — verify with the county assessor before closing.
Climate risk First Street
- Flood 1/10 Low FEMA zone X · 0% chance over 30 yrs
- Wildfire 1/10 Low
- Heat 3/10 Moderate 7 d/yr ≥93°F today · 17 d/yr by 30 yrs out
- Wind 2/10 Low 3% chance of damaging wind over 30 yrs
- Air quality 1/10 Low 0 unhealthy d/yr today · 0 by 30 yrs out
Nearby sold comps map
Loading sold comps map…
Walkable amenities ~0.75 mi
Loading nearby amenities…
Taxation est. · year 1
- Rental income
- $23,880
- − Mortgage interest
- −$6,436
- − Property taxes
- −$1,807
- − Insurance
- −$574
- − Repairs & maintenance
- −$1,910
- − Management
- −$1,910
- − Depreciation
- −$3,343
- Taxable income
- $7,899
- Est. tax owed @ 24.0%
- −$1,896
- After-tax cash flow
- $7,358/yr
For passive investors: Depreciation is non-cash, so a rental often shows a tax loss while cash-flowing — sheltering income. Rental losses are passive: they offset passive income freely, and up to $25,000/yr can offset ordinary (W-2) income if you actively participate and your MAGI is under $100k (phasing out to $0 by $150k); unused losses carry forward. On sale, claimed depreciation is recaptured at up to 25%, and gains may owe capital-gains tax (a 1031 exchange can defer both). Figures are a year-1 estimate at your 24.0% rate — not tax advice; consult a CPA.
Schools (NCES district)
- District
- Gloversville City School District
- NCES district ID
- 3612270
- Math proficiency
- 26% ▼ -6.00%
- Reading proficiency
- 42% ▲ 7.00%
- Median HH income
- $36,775
- Composite
- 28.2/100
- National rank
- #6806
- State rank
- #565 of 590 in NY
Livability — Gloversville
- Score
- 82/100
- State rank
- #70
- US rank
- #1048
Category grades
Schools grade is shown separately in the Schools card above.
Census & demographics
- Census place
- Gloversville, NY
- Population (ZIP)
- 23,087
Population outlook (Fulton County) Hauer SSP2
- Today (2025)
- 51,132 people
- By 2030
- 49,114 · -3.9%
- By 2040
- 44,373 · -13.2%
- By 2050
- 39,321 · -23.1%
- By 2075
- 28,503 · -44.3%
- By 2100
- 19,268 · -62.3%
Race, ethnicity, and origin ACS 2023
- Neighborhood character
- Predominantly White (86%)
- Race & ethnicity
- White 86% Two or more races 8% Hispanic / Latino 5% Black 2% Asian 1%
- Hispanic origin (detail)
- Puerto Rican 3%
- Common ancestry
- Lithuanian 5% Romanian 4% Iranian 4%
- Foreign-born
- 2% · Canada, China
- Languages at home
- 97% English-only · Spanish 2%
Political lean MEDSL · Fulton
- 2024 margin
- Solid R (+35.9) · D 32.1% · R 67.9%
- 2008→2024 swing
- -26.6pp toward R · 2008: -9.2pp · 2024: -35.9pp
- All cycles
- 2024: R+35.9 2020: R+31.4 2016: R+35.5 2012: R+10.5 2008: R+9.2
Not yet ingested
- Civics
- —
Market trends
- HPI YoY
- ▲ 34.22%
- Current HPI
- 315.1368
- Rent YoY
- —
- Metro
- —
- State GDP YoY
- ▲ 2.60%
- F500 in state
- 92
Industry mix (Fortune 500 HQ in NY)
| Industry | F500 HQs | Revenue |
|---|---|---|
| Financial Services | 10 | $950B |
|
||
| Consumer Goods | 9 | $162B |
|
||
| Insurance | 4 | $225B |
|
||
| Telecommunications | 2 | $144B |
|
||
| Pharmaceuticals | 2 | $112B |
|
||
| Media / Entertainment | 2 | $69B |
|
||
Price history
+859.2% since first listed9 events — show timeline
- 2026-04-21 Listed $119,900 Global MLS
- 2025-07-14 Listed $899,000 Global MLS
- 2017-02-23 Sold (Public Records) $38,000 Public Records
- 2002-10-16 Sold (Public Records) $55,000 Public Records
- 2002-10-02 Sold (MLS) $18,250 Global MLS
- 2002-04-03 Listing Removed — Global MLS
- 2002-03-07 Listed $19,000 Global MLS
- 1999-05-18 Sold (Public Records) $28,600 Public Records
- 1997-04-07 Sold (Public Records) $12,500 Public Records
Property tax history
+0.9%/yrLatest (2025): $1,807 · +3.4% YoY. Source: county tax records.
Cash-flow waterfall
monthlySold comps — $/sqft
last 12 mo · ≤1 miLoading sold comps…