41854 Silver Vly · Yermo, CA
Flood risk 1/10 · Minimal
- FEMA flood zone
- D
- Chance of flooding over 30 yrs
- 0.0%
- Est. flood insurance / yr
- $544 – $1,084
Fire risk 4/10 · Minor
- Est. fire insurance / yr
- $659 – $1,223
Heat risk 8/10 · Major
- Hot days now (above 106°F)
- 7 days/yr
- Hot days in 30 yrs
- 20 days/yr
Wind risk 1/10 · Minimal
- Chance of severe wind over 30 yrs
- —
Air-quality risk 7/10 · Major
- Unhealthy air days now
- 12 days/yr
- Unhealthy air days in 30 yrs
- 17 days/yr
Risk factors via First Street. Map © Google.
Why this score? — see what drove the D grade
The composite is a weighted blend of 9 inputs, each scored 0–100. Each bar is that input's sub-score; the figure is the points it added to the 100-point composite (weight × sub-score).
- Cash flow +14.5/30.0
- Appreciation +5.0/10.0
- DSCR +4.4/10.0
- ARV discount +4.1/15.0
- 1% rule +4.0/10.0
- Schools +2.7/10.0
- Rent growth +2.5/5.0
- Livability +2.5/5.0
- Condition / age +2.5/5.0
$180,000
🖨 Deal sheet 📄 Offer letter ✓ Due diligence
Listing remarks
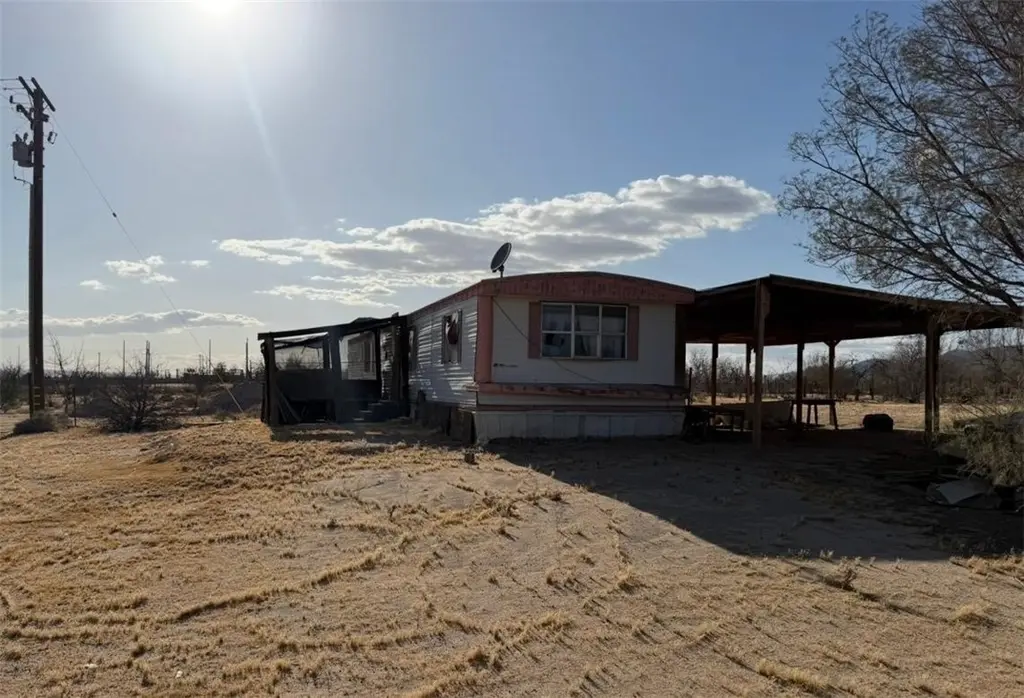
* * * JUST LISTED!!! * * * TWO MOBILE HOMES NEEDED REPAIRS SITTING IN A HUGE 40 ACRE LAND * * * WITH FUNCTIONAL WELL AND ELECTRICITY * * * ALL FENCED IN AND GATED FOR SECURITY * * * SELLER IS VERY MOTIVATED TO SELL * * *
Key facts
- 39.39 acre lot
- Built 1980
- Listed 40 days
Property features AI
Finance
- Other: Parcel number 0515162110000
- HOA & community: Suburban community
Exterior
- Utilities: Well water; Septic (type unknown)
- Home design: Single-story property; Total of 2 dwelling units
- Construction: Living area source: seller; Year built source: seller; No certified 433A
- Exterior features: Manufactured house; Rectangular lot shape; No pool; Has view; No accessory dwelling unit
Interior
- Bedrooms: 3 bedrooms on the main level
- Bathrooms: 1 full bathroom and 1 three-quarter bathroom
- Heating & cooling: Cooling available (details in remarks)
- Interior features: One-level home; Main level includes 3 bedrooms and 2 bathrooms; Has cooling (see remarks); Has laundry (see remarks)
- Laundry & utility: Laundry available (details in remarks)
Neighborhood map
What this means for you Summary
Snapshot
- This is a 3-bed/2.0-bath manufactured listed at $180k.
Deal economics
- At list price, monthly cash flow is $39 ($462/yr) — positive.
- The deal already cash-flows at list — no discount required.
- To meet the 1% rule (rent ≥ 1% of price), the offer needs to be $162k (9.8% below list).
- Recommended offer: $162k (9.8% below list) — sets the bar for 1% rule.
Location & tenants
- Location reads: area grade D — affects rentability + tenant quality, not the cash-flow math above.
- Silver Valley Unified (town): math 23% / reading 39% proficiency, ranked #323 of 517 in CA (top 62%) — families likely to look elsewhere, expect single-tenant / working-renter base with shorter leases.
- Market conditions: 209 active listings in the ZIP; 5,458 units permitted in San Bernardino County in 2024 (1,500 in 5+ unit buildings).
Forward outlook
- In year one you build about $7k of equity ($1k loan paydown + $5k appreciation (3.0% local appreciation)).
- San Bernardino County population projected at +15% by 2050 — modest demand growth; plan on rents tracking national, not racing it.
- At projected returns (3.0% appreciation + 3.0% rent growth), your $50k cash investment doubles in ~6 years — after that, you're playing with house money.
- By year 6, paydown + projected appreciation supports a ~$35k cash-out refi (75% LTV) — recoverable capital for the next deal without selling this one.
Negotiation context
- It's been on market 40 days — a 3% lower offer ($175k) is reasonable based on typical stale-listing flexibility.
- 3 sale attempts since 3y ago with the ask held roughly flat each time — persistent listings suggest the price (not the market) is what's stuck; bring a comps-based counter.
Risks & watch-outs
- Climate carrying-cost: extreme-heat days projected 7→20/yr by 2055 (HVAC capex compounding) — expect insurance premiums to compound above CPI over the hold.
Questions for the listing agent
- It's been on market 40 days. Have you received any prior offers? Is the seller open to a 10% concession, seller financing, or rate buy-down credit?
- Is there a deadline driving the sale (1031 exchange, divorce, estate, relocation)? That informs how much negotiation room exists.
- The area grade is low — what's the realistic commute time and amenity access for the typical tenant pool here? Any planned neighborhood developments (good or bad) we should know about?
- What's the average days-on-market for RENTAL listings here right now (not sales)? A rising rental-DOM trend means longer vacancies and softer asking-rent achievability than the comps imply.
- What's the recent tenant-quality profile in this submarket — average credit score on applications, eviction rate, late-payment / NSF rate, and stable-employment percentage? A property-management company in the area should have these aggregated.
- How much new for-sale + rental construction is in the pipeline within 1–3 miles? Heavy new supply typically softens prices + rents 12–24 months out; constrained supply supports both.
Investment metrics
- 1% rule
- 0.90% ✗
- Cap rate
- 6.55%
- Cash-on-cash
- 0.92%
- DSCR
- 1.04
- GRM
- 9.2
CMA / ARV
- ARV (median comp)
- $167,486
- List price
- $180,000
- Delta
- 7.47%
- Verdict
- FAIR
- Comps
- 1 within 2.0 mi
Projected returns pro-forma
3.0% appreciation · 3.0% rent growth · sell at horizon
- IRR
- 8.4%
- Equity multiple
- 1.48×
- Total profit
- $24,162
- Equity at exit
- $80,936
- IRR
- 10.9%
- Equity multiple
- 2.64×
- Total profit
- $82,636
- Equity at exit
- $124,732
Cash invested: $50,400 (down + closing). Projections, not guarantees.
Landlord ↔ Tenant lean methodology
- Overall (STATE)
- 18 Strongly Tenant-Friendly
- State California
- 18 Strongly Tenant-Friendly · D+13
- County
- — inherits STATE
- City
- — inherits STATE
ZIP-level market 92365
- Active inventory
- 209
- Price-to-rent
- 9.2×
Monthly cashflow live
- Estimated rent
- $1,623 medium interval (Pro) →
- Mortgage (P&I)
- −$944
- Tax est. 1.5%
- −$225 /mo · $2,700/yr
- Insurance
- −$75
- HOA
- −$0
- Vacancy / Maint / Mgmt
- −$341
- Net cashflow
- $39
Break-even live
UW: 25.0% down · 7.5% · 30yr · 1.5% tax · 5.0% vac · 8.0% maint · 8.0% mgmt
Financing live
Cash to close
- Down payment
- $45,000
- Closing costs
- $5,400
- Reserves months
- —
- Total cash needed
- —
Loan-product check · same deal, 3 products live
Conventional
25% down · 7.5% · 30yr
- Down + closing
- —
- Monthly P&I
- —
- Monthly cashflow
- —
- DSCR
- —
- Eligible?
- —
Personal DTI + credit; lowest rate.
DSCR
20% down · 8.5% · 30yr
- Down + closing
- —
- Monthly P&I
- —
- Monthly cashflow
- —
- DSCR
- —
- Eligible?
- —
No personal income docs; deal must DSCR.
Hard money
10% down · 12.0% · 12mo
- Down + closing
- —
- Monthly P&I
- —
- Monthly cashflow
- —
- DSCR
- —
- Eligible?
- —
Short-term bridge; refi at stabilization.
Listing history 21 events
-
2026-06-18days on market $180,000 Active 40 DOM
-
2026-06-17days on market $180,000 Active 39 DOM
-
2026-06-16days on market $180,000 Active 38 DOM
-
2026-06-15days on market $180,000 Active 37 DOM
-
2026-06-13days on market $180,000 Active 35 DOM
-
2026-06-13days on market $180,000 Active 34 DOM
-
2026-06-09days on market $180,000 Active 31 DOM
-
2026-06-08days on market $180,000 Active 30 DOM
-
2026-06-07days on market $180,000 Active 29 DOM
-
2026-06-04days on market $180,000 Active 26 DOM
-
2026-06-03days on market $180,000 Active 25 DOM
-
2026-06-02days on market $180,000 Active 24 DOM
-
2026-06-01days on market $180,000 Active 23 DOM
-
2026-05-31days on market $180,000 Active 22 DOM
-
2026-05-09$180,000 Active 30-char remark
-
2026-05-05historical $180,000 30-char remark
-
2025-09-17historical
-
2025-04-03$200,000 Active
-
2024-05-31historical
-
2023-05-22$350,000 Active
-
2011-06-29soldstatus $180,000
ⓘ Source: listings_history table (triggers on properties + properties_extension) + one-shot
backfill from property_details.listing_events for pre-trigger history.
Climate risk First Street
- Flood 1/10 Low FEMA zone D · 0% chance over 30 yrs
- Wildfire 4/10 Moderate
- Heat 8/10 Severe 7 d/yr ≥106°F today · 20 d/yr by 30 yrs out
- Wind 1/10 Low
- Air quality 7/10 Severe 12 unhealthy d/yr today · 17 by 30 yrs out
Nearby sold comps map
Loading sold comps map…
Walkable amenities ~0.75 mi
Loading nearby amenities…
Taxation est. · year 1
- Rental income
- $19,480
- − Mortgage interest
- −$10,083
- − Property taxes
- −$2,700
- − Insurance
- −$900
- − Repairs & maintenance
- −$1,558
- − Management
- −$1,558
- − Depreciation
- −$5,236
- Taxable loss
- −$2,556
- Est. tax savings @ 24.0%
- +$613
- After-tax cash flow
- $1,076/yr
For passive investors: Depreciation is non-cash, so a rental often shows a tax loss while cash-flowing — sheltering income. Rental losses are passive: they offset passive income freely, and up to $25,000/yr can offset ordinary (W-2) income if you actively participate and your MAGI is under $100k (phasing out to $0 by $150k); unused losses carry forward. On sale, claimed depreciation is recaptured at up to 25%, and gains may owe capital-gains tax (a 1031 exchange can defer both). Figures are a year-1 estimate at your 24.0% rate — not tax advice; consult a CPA.
Schools (NCES district)
- District
- Silver Valley Unified
- NCES district ID
- 0636820
- Math proficiency
- 23% ▼ -12.00%
- Reading proficiency
- 39% ▼ -12.00%
- Median HH income
- $48,754
- Composite
- 26.85/100
- National rank
- #7105
- State rank
- #323 of 517 in CA
Livability — Yermo
No livability data for this city. (Only ~50 U.S. cities are tracked.)
Census & demographics
- Population (ZIP)
- 2,514
Population outlook (San Bernardino County) Hauer SSP2
- Today (2025)
- 2,300,329 people
- By 2030
- 2,378,907 · +3.4%
- By 2040
- 2,523,137 · +9.7%
- By 2050
- 2,642,388 · +14.9%
- By 2075
- 2,880,769 · +25.2%
- By 2100
- 2,909,436 · +26.5%
Race, ethnicity, and origin ACS 2023
- Neighborhood character
- Diverse neighborhood (Simpson 0.60)
- Race & ethnicity
- White 56% Hispanic / Latino 29% Two or more races 20% Asian 8% Black 2%
- Hispanic origin (detail)
- Mexican 14% Dominican 7%
- Common ancestry
- Romanian 5% Slovak 2% Serbian 2%
- Foreign-born
- 16% · Canada, Vietnam
- Languages at home
- 85% English-only · Spanish 8% Vietnamese 2% German/W. Germanic 2%
Political lean MEDSL · San Bernardino
- 2024 margin
- Toss-up / Even · D 47.5% · R 49.7% · Other 2.8%
- 2008→2024 swing
- -8.5pp toward R · 2008: 6.3pp · 2024: -2.1pp
- All cycles
- 2024: R+2.1 2020: D+10.7 2016: D+9.8 2012: D+5.4 2008: D+6.3
Not yet ingested
- Civics
- —
Market trends
- HPI YoY
- —
- Current HPI
- —
- Rent YoY
- —
- Metro
- —
- State GDP YoY
- ▲ 3.21%
- F500 in state
- 116
Industry mix (Fortune 500 HQ in CA)
| Industry | F500 HQs | Revenue |
|---|---|---|
| Technology | 27 | $1,492B |
|
||
| Financial Services | 3 | $174B |
|
||
| Retail | 3 | $44B |
|
||
| Insurance | 3 | $26B |
|
||
| Media / Entertainment | 2 | $115B |
|
||
| Pharmaceuticals / Biotech | 2 | $62B |
|
||
Price history
+0.0% since first listed7 events — show timeline
- 2026-05-09 Listed $180,000 CRMLS
- 2026-05-05 Coming Soon $180,000 CRMLS
- 2025-09-17 Listing Removed — CRMLS
- 2025-04-03 Listed $200,000 CRMLS
- 2024-05-31 Listing Removed — CRMLS
- 2023-05-22 Listed $350,000 CRMLS
- 2011-06-29 Sold (MLS) $180,000 CRMLS
Property tax history
+1.1%/yrLatest (2025): $153 · +8.1% YoY. Source: county tax records.
Cash-flow waterfall
monthlySold comps — $/sqft
last 12 mo · ≤1 miLoading sold comps…