 Multi-family
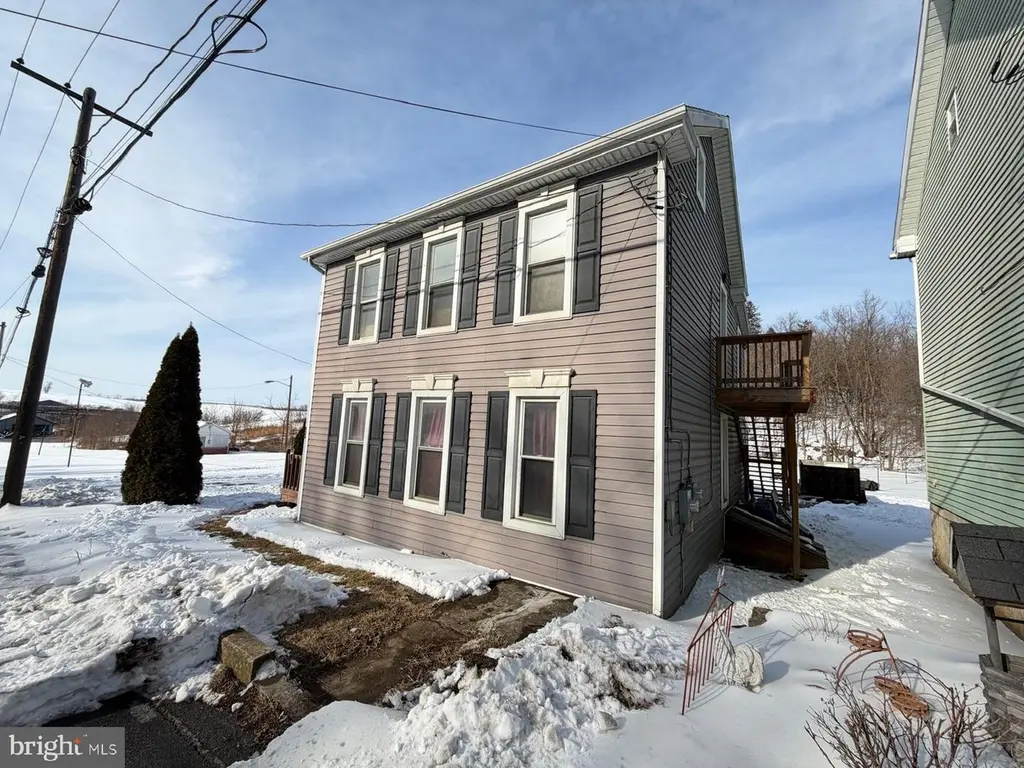
823 West Main St · Waynesboro, PA
Flood risk 7/10 · Major
- FEMA flood zone
- X (unshaded)
- Chance of flooding over 30 yrs
- 0.99%
- Est. flood insurance / yr
- $507 – $1,088
Fire risk 1/10 · Minimal
- Est. fire insurance / yr
- $511 – $949
Heat risk 5/10 · Moderate
- Hot days now (above 100°F)
- 7 days/yr
- Hot days in 30 yrs
- 16 days/yr
Wind risk 2/10 · Minimal
- Chance of severe wind over 30 yrs
- 3.0%
Air-quality risk 2/10 · Minimal
- Unhealthy air days now
- 1 days/yr
- Unhealthy air days in 30 yrs
- 2 days/yr
Risk factors via First Street. Map © Google.
Why this score? — see what drove the B grade
The composite is a weighted blend of 9 inputs, each scored 0–100. Each bar is that input's sub-score; the figure is the points it added to the 100-point composite (weight × sub-score).
- Cash flow +30.0/30.0
- DSCR +10.0/10.0
- 1% rule +9.9/10.0
- ARV discount +8.8/15.0
- Livability +3.9/5.0
- Schools +3.8/10.0
- Rent growth +2.5/5.0
- Condition / age +2.5/5.0
- Appreciation +0.0/10.0
$275,000
🖨 Deal sheet (PDF) 📄 Offer letter ✓ Due diligence
Multi-family units
County records classify this as Multi-Family (5+ Unit). Listing-text estimate: 1 unit. estimate disagrees with records
5+ unit building — per-unit beds/baths from public records are typically unavailable; the breakdown below (if shown) is an estimate from the listing text.
Listing remarks MLS
Location is everything! Situated on a high traffic street with excellent visibility and close to major highways. Property features two separate dwellings, ideal for owner-occupants, investors, or business owners. Live in one unit and rent the other, or operate a business with maximum exposure. Second unit is near completion all materials are on site and ready to finish( Over 6k in materials). Large garage with electricity offers potential for a third unit or business storage. Ample parking and strong income potential. Rare opportunity!
Key facts
- 0.4 acre lot
- 2 garage spots
- Built 1927
Neighborhood map
What this means for you Summary
Snapshot
- This is a 3-bed/2.0-bath multifamily listed at $275k.
Deal economics
- At list price, monthly cash flow is $1k ($17k/yr) — positive.
- The deal already cash-flows at list — no discount required.
- Meets the 1% rule at list price ($4k rent vs $275k).
- Recommended offer: $242k (12.0% below list) — sets the bar for market timing.
- Cap rate 12.9% vs local median 3.8% in Waynesboro — top-decile yield for the area; either an underpriced asset or a hidden risk that comps aren't pricing in. Stress-test before assuming the spread holds.
Location & tenants
- Location reads 78/100 on livability (#280 in PA, #2,482 nationally) — a middle-class / working-renter tenant base. Strengths: cost of living A+, housing A+, health & safety A+; Watch: employment D, commute F.
- Waynesboro Area SD (town): math 36% / reading 52% proficiency, ranked #283 of 539 in PA (top 52%) — families likely to look elsewhere, expect single-tenant / working-renter base with shorter leases.
- Market conditions: 230 active listings in the ZIP; 4 comparable units currently listed for rent nearby; rentals lingering (median 45d on market — plan ~5-8 weeks vacancy on turnover, expect pricing pressure); 75% of comp listings sitting > 30 days — soft ceiling on asking rent; 633 units permitted in Franklin County in 2024 (112 in 5+ unit buildings).
- At $4,103/mo this rent would consume 67% of the median local household income ($73k/yr) (locally 539% of renters already pay >50% of income on rent) — very limited rent-growth headroom before tenants either downsize or default.
Forward outlook
- Local home prices are declining (-3.0%/yr); year-one equity from $2k of loan paydown is wiped out by about $8k of value loss. Plan a longer hold.
- At projected returns (-3.0% appreciation + 3.0% rent growth), your $77k cash investment doubles in ~6 years — after that, you're playing with house money.
Negotiation context
- It's been on market 133 days — a 12% lower offer ($242k) is reasonable based on typical stale-listing flexibility.
- 3 sale attempts since 24y ago with the ask held roughly flat each time — persistent listings suggest the price (not the market) is what's stuck; bring a comps-based counter.
- Current owner paid $143k; list at $275k implies a 92% gain — meaningful room to come down on a strong offer.
Risks & watch-outs
- Watch-outs: flood insurance adds $66/mo; built in 1927 — expect roof / HVAC / electrical / plumbing capex.
- Climate carrying-cost: major flood risk; extreme-heat days projected 7→16/yr by 2055 (HVAC capex compounding) — expect insurance premiums to compound above CPI over the hold.
Questions for the listing agent
- It's been on market 133 days. Have you received any prior offers? Is the seller open to a 12% concession, seller financing, or rate buy-down credit?
- Built in 1927 — when were the roof, HVAC, electrical panel, plumbing, and water heater last replaced?
- What's the actual annual flood-insurance premium (NFIP or private), and is the property in a SFHA with mandatory coverage?
- Why hasn't it sold? Are there any deal-killer items the seller is aware of (foundation, flood, title, zoning, code violations)?
- Is there a deadline driving the sale (1031 exchange, divorce, estate, relocation)? That informs how much negotiation room exists.
- Schools are B-rated — typically a magnet for longer-tenancy family renters. What's the average tenant stay here, and is there a school-zone premium baked into asking?
- What's the average days-on-market for RENTAL listings here right now (not sales)? A rising rental-DOM trend means longer vacancies and softer asking-rent achievability than the comps imply.
- What's the recent tenant-quality profile in this submarket — average credit score on applications, eviction rate, late-payment / NSF rate, and stable-employment percentage? A property-management company in the area should have these aggregated.
- How much new apartment / multifamily construction is in the pipeline within 1–3 miles? Heavy new supply (>2% of stock underway) typically softens rents 12–24 months out; light construction supports rent growth.
Investment metrics
- 1% rule
- 1.49% ✓
- Cap rate
- 12.90%
- Cash-on-cash
- 23.61%
- DSCR
- 2.05
- GRM
- 5.6
CMA / ARV
- ARV (median comp)
- $283,420
- List price
- $275,000
- Delta
- -2.97%
- Verdict
- FAIR
- Comps
- 20 within 1.0 mi
Show comp detail 1 sale within ~0.75 mi
| Address | Dist | Beds/Ba | Sqft | Sold | Price | $/sf | Match |
|---|---|---|---|---|---|---|---|
| 164 Hamilton Ave | 0.54mi | 3/2.0 | 1,804 (+0%) | 2mo | $234,900 | $130 | 73 |
Match score weights: distance 35% · size 25% · config 20% · recency 20%. Top-matched comps best support the ARV.
Projected returns pro-forma
-3.0% appreciation · 3.0% rent growth · sell at horizon
- IRR
- 15.4%
- Equity multiple
- 1.62×
- Total profit
- $47,686
- Equity at exit
- $41,003
- IRR
- 24.1%
- Equity multiple
- 3.08×
- Total profit
- $160,295
- Equity at exit
- $23,777
Cash invested: $77,000 (down + closing). Projections, not guarantees.
Landlord ↔ Tenant lean methodology
- Overall (STATE)
- 62 Landlord-Friendly
- State Pennsylvania
- 62 Landlord-Friendly · EVEN
- County
- — inherits STATE
- City
- — inherits STATE
ZIP-level market 17268
- Active inventory
- 230
- Price-to-rent
- 16.8×
Monthly cashflow live
- Estimated rent
- $4,103 medium interval (Pro) →
- Mortgage (P&I)
- −$1,442
- Tax from tax record
- −$170 /mo · $2,037/yr
- Insurance
- −$115
- Flood insurance flood zone
- −$66 /mo · $798/yr
- HOA
- −$0
- Vacancy / Maint / Mgmt
- −$862
- Net cashflow
- $1,448
Break-even live
Sensitivity live
| Price | -10% $1,604 | -5% $1,526 | +0% $1,448 | +5% $1,371 | +10% $1,293 |
|---|---|---|---|---|---|
| Rent | -10% $1,124 | -5% $1,286 | +0% $1,448 | +5% $1,611 | +10% $1,773 |
| Rate | -1.0pp $1,587 | -0.5pp $1,518 | base $1,448 | +0.5pp $1,377 | +1.0pp $1,305 |
3-unit breakdown (identical units grouped — click to expand)
| Units | Beds | Baths | Est. rent |
|---|---|---|---|
| 3× units | 3 | 2 | $4,104 |
| #1 | 3 | 2 | $1,368 |
| #2 | 3 | 2 | $1,368 |
| #3 | 3 | 2 | $1,368 |
| Total (3 units) | $4,103 | ||
UW: 25.0% down · 7.5% · 30yr · 1.5% tax · 5.0% vac · 8.0% maint · 8.0% mgmt
Financing live
Cash to close
- Down payment
- $68,750
- Closing costs
- $8,250
- Reserves months
- —
- Total cash needed
- —
Loan-product check · same deal, 3 products live
Conventional
25% down · 7.5% · 30yr
- Down + closing
- —
- Monthly P&I
- —
- Monthly cashflow
- —
- DSCR
- —
- Eligible?
- —
Personal DTI + credit; lowest rate.
DSCR
20% down · 8.5% · 30yr
- Down + closing
- —
- Monthly P&I
- —
- Monthly cashflow
- —
- DSCR
- —
- Eligible?
- —
No personal income docs; deal must DSCR.
Hard money
10% down · 12.0% · 12mo
- Down + closing
- —
- Monthly P&I
- —
- Monthly cashflow
- —
- DSCR
- —
- Eligible?
- —
Short-term bridge; refi at stabilization.
Rent comps 4 comps
| Address | Beds | Baths | Sqft | Rent | $/sqft | DOM | Units | Dist |
|---|---|---|---|---|---|---|---|---|
| 457 Frick Ave Waynesboro, PA | 3.0 | 2.5 | 2193 | $2,200 | $1.00 | 22d | 1 | 0.45mi |
| 228 Ridge Ave Waynesboro, PA | 3.0 | 1.0 | 1300 | $1,500 | $1.15 | 44d | 1 | 0.49mi |
| 230 W 2nd St Unit A Waynesboro, PA | 2.0 | 2.0 | 2000 | $1,200 | $0.60 | 44d | 1 | 0.59mi |
| 23 Philadelphia Ave Waynesboro, PA | 3.0 | 3.0 | 1985 | $2,200 | $1.11 | 44d | 1 | 0.83mi |
Listing history 24 events
-
2026-06-18days on market $275,000 Active 133 DOM
-
2026-06-17days on market $275,000 Active 132 DOM
-
2026-06-16days on market $275,000 Active 131 DOM
-
2026-06-15days on market $275,000 Active 130 DOM
-
2026-06-14days on market $275,000 Active 128 DOM
-
2026-06-13days on market $275,000 Active 127 DOM
-
2026-06-10days on market $275,000 Active 125 DOM
-
2026-06-09days on market $275,000 Active 124 DOM
-
2026-06-08days on market $275,000 Active 123 DOM
-
2026-06-07days on market $275,000 Active 122 DOM
-
2026-06-05days on market $275,000 Active 119 DOM
-
2026-06-03days on market $275,000 Active 118 DOM
-
2026-06-02days on market $275,000 Active 117 DOM
-
2026-06-01days on market $275,000 Active 116 DOM
-
2026-05-31days on market $275,000 Active 115 DOM
-
2026-05-30days on market $275,000 Active 114 DOM
-
2026-02-06$275,000 Active 541-char remark
Show marketing remark (541 chars)
Location is everything! Situated on a high traffic street with excellent visibility and close to major highways. Property features two separate dwellings, ideal for owner-occupants, investors, or business owners. Live in one unit and rent the other, or operate a business with maximum exposure. Second unit is near completion all materials are on site and ready to finish( Over 6k in materials). Large garage with electricity offers potential for a third unit or business storage. Ample parking and strong income potential. Rare opportunity!
-
2026-01-23historical $275,000 541-char remark
Show marketing remark (541 chars)
Location is everything! Situated on a high traffic street with excellent visibility and close to major highways. Property features two separate dwellings, ideal for owner-occupants, investors, or business owners. Live in one unit and rent the other, or operate a business with maximum exposure. Second unit is near completion all materials are on site and ready to finish( Over 6k in materials). Large garage with electricity offers potential for a third unit or business storage. Ample parking and strong income potential. Rare opportunity!
-
2006-04-28soldstatus $143,000 426-char remark
Show marketing remark (426 chars)
FIRST TIME HOMEBUYERS & INVESTORS. THIS IS THE HOUSE FOR YOU. $2,000 ALLOW. FOR CARPET & EXT. PAINT W/ ACCEPT. OFFER. CONV. LOC. ON THE EDGE OF TOWN 2 STORY COL. W/ PART. FIN. BASEMENT(JUST NEEDS FLOORING), LR, DR, DEN, 3 BDS, 2 FULL BA'S, APPL. 'S CONVEY IN THE UPDATED EAT-IN KIT. ENCL. REAR PORCH. UPDATED ELEC. SELLER TO REPLACE H2O HTR. LARGE LOT W/ PLENTY OF PARKING + A 2 CAR GAR. SQ. FT. & AGE APPROX.
-
2006-03-29historical 426-char remark
Show marketing remark (426 chars)
FIRST TIME HOMEBUYERS & INVESTORS. THIS IS THE HOUSE FOR YOU. $2,000 ALLOW. FOR CARPET & EXT. PAINT W/ ACCEPT. OFFER. CONV. LOC. ON THE EDGE OF TOWN 2 STORY COL. W/ PART. FIN. BASEMENT(JUST NEEDS FLOORING), LR, DR, DEN, 3 BDS, 2 FULL BA'S, APPL. 'S CONVEY IN THE UPDATED EAT-IN KIT. ENCL. REAR PORCH. UPDATED ELEC. SELLER TO REPLACE H2O HTR. LARGE LOT W/ PLENTY OF PARKING + A 2 CAR GAR. SQ. FT. & AGE APPROX.
-
2006-03-27$139,900 426-char remark
Show marketing remark (426 chars)
FIRST TIME HOMEBUYERS & INVESTORS. THIS IS THE HOUSE FOR YOU. $2,000 ALLOW. FOR CARPET & EXT. PAINT W/ ACCEPT. OFFER. CONV. LOC. ON THE EDGE OF TOWN 2 STORY COL. W/ PART. FIN. BASEMENT(JUST NEEDS FLOORING), LR, DR, DEN, 3 BDS, 2 FULL BA'S, APPL. 'S CONVEY IN THE UPDATED EAT-IN KIT. ENCL. REAR PORCH. UPDATED ELEC. SELLER TO REPLACE H2O HTR. LARGE LOT W/ PLENTY OF PARKING + A 2 CAR GAR. SQ. FT. & AGE APPROX.
-
2002-12-05soldstatus $80,000
-
2002-10-25historical
-
2002-04-16$80,000
ⓘ Source: listings_history table (triggers on properties + properties_extension) + one-shot
backfill from property_details.listing_events for pre-trigger history.
Tax reassessment forecast PA · Partial reset (capped growth)
- Current annual tax
- $2,037 · $170/mo
- Projected year-2 tax
- $3,191 · $266/mo
- Expected delta
- +$1,154/yr (+$96/mo · 56.6%)
ⓘ Screening estimate from a state-policy table — verify with the county assessor before closing.
Climate risk First Street
- Flood 7/10 Severe FEMA zone X (unshaded) · 99% chance over 30 yrs
- Wildfire 1/10 Low
- Heat 5/10 Major 7 d/yr ≥100°F today · 16 d/yr by 30 yrs out
- Wind 2/10 Low 3% chance of damaging wind over 30 yrs
- Air quality 2/10 Low 1 unhealthy d/yr today · 2 by 30 yrs out
Nearby sold comps map
Loading sold comps map…
Walkable amenities ~0.75 mi
Loading nearby amenities…
Taxation est. · year 1
- Rental income
- $49,236
- − Mortgage interest
- −$15,404
- − Property taxes
- −$2,037
- − Insurance
- −$2,172
- − Repairs & maintenance
- −$3,939
- − Management
- −$3,939
- − Depreciation
- −$8,000
- Taxable income
- $13,744
- Est. tax owed @ 24.0%
- −$3,299
- After-tax cash flow
- $14,083/yr
For passive investors: Depreciation is non-cash, so a rental often shows a tax loss while cash-flowing — sheltering income. Rental losses are passive: they offset passive income freely, and up to $25,000/yr can offset ordinary (W-2) income if you actively participate and your MAGI is under $100k (phasing out to $0 by $150k); unused losses carry forward. On sale, claimed depreciation is recaptured at up to 25%, and gains may owe capital-gains tax (a 1031 exchange can defer both). Figures are a year-1 estimate at your 24.0% rate — not tax advice; consult a CPA.
Schools (NCES district)
- District
- Waynesboro Area SD
- NCES district ID
- 4225110
- Math proficiency
- 36% ▼ -15.00%
- Reading proficiency
- 52% ▼ -15.00%
- Median HH income
- $50,445
- Composite
- 37.79/100
- National rank
- #4342
- State rank
- #283 of 539 in PA
Livability — Waynesboro
- Score
- 78/100
- State rank
- #280
- US rank
- #2482
Category grades
Schools grade is shown separately in the Schools card above.
Census & demographics
- Census place
- Waynesboro, PA
- County
- Franklin County · 56,916 people
- City population
- 29,362
- Metro
- Chambersburg-Waynesboro, PA
- Population (ZIP)
- 29,362
- Household income
- $73,161
- Rent vs Own
- Severe rent burden
- 539.0
Population outlook (Franklin County) Hauer SSP2
- Today (2025)
- 157,827 people
- By 2030
- 158,933 · +0.7%
- By 2040
- 159,060 · +0.8%
- By 2050
- 155,132 · -1.7%
- By 2075
- 138,545 · -12.2%
- By 2100
- 112,321 · -28.8%
Race, ethnicity, and origin ACS 2023
- Neighborhood character
- Predominantly White (86%)
- Race & ethnicity
- White 86% Hispanic / Latino 7% Two or more races 6% Black 3%
- Hispanic origin (detail)
- Mexican 2% Puerto Rican 3%
- Common ancestry
- Lithuanian 3% Romanian 2% Slovak 2%
- Foreign-born
- 3% · Canada
- Languages at home
- 95% English-only · Spanish 4%
Political lean MEDSL · Franklin
- 2024 margin
- Solid R (+43.0) · D 28.1% · R 71.1%
- 2008→2024 swing
- -10.4pp toward R · 2008: -32.6pp · 2024: -43.0pp
- All cycles
- 2024: R+43.0 2020: R+43.1 2016: R+46.5 2012: R+38.5 2008: R+32.6
Not yet ingested
- Civics
- —
Market trends
- HPI YoY
- ▼ -113.20%
- Current HPI
- 189.6931
- Rent YoY
- —
- Metro
- Chambersburg-Waynesboro, PA
- State GDP YoY
- ▲ 1.68%
- F500 in state
- 34
Industry mix (Fortune 500 HQ in PA)
| Industry | F500 HQs | Revenue |
|---|---|---|
| Healthcare | 2 | $309B |
|
||
| Insurance | 2 | $27B |
|
||
| Telecommunications / Media | 1 | $124B |
|
||
| Industrial Distribution | 1 | $22B |
|
||
| Financial Services | 1 | $20B |
|
||
| Chemicals / Materials | 1 | $18B |
|
||
Price history
+243.8% since first listed8 events — show timeline
- 2026-02-06 Listed $275,000 BRIGHT MLS
- 2026-01-23 Coming Soon $275,000 BRIGHT MLS
- 2006-04-28 Sold (MLS) $143,000 MRIS
- 2006-03-29 Delisted — MRIS
- 2006-03-27 Listed $139,900 MRIS
- 2002-12-05 Sold (MLS) $80,000 MRIS
- 2002-10-25 Delisted — MRIS
- 2002-04-16 Listed $80,000 MRIS
Property tax history
+13.6%/yrLatest (2026): $2,037 · +8.3% YoY. Source: county tax records.
Cash-flow waterfall
monthlySold comps — $/sqft
last 12 mo · ≤1 miLoading sold comps…