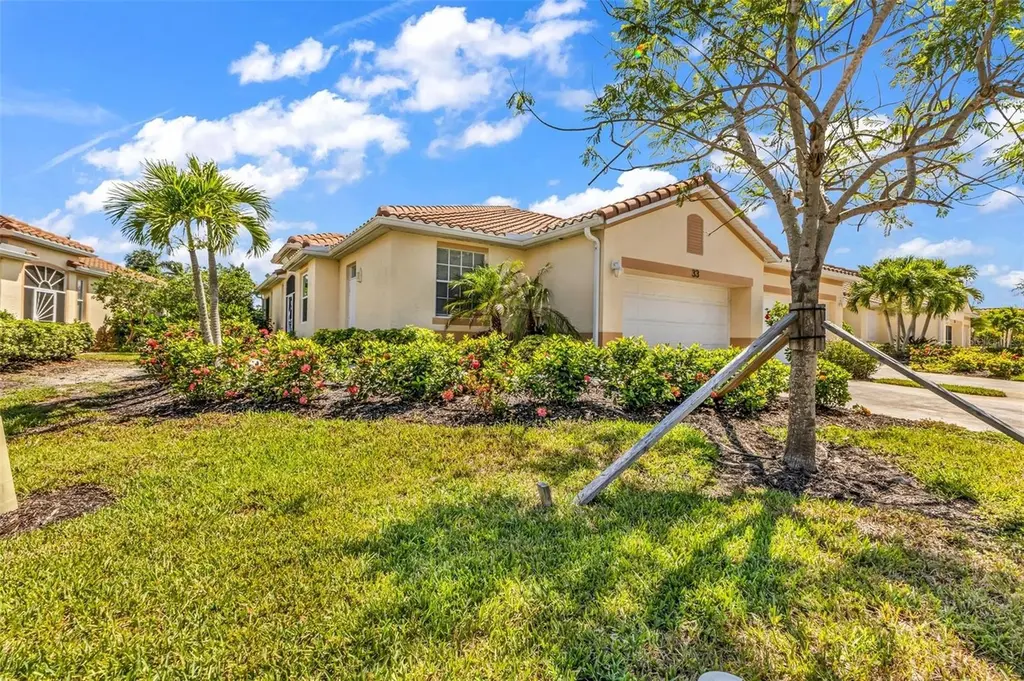
3181 Matecumbe Key Rd #33 · Cape Coral, FL
Flood risk 9/10 · Severe
- FEMA flood zone
- AE
- Chance of flooding over 30 yrs
- 0.99%
- Est. flood insurance / yr
- $1,737 – $8,500
Fire risk 6/10 · Moderate
- Est. fire insurance / yr
- $947 – $1,759
Heat risk 10/10 · Severe
- Hot days now (above 107°F)
- 7 days/yr
- Hot days in 30 yrs
- 29 days/yr
Wind risk 10/10 · Severe
- Chance of severe wind over 30 yrs
- 99.0%
Air-quality risk 3/10 · Minor
- Unhealthy air days now
- 2 days/yr
- Unhealthy air days in 30 yrs
- 2 days/yr
Risk factors via First Street. Map © Google.
Why this score? — see what drove the C- grade
The composite is a weighted blend of 9 inputs, each scored 0–100. Each bar is that input's sub-score; the figure is the points it added to the 100-point composite (weight × sub-score).
- Cash flow +17.2/30.0
- 1% rule +9.7/10.0
- ARV discount +7.5/15.0
- DSCR +5.4/10.0
- Schools +4.1/10.0
- Livability +3.9/5.0
- Rent growth +2.5/5.0
- Condition / age +2.5/5.0
- Appreciation +0.0/10.0
$234,900
🖨 Deal sheet (PDF) 📄 Offer letter ✓ Due diligence
Listing remarks
Turnkey Marina Living at Its Finest! This beautifully maintained villa comes fully furnished and is ready for you to move right in. The bright, open layout features a 2-bedroom, 2-bathroom floor plan with a den. Enjoy your morning coffee or evening cocktail on the spacious, screened lanai with serene views of a Marina pond. Perfect for your vehicles and hobbies, the 2-car garage offers plenty of room for both a car and a golf cart. Located in a remarkably friendly neighborhood, you are just steps from the community pool and fitness center, and within easy walking distance to the local waterfront bar & grill. Hop in your golf cart, and you're just minutes from the 27-hole golf course a
Key facts
- Marina pond views
- Fitness center
- Community pool
Tags
Property features AI
Finance
- Other: Furnished; Pets allowed: cats and dogs
- Financial info: Total annual fees (association/condo) listed as $9,834; Total monthly fees listed as $819.50; Lease restrictions apply
- HOA & community: Has HOA (Association: The Resort at BSM/Kayla Matias); Monthly HOA $99.50; Annual association fee $1,194; Condo fee $720 monthly; Association approval required; Association amenities: fitness center, pool, spa/hot tub, tennis courts, pickleball courts, golf course access, gated entry, security, vehicle restrictions; Community features: dog park, street lights, golf carts allowed, association-owned recreation, deed restrictions, buyer approval required
Exterior
- Parking: Attached garage; 2-car garage
- Security: Gated community; Community security (association)
- Utilities: Public water; Public sewer; Electricity connected; Cable available; Sewer connected; Water connected; Irrigation equipment
- Home design: Residential villa; One story; Southeast facing
- Construction: Stucco construction; Tile roof; Slab foundation; Built area approximately 1,816 sq ft
- Exterior features: Covered and enclosed patios/porches; Front porch; Rear porch; Hurricane shutters; Sliding doors; Mature landscaping with trees
Interior
- Kitchen: Dishwasher; Disposal; Microwave; Range; Refrigerator; Electric water heater
- Bedrooms: 2 bedrooms
- Flooring: Carpet; Tile
- Bathrooms: 2 full bathrooms
- Heating & cooling: Electric heating; Central air conditioning
- Interior features: High ceilings; Kitchen/family room combo; Living room/dining room combo; Open floorplan; Split-bedroom layout; Walk-in closet(s); Window treatments
- Laundry & utility: Washer; Dryer; Laundry area in garage
Neighborhood map
What this means for you Summary
Snapshot
- This is a 2-bed/2.0-bath condo listed at $235k.
Deal economics
- At list price, monthly cash flow is $-257 ($-3k/yr) — negative.
- To cash-flow at today's rent, offer at most $189k (19.3% below list).
- Meets the 1% rule at list price ($3k rent vs $235k).
- Recommended offer: $189k (19.3% below list) — sets the bar for cash-flow.
- Cap rate 7.2% vs local median 3.1% in Cape Coral — top-decile yield for the area; either an underpriced asset or a hidden risk that comps aren't pricing in. Stress-test before assuming the spread holds.
Location & tenants
- Location reads 77/100 on livability (#208 in FL, #3,098 nationally) — a middle-class / working-renter tenant base. Strengths: housing A+, health & safety A+, amenities B+; Watch: commute F.
- Lee (suburban): math 47% / reading 50% proficiency, ranked #42 of 73 in FL (top 58%) — families likely to look elsewhere, expect single-tenant / working-renter base with shorter leases.
- Market conditions: 1481 active listings in the ZIP; 10 comparable units currently listed for rent nearby; rentals at typical pace (median 25d on market — plan ~3-4 weeks tenant-placement turnaround); solid renter incomes; 15,411 units permitted in Lee County in 2024 (4,686 in 5+ unit buildings).
- At $3,444/mo this rent would consume 54% of the median local household income ($77k/yr) (locally 226% of renters already pay >50% of income on rent) — very limited rent-growth headroom before tenants either downsize or default.
Forward outlook
- Local home prices are declining (-3.0%/yr); year-one equity from $2k of loan paydown is wiped out by about $7k of value loss. Plan a longer hold.
- Lee County population projected at +44% by 2050 — long-run rental-demand tailwind backs the buy-and-hold thesis.
Negotiation context
- It's been on market 28 days — a 2% lower offer ($231k) is reasonable based on typical stale-listing flexibility.
- Current owner paid $150k; list at $235k implies a 57% gain — meaningful room to come down on a strong offer.
Risks & watch-outs
- Watch-outs: flood insurance adds $427/mo; HOA is 24% of rent.
- Climate carrying-cost: in FEMA flood zone AE (mandatory federal flood insurance); severe wind risk, 99% chance of damaging wind over 30y; major wildfire risk; extreme-heat days projected 7→29/yr by 2055 (HVAC capex compounding) — expect insurance premiums to compound above CPI over the hold.
Questions for the listing agent
- What do current leases actually rent for vs. the listed asking? Can we see a recent rent roll and the last 12 months of T-12 income?
- What's the actual annual flood-insurance premium (NFIP or private), and is the property in a SFHA with mandatory coverage?
- What does the HOA fee cover, when was the last increase, and are there any pending special assessments or reserve-fund shortfalls?
- Any open or pending special assessments — roof, HVAC, plumbing, elevator, façade? What's the per-unit balance and payoff schedule, and is the seller paying it off at close or rolling it to the buyer?
- Is there a deadline driving the sale (1031 exchange, divorce, estate, relocation)? That informs how much negotiation room exists.
- Schools are B-rated — typically a magnet for longer-tenancy family renters. What's the average tenant stay here, and is there a school-zone premium baked into asking?
- What's the average days-on-market for RENTAL listings here right now (not sales)? A rising rental-DOM trend means longer vacancies and softer asking-rent achievability than the comps imply.
- What's the recent tenant-quality profile in this submarket — average credit score on applications, eviction rate, late-payment / NSF rate, and stable-employment percentage? A property-management company in the area should have these aggregated.
- How much new apartment / multifamily construction is in the pipeline within 1–3 miles? Heavy new supply (>2% of stock underway) typically softens rents 12–24 months out; light construction supports rent growth.
Investment metrics
- 1% rule
- 1.47% ✓
- Cap rate
- 7.16%
- Cash-on-cash
- 3.09%
- DSCR
- 1.14
- GRM
- 5.7
CMA / ARV
No comps found within radius.
Projected returns pro-forma
-3.0% appreciation · 3.0% rent growth · sell at horizon
- IRR
- -23.7%
- Equity multiple
- 0.19×
- Total profit
- $-53,567
- Equity at exit
- $35,024
- IRR
- -17.4%
- Equity multiple
- 0.02×
- Total profit
- $-64,154
- Equity at exit
- $20,310
Cash invested: $65,772 (down + closing). Projections, not guarantees.
Landlord ↔ Tenant lean methodology
- Overall (STATE)
- 87 Strongly Landlord-Friendly
- State Florida
- 87 Strongly Landlord-Friendly · R+3
- County
- — inherits STATE
- City
- — inherits STATE
ZIP-level market 33955
- Home prices YoY
- -24.5%
- Active inventory
- 1481
- Price-to-rent
- 5.7×
Monthly cashflow live
- Estimated rent
- $3,444 high interval (Pro) →
- Mortgage (P&I)
- −$1,232
- Tax from tax record
- −$403 /mo · $4,830/yr
- Insurance
- −$98
- Flood insurance flood zone
- −$427 /mo · $5,118/yr
- HOA
- −$819
- Vacancy / Maint / Mgmt
- −$723
- Net cashflow
- $-257
Break-even live
Sensitivity live
| Price | -10% $-124 | -5% $-191 | +0% $-257 | +5% $-324 | +10% $-390 |
|---|---|---|---|---|---|
| Rent | -10% $-529 | -5% $-393 | +0% $-257 | +5% $-121 | +10% $15 |
| Rate | -1.0pp $-139 | -0.5pp $-198 | base $-257 | +0.5pp $-318 | +1.0pp $-380 |
UW: 25.0% down · 7.5% · 30yr · 1.5% tax · 5.0% vac · 8.0% maint · 8.0% mgmt
Financing live
Cash to close
- Down payment
- $58,725
- Closing costs
- $7,047
- Reserves months
- —
- Total cash needed
- —
Loan-product check · same deal, 3 products live
Conventional
25% down · 7.5% · 30yr
- Down + closing
- —
- Monthly P&I
- —
- Monthly cashflow
- —
- DSCR
- —
- Eligible?
- —
Personal DTI + credit; lowest rate.
DSCR
20% down · 8.5% · 30yr
- Down + closing
- —
- Monthly P&I
- —
- Monthly cashflow
- —
- DSCR
- —
- Eligible?
- —
No personal income docs; deal must DSCR.
Hard money
10% down · 12.0% · 12mo
- Down + closing
- —
- Monthly P&I
- —
- Monthly cashflow
- —
- DSCR
- —
- Eligible?
- —
Short-term bridge; refi at stabilization.
Rent comps 10 comps
| Address | Beds | Baths | Sqft | Rent | $/sqft | DOM | Units | Dist |
|---|---|---|---|---|---|---|---|---|
| 3191 Matecumbe Key Rd #206 Punta Gorda, FL | 2.0 | 2.0 | 1102 | $4,400 | $3.99 | 25d | 1 | 0.00mi |
| 3181 Matecumbe Key Rd Punta Gorda, FL | 2.0 | 2.0 | 1254 | $2,450 | $1.95 | 25d | 2 | 0.06mi |
| 3170 Matecumbe Key Rd #134 Punta Gorda, FL | 2.0 | 2.0 | 1188 | $1,899 | $1.60 | 25d | 1 | 0.10mi |
| 17947 Courtside Landings Cir Punta Gorda, FL | 3.0 | 2.0 | 1338 | $5,500 | $4.11 | 25d | 1 | 0.30mi |
| 3020 Matecumbe Key Rd #103 Punta Gorda, FL | 2.0 | 2.0 | 1148 | $5,200 | $4.53 | 25d | 1 | 0.40mi |
| 2060 Matecumbe Key Rd Punta Gorda, FL | 2.0–3.0 | 2.0 | 1271 | $1,850 | $1.45 | 25d | 3 | 0.48mi |
| 1001 Islamorada Blvd Unit 12A Punta Gorda, FL | 2.0 | 2.0 | 1365 | $1,600 | $1.17 | 17d | 1 | 0.78mi |
| 5050 Marianne Key Rd Unit 1B Punta Gorda, FL | 2.0 | 2.0 | 1347 | $4,500 | $3.34 | 17d | 1 | 0.98mi |
| 4005 Big Pass Ln Punta Gorda, FL | 2.0 | 2.0 | 1423 | $5,500 | $3.87 | 17d | 1 | 1.05mi |
| 3929 NW 42nd Ln Cape Coral, FL | 3.0 | 2.0 | 1333 | $1,995 | $1.50 | 25d | 1 | 1.33mi |
HOA detail condo
- Monthly dues
- $819 · $9,828/yr
- Likely covers
- waterpoolgym
- Assessments
- None detected in remarks — confirm with the listing agent.
Listing history 16 events
-
2026-06-17days on market $234,900 Active 28 DOM
-
2026-06-16days on market $234,900 Active 27 DOM
-
2026-06-15days on market $234,900 Active 26 DOM
-
2026-06-13days on market $234,900 Active 24 DOM
-
2026-06-10days on market $234,900 Active 21 DOM
-
2026-06-09days on market $234,900 Active 20 DOM
-
2026-06-08days on market $234,900 Active 19 DOM
-
2026-06-07days on market $234,900 Active 18 DOM
-
2026-06-03days on market $234,900 Active 14 DOM
-
2026-06-02days on market $234,900 Active 13 DOM
-
2026-06-01days on market $234,900 Active 12 DOM
-
2026-05-31days on market $234,900 Active 11 DOM
-
2026-05-20$234,900 Active
-
2015-06-30soldstatus $150,000
-
2003-07-28soldstatus $175,000
-
1999-07-14soldstatus $168,100
ⓘ Source: listings_history table (triggers on properties + properties_extension) + one-shot
backfill from property_details.listing_events for pre-trigger history.
Tax reassessment forecast FL · Resets to sale price
- Current annual tax
- $4,830 · $403/mo
- Projected year-2 tax
- $4,830 · $403/mo
- Expected delta
- $0/yr ($0/mo · 0.0%)
ⓘ Screening estimate from a state-policy table — verify with the county assessor before closing.
Climate risk First Street
- Flood 9/10 Extreme FEMA zone AE · 99% chance over 30 yrs
- Wildfire 6/10 Major
- Heat 10/10 Extreme 7 d/yr ≥107°F today · 29 d/yr by 30 yrs out
- Wind 10/10 Extreme 99% chance of damaging wind over 30 yrs
- Air quality 3/10 Moderate 2 unhealthy d/yr today · 2 by 30 yrs out
Nearby sold comps map
Loading sold comps map…
Walkable amenities ~0.75 mi
Loading nearby amenities…
Taxation est. · year 1
- Rental income
- $41,324
- − Mortgage interest
- −$13,158
- − Property taxes
- −$4,830
- − Insurance
- −$6,293
- − Repairs & maintenance
- −$3,306
- − Management
- −$3,306
- − HOA
- −$9,828
- − Depreciation
- −$6,833
- Taxable loss
- −$6,231
- Est. tax savings @ 24.0%
- +$1,495
- After-tax cash flow
- $-1,592/yr
For passive investors: Depreciation is non-cash, so a rental often shows a tax loss while cash-flowing — sheltering income. Rental losses are passive: they offset passive income freely, and up to $25,000/yr can offset ordinary (W-2) income if you actively participate and your MAGI is under $100k (phasing out to $0 by $150k); unused losses carry forward. On sale, claimed depreciation is recaptured at up to 25%, and gains may owe capital-gains tax (a 1031 exchange can defer both). Figures are a year-1 estimate at your 24.0% rate — not tax advice; consult a CPA.
Schools (NCES district)
- District
- Lee
- NCES district ID
- 1201080
- Math proficiency
- 47% ▼ -11.00%
- Reading proficiency
- 50% ▼ -4.00%
- Median HH income
- $49,518
- Composite
- 41.49/100
- National rank
- #3458
- State rank
- #42 of 73 in FL
Livability — Cape Coral
- Score
- 77/100
- State rank
- #208
- US rank
- #3098
Category grades
Schools grade is shown separately in the Schools card above.
Census & demographics
- Census place
- Cape Coral, FL
- County
- Charlotte County · 196,994 people
- City population
- 217,388
- Metro
- Punta Gorda, FL
- Population (ZIP)
- 12,399
- Household income
- $76,943
- Rent vs Own
- Severe rent burden
- 226.0
Population outlook (Lee County) Hauer SSP2
- Today (2025)
- 871,946 people
- By 2030
- 955,468 · +9.6%
- By 2040
- 1,113,587 · +27.7%
- By 2050
- 1,256,891 · +44.1%
- By 2075
- 1,560,270 · +78.9%
- By 2100
- 1,726,848 · +98.0%
Race, ethnicity, and origin ACS 2023
- Neighborhood character
- Predominantly White (84%)
- Race & ethnicity
- White 84% Hispanic / Latino 10% Two or more races 9% Black 2%
- Hispanic origin (detail)
- Mexican 4% Puerto Rican 2% Cuban 4%
- Common ancestry
- Romanian 5% Italian 3% Serbian 3%
- Foreign-born
- 8% · Canada
- Languages at home
- 91% English-only · Spanish 5% Other Indo-European 1%
Political lean MEDSL · Lee
- 2024 margin
- Strong R (+28.4) · D 35.5% · R 63.9%
- 2008→2024 swing
- -18.0pp toward R · 2008: -10.4pp · 2024: -28.4pp
- All cycles
- 2024: R+28.4 2020: R+19.2 2016: R+20.4 2012: R+16.6 2008: R+10.4
Not yet ingested
- Civics
- —
Market trends
- HPI YoY
- ▼ -78.71%
- Current HPI
- 242.9043
- Rent YoY
- —
- Metro
- Punta Gorda, FL
- State GDP YoY
- ▲ 3.28%
- F500 in state
- 36
Industry mix (Fortune 500 HQ in FL)
| Industry | F500 HQs | Revenue |
|---|---|---|
| Industrial Technology | 2 | $29B |
|
||
| Insurance | 2 | $17B |
|
||
| Retail | 1 | $60B |
|
||
| Technology Distribution | 1 | $58B |
|
||
| Homebuilding | 1 | $35B |
|
||
| Technology Manufacturing | 1 | $35B |
|
||
Price history
+39.7% since first listed4 events — show timeline
- 2026-05-20 Listed $234,900 Stellar MLS as Distributed by MLS Grid
- 2015-06-30 Sold (Public Records) $150,000 Public Records
- 2003-07-28 Sold (Public Records) $175,000 Public Records
- 1999-07-14 Sold (Public Records) $168,100 Public Records
Property tax history
+4.1%/yrLatest (2025): $4,830 · +5.2% YoY. Source: county tax records.
Cash-flow waterfall
monthlySold comps — $/sqft
last 12 mo · ≤1 miLoading sold comps…