 🏗️ New Construction
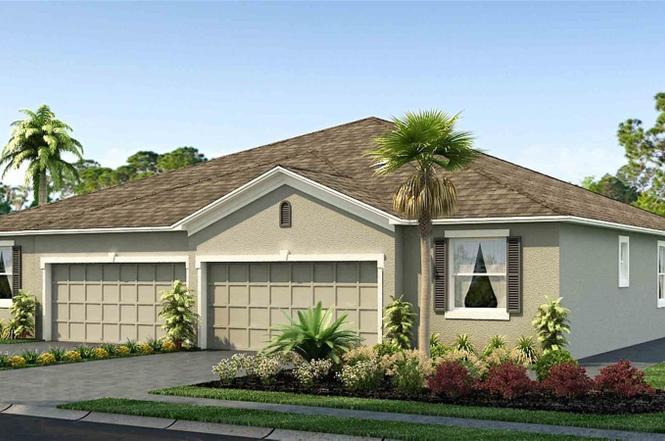
32796 Rustic Rise Rd · Pasadena Hills, FL
Flood risk No data
- FEMA flood zone
- —
- Chance of flooding over 30 yrs
- —
- Est. flood insurance / yr
- —
Fire risk No data
- Est. fire insurance / yr
- —
Heat risk No data
- Hot days now (above threshold)
- —
- Hot days in 30 yrs
- —
Wind risk No data
- Chance of severe wind over 30 yrs
- —
Air-quality risk No data
- Unhealthy air days now
- —
- Unhealthy air days in 30 yrs
- —
Risk factors via First Street. Map © Google.
Why this score? — see what drove the D grade
The composite is a weighted blend of 9 inputs, each scored 0–100. Each bar is that input's sub-score; the figure is the points it added to the 100-point composite (weight × sub-score).
- Cash flow +12.5/30.0
- ARV discount +7.5/15.0
- Schools +4.3/10.0
- Appreciation +3.8/10.0
- DSCR +3.7/10.0
- Livability +3.2/5.0
- 1% rule +2.9/10.0
- Rent growth +2.6/5.0
- Condition / age +2.5/5.0
$299,990
🖨 Deal sheet 📄 Offer letter ✓ Due diligence
Listing remarks
Under Construction. The builder is offering buyers up to $25,000 towards closing costs with the use of a preferred lender and title company. Mirada showcases new homes in San Antonio, FL, and is home to a 15-acre MetroLagoon, the largest in the country. The community is conveniently located off State Road 52 and just 5 minutes from 1-75. The Market at Mirada is within the community, where you'll find a Publix grocery store, shops, and restaurants. For local entertainment, you'll find The Grove, Wiregrass Mall, and Tampa Premium Outlets, along with many other dining options all within a short drive. Charming, Historic Downtown Dade City isn't far and offers quaint shopping and dining options
Key facts
- Dog parks
- Golf cart paths
- Tot lots
Tags
Neighborhood map
What this means for you Summary
Snapshot
- This is a 3-bed/2.0-bath land listed at $300k.
Deal economics
- At list price, monthly cash flow is $-45 ($-539/yr) — negative.
- To cash-flow at today's rent, offer at most $292k (2.6% below list).
- To meet the 1% rule (rent ≥ 1% of price), the offer needs to be $236k (21.5% below list).
- Recommended offer: $236k (21.5% below list) — sets the bar for 1% rule.
- Cap rate 6.1% vs local median 3.7% in Pasadena Hills — top-decile yield for the area; either an underpriced asset or a hidden risk that comps aren't pricing in. Stress-test before assuming the spread holds.
Location & tenants
- Location reads 63/100 on livability (#723 in FL) — a middle-class / working-renter tenant base. Strengths: housing A+, crime A-, cost of living A-; Watch: amenities F, commute F, health & safety D-.
- Pasco (suburban): math 50% / reading 52% proficiency, ranked #32 of 73 in FL (top 44%) — acceptable for families but not a draw, mixed tenant base, ~2y average lease.
- Zoned schools: Pasco High School (math 40% / reading 40%, grade F, #296 of 667 statewide, top 45%, 1,639 students, 66% FRL) — zoned schools average 66% FRL vs 48% district-wide (17 pts higher); higher-poverty schools than district average — tighter screening recommended.
- Market conditions: Rents flat; 364 active listings in the ZIP; 40 comparable units currently listed for rent nearby; rentals at typical pace (median 25d on market — plan ~3-4 weeks tenant-placement turnaround); solid renter incomes; 6,765 units permitted in Pasco County in 2024 (1,250 in 5+ unit buildings).
- This rent runs 37% of the median local income ($76k/yr) — at the standard rent-burdened threshold; future hikes will face affordability resistance.
Forward outlook
- Local home prices are declining (-2.3%/yr); year-one equity from $2k of loan paydown is wiped out by about $7k of value loss. Plan a longer hold.
- Pasco County population projected at +29% by 2050 — long-run rental-demand tailwind backs the buy-and-hold thesis.
Negotiation context
- It's been on market 56 days — a 3% lower offer ($291k) is reasonable based on typical stale-listing flexibility.
Questions for the listing agent
- What do current leases actually rent for vs. the listed asking? Can we see a recent rent roll and the last 12 months of T-12 income?
- It's been on market 56 days. Have you received any prior offers? Is the seller open to a 21% concession, seller financing, or rate buy-down credit?
- What does the HOA fee cover, when was the last increase, and are there any pending special assessments or reserve-fund shortfalls?
- Is there a deadline driving the sale (1031 exchange, divorce, estate, relocation)? That informs how much negotiation room exists.
- Schools are F-rated, which usually means shorter tenancies and higher turnover. Who's the typical renter profile here, and what's been the actual vacancy rate?
- The area grade is low — what's the realistic commute time and amenity access for the typical tenant pool here? Any planned neighborhood developments (good or bad) we should know about?
- What's the average days-on-market for RENTAL listings here right now (not sales)? A rising rental-DOM trend means longer vacancies and softer asking-rent achievability than the comps imply.
- What's the recent tenant-quality profile in this submarket — average credit score on applications, eviction rate, late-payment / NSF rate, and stable-employment percentage? A property-management company in the area should have these aggregated.
- How much new for-sale + rental construction is in the pipeline within 1–3 miles? Heavy new supply typically softens prices + rents 12–24 months out; constrained supply supports both.
Investment metrics
- 1% rule
- 0.79% ✗
- Cap rate
- 6.11%
- Cash-on-cash
- -0.64%
- DSCR
- 0.97
- GRM
- 10.6
CMA / ARV
No comps found within radius.
Projected returns pro-forma
-2.32% appreciation · 0.37% rent growth · sell at horizon
- IRR
- -15.7%
- Equity multiple
- 0.42×
- Total profit
- $-48,991
- Equity at exit
- $53,906
- IRR
- -11.9%
- Equity multiple
- 0.25×
- Total profit
- $-62,706
- Equity at exit
- $41,978
Cash invested: $83,997 (down + closing). Projections, not guarantees.
Landlord ↔ Tenant lean methodology
- Overall (STATE)
- 87 Strongly Landlord-Friendly
- State Florida
- 87 Strongly Landlord-Friendly · R+3
- County
- — inherits STATE
- City
- — inherits STATE
ZIP-level market 33576
- Home prices YoY
- -0.8%
- Rents YoY
- 0.4%
- Active inventory
- 364
- Price-to-rent
- 10.6×
Monthly cashflow live
- Estimated rent
- $2,356 high interval (Pro) →
- Mortgage (P&I)
- −$1,573
- Tax from tax record
- −$75 /mo · $904/yr
- Insurance
- −$125
- HOA
- −$133
- Vacancy / Maint / Mgmt
- −$495
- Net cashflow
- $-45
Break-even live
UW: 25.0% down · 7.5% · 30yr · 1.5% tax · 5.0% vac · 8.0% maint · 8.0% mgmt
Financing live
Cash to close
- Down payment
- $74,998
- Closing costs
- $9,000
- Reserves months
- —
- Total cash needed
- —
Loan-product check · same deal, 3 products live
Conventional
25% down · 7.5% · 30yr
- Down + closing
- —
- Monthly P&I
- —
- Monthly cashflow
- —
- DSCR
- —
- Eligible?
- —
Personal DTI + credit; lowest rate.
DSCR
20% down · 8.5% · 30yr
- Down + closing
- —
- Monthly P&I
- —
- Monthly cashflow
- —
- DSCR
- —
- Eligible?
- —
No personal income docs; deal must DSCR.
Hard money
10% down · 12.0% · 12mo
- Down + closing
- —
- Monthly P&I
- —
- Monthly cashflow
- —
- DSCR
- —
- Eligible?
- —
Short-term bridge; refi at stabilization.
Rent comps 40 comps
| Address | Beds | Baths | Sqft | Rent | $/sqft | DOM | Units | Dist |
|---|---|---|---|---|---|---|---|---|
| 32650 Osprey Peak Way San Antonio, FL | 4.0 | 2.0 | 1846 | $2,600 | $1.41 | 12d | 1 | 0.10mi |
| 32783 Osprey Peak Way San Antonio, FL | 4.0 | 2.0 | 1846 | $2,200 | $1.19 | 24d | 1 | 0.18mi |
| 32909 Osprey Peak Way San Antonio, FL | 3.0 | 2.0 | 1560 | $2,350 | $1.51 | 24d | 1 | 0.27mi |
| 10959 Cotton Vale Pl San Antonio, FL | 3.0 | 2.0 | 1844 | $2,100 | $1.14 | 3d | 1 | 0.28mi |
| 10959 Cotton Vale Pl San Antonio, FL | 3.0 | 2.0 | 1844 | $2,100 | $1.14 | 20d | 1 | 0.28mi |
| 10888 Quail Grove Way San Antonio, FL | 3.0 | 2.0 | 1690 | $2,400 | $1.42 | 24d | 1 | 0.29mi |
| 11545 Radiant Shore Loop San Antonio, FL | 3.0 | 2.0 | 1451 | $2,250 | $1.55 | 24d | 1 | 0.54mi |
| 11210 Linden Depot Rd San Antonio, FL | 4.0 | 2.0 | 1936 | $2,550 | $1.32 | 5d | 1 | 0.59mi |
| 11672 Radiant Shore Loop San Antonio, FL | 4.0 | 2.5 | 1870 | $2,495 | $1.33 | 15d | 1 | 0.66mi |
| 32094 Hawthorne Cottage Pl San Antonio, FL | 4.0 | 2.0 | 1936 | $2,795 | $1.44 | 24d | 1 | 0.69mi |
| 32118 Pond Apple Bnd San Antonio, FL | 3.0 | 2.5 | 1732 | $2,400 | $1.39 | 24d | 1 | 0.75mi |
| 32112 Pond Apple Bnd Unit 1 San Antonio, FL | 3.0 | 2.5 | 1700 | $2,000 | $1.18 | 24d | 1 | 0.75mi |
| 32067 Eastern Redbud Br San Antonio, FL | 3.0 | 2.5 | 1639 | $2,250 | $1.37 | 24d | 1 | 0.76mi |
| 10708 Ironwood Tree Way San Antonio, FL | 3.0 | 2.5 | 1600 | $2,100 | $1.31 | 18d | 1 | 0.80mi |
| 10817 Ironwood Tree Way San Antonio, FL | 3.0 | 2.5 | 1694 | $2,250 | $1.33 | 2d | 1 | 0.82mi |
| 10817 Ironwood Tree Way San Antonio, FL | 3.0 | 2.5 | 1694 | $2,250 | $1.33 | 24d | 1 | 0.82mi |
| 10715 Ironwood Tree Way San Antonio, FL | 3.0 | 2.5 | 1681 | $2,050 | $1.22 | 15d | 1 | 0.83mi |
| 10647 Ironwood Tree Way San Antonio, FL | 3.0 | 2.5 | 1712 | $2,400 | $1.40 | 24d | 1 | 0.85mi |
| 32201 Powderpuff Mimosa Dr San Antonio, FL | 3.0 | 3.0 | 1634 | $2,050 | $1.25 | 24d | 1 | 0.95mi |
| 32127 Powderpuff Mimosa Dr San Antonio, FL | 3.0 | 2.5 | 1634 | $2,100 | $1.29 | 24d | 1 | 0.97mi |
| 10375 Trumpet Honeysuckle Way San Antonio, FL | 3.0 | 2.5 | 1666 | $2,000 | $1.20 | 18d | 1 | 0.97mi |
| 32077 Powderpuff Mimosa Dr San Antonio, FL | 2.0 | 2.5 | 1541 | $2,100 | $1.36 | 24d | 1 | 0.97mi |
| 10334 Trumpet Honeysuckle Way San Antonio, FL | 3.0 | 3.0 | 1634 | $2,000 | $1.22 | 24d | 1 | 0.99mi |
| 32146 Powderpuff Mimosa Dr San Antonio, FL | 3.0 | 2.5 | 1801 | $2,050 | $1.14 | 20d | 1 | 1.00mi |
| 10321 Trumpet Honeysuckle Way San Antonio, FL | 3.0 | 2.5 | 1666 | $2,000 | $1.20 | 22d | 1 | 1.01mi |
| 10443 Lavender Aster Trl San Antonio, FL | 3.0 | 2.5 | 1666 | $1,950 | $1.17 | 24d | 1 | 1.03mi |
| 10250 Honey Hammock Way San Antonio, FL | 3.0 | 2.5 | 1676 | $1,979 | $1.18 | 24d | 1 | 1.08mi |
| 31825 Kestrel Calling Dr San Antonio, FL | 3.0 | 2.5 | 1602 | $2,300 | $1.44 | 24d | 1 | 1.08mi |
| 10583 Tupper Cay Dr San Antonio, FL | 3.0 | 2.0 | 1770 | $2,950 | $1.67 | 4d | 1 | 1.10mi |
| 11608 Ascend Mirada Blvd San Antonio, FL | 1.0–3.0 | 1.0–2.0 | 1178 | $2,550 | $2.16 | 2d | 21 | 1.12mi |
| 10171 Trumpet Honeysuckle Way San Antonio, FL | 3.0 | 2.5 | 1634 | $1,900 | $1.16 | 24d | 1 | 1.14mi |
| 10019 Curley Rd San Antonio, FL | 4.0 | 2.0 | 1304 | $1,900 | $1.46 | 24d | 1 | 1.19mi |
| 10114 Honey Hammock Way San Antonio, FL | 3.0 | 2.5 | 1634 | $1,895 | $1.16 | 20d | 1 | 1.19mi |
| 10110 Honey Hammock Way San Antonio, FL | 2.0 | 2.5 | 1513 | $1,995 | $1.32 | 24d | 1 | 1.20mi |
| 10121 Honey Hammock Way San Antonio, FL | 3.0 | 2.5 | 1666 | $2,100 | $1.26 | 24d | 1 | 1.20mi |
| 32009 Spiceberry St San Antonio, FL | 2.0 | 2.5 | 1513 | $1,900 | $1.26 | 18d | 1 | 1.25mi |
| 32067 Spiceberry St San Antonio, FL | 3.0 | 2.5 | 1634 | $2,000 | $1.22 | 5d | 1 | 1.25mi |
| 32010 Spiceberry St Wesley Chapel, FL | 3.0 | 2.5 | 1634 | $2,100 | $1.29 | 13d | 1 | 1.27mi |
| 11126 Tidepool Ct Unit Na San Antonio, FL | 3.0 | 2.5 | 1788 | $3,200 | $1.79 | 20d | 1 | 1.28mi |
| 11126 Tidepool Ct San Antonio, FL | 3.0 | 2.5 | 1788 | $3,200 | $1.79 | 22d | 1 | 1.28mi |
HOA detail
- Monthly dues
- $133 · $1,596/yr
Listing history 7 events
-
2026-05-21soldstatus $299,990 Closed
-
2026-03-29status Pending
-
2026-03-18price $299,990
-
2026-03-11price $304,990
-
2026-02-19price $309,990
-
2026-02-01$311,990 Active
-
2026-01-16soldstatus $815,100
ⓘ Source: listings_history table (triggers on properties + properties_extension) + one-shot
backfill from property_details.listing_events for pre-trigger history.
Tax reassessment forecast FL · Resets to sale price
- Current annual tax
- $904 · $75/mo
- Projected year-2 tax
- $2,490 · $207/mo
- Expected delta
- +$1,586/yr (+$132/mo · 175.4%)
ⓘ Screening estimate from a state-policy table — verify with the county assessor before closing.
Nearby sold comps map
Loading sold comps map…
Walkable amenities ~0.75 mi
Loading nearby amenities…
Taxation est. · year 1
- Rental income
- $28,277
- − Mortgage interest
- −$16,804
- − Property taxes
- −$904
- − Insurance
- −$1,500
- − Repairs & maintenance
- −$2,262
- − Management
- −$2,262
- − HOA
- −$1,596
- − Depreciation
- −$8,727
- Taxable loss
- −$5,778
- Est. tax savings @ 24.0%
- +$1,387
- After-tax cash flow
- $847/yr
For passive investors: Depreciation is non-cash, so a rental often shows a tax loss while cash-flowing — sheltering income. Rental losses are passive: they offset passive income freely, and up to $25,000/yr can offset ordinary (W-2) income if you actively participate and your MAGI is under $100k (phasing out to $0 by $150k); unused losses carry forward. On sale, claimed depreciation is recaptured at up to 25%, and gains may owe capital-gains tax (a 1031 exchange can defer both). Figures are a year-1 estimate at your 24.0% rate — not tax advice; consult a CPA.
Schools (NCES district)
- District
- Pasco
- NCES district ID
- 1201530
- Math proficiency
- 50% ▼ -10.00%
- Reading proficiency
- 52% ▼ -5.00%
- Median HH income
- $45,039
- Composite
- 43.14/100
- National rank
- #3074
- State rank
- #32 of 73 in FL
Livability — Pasadena Hills
- Score
- 63/100
- State rank
- #723
- US rank
- #15499
Category grades
Schools grade is shown separately in the Schools card above.
Census & demographics
- County
- Pasco County · 524,098 people
- Metro
- Tampa-St. Petersburg-Clearwater, FL
- Population (ZIP)
- 6,273
- Household income
- $76,388
- Rent vs Own
- Severe rent burden
- 31.0
Population outlook (Pasco County) Hauer SSP2
- Today (2025)
- 570,045 people
- By 2030
- 605,844 · +6.3%
- By 2040
- 674,806 · +18.4%
- By 2050
- 736,022 · +29.1%
- By 2075
- 862,900 · +51.4%
- By 2100
- 906,364 · +59.0%
Race, ethnicity, and origin ACS 2023
- Neighborhood character
- Predominantly White (81%)
- Race & ethnicity
- White 81% Hispanic / Latino 12% Two or more races 5% Black 5%
- Hispanic origin (detail)
- Mexican 3% Puerto Rican 5%
- Common ancestry
- Romanian 5% Lithuanian 3% Slovak 2%
- Foreign-born
- 7% · Canada
- Languages at home
- 91% English-only · Spanish 6% Other Indo-European 1%
Political lean MEDSL · Pasco
- 2024 margin
- Strong R (+25.2) · D 36.9% · R 62.1% · Other 1.0%
- 2008→2024 swing
- -21.6pp toward R · 2008: -3.6pp · 2024: -25.2pp
- All cycles
- 2024: R+25.2 2020: R+20.1 2016: R+21.6 2012: R+6.7 2008: R+3.6
Not yet ingested
- Civics
- —
Market trends
- HPI YoY
- ▼ -2.32%
- Current HPI
- 281.7138
- Rent YoY
- ▲ 0.37%
- Metro
- Tampa-St. Petersburg-Clearwater, FL
- State GDP YoY
- ▲ 3.28%
- F500 in state
- 36
Industry mix (Fortune 500 HQ in FL)
| Industry | F500 HQs | Revenue |
|---|---|---|
| Industrial Technology | 2 | $29B |
|
||
| Insurance | 2 | $17B |
|
||
| Retail | 1 | $60B |
|
||
| Technology Distribution | 1 | $58B |
|
||
| Homebuilding | 1 | $35B |
|
||
| Technology Manufacturing | 1 | $35B |
|
||
Price history
-63.2% since first listed7 events — show timeline
- 2026-05-21 Sold (MLS) $299,990 Stellar MLS as Distributed by MLS Grid
- 2026-03-29 Pending — Stellar MLS as Distributed by MLS Grid
- 2026-03-18 Price Changed $299,990 Stellar MLS as Distributed by MLS Grid
- 2026-03-11 Price Changed $304,990 Stellar MLS as Distributed by MLS Grid
- 2026-02-19 Price Changed $309,990 Stellar MLS as Distributed by MLS Grid
- 2026-02-01 Listed $311,990 Stellar MLS as Distributed by MLS Grid
- 2026-01-16 Sold (Public Records) $815,100 Public Records
Property tax history
+9.2%/yrLatest (2025): $904 · +9.2% YoY. Source: county tax records.
Cash-flow waterfall
monthlySold comps — $/sqft
last 12 mo · ≤1 miLoading sold comps…