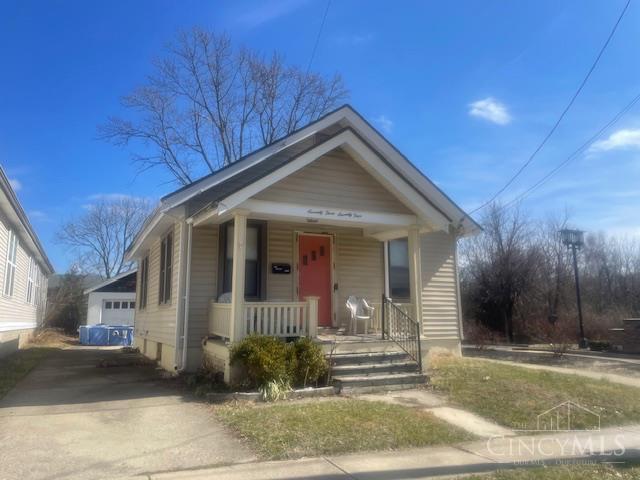
7274 Elizabeth St · Mount Healthy, OH
Flood risk 1/10 · Minimal
- FEMA flood zone
- X (unshaded)
- Chance of flooding over 30 yrs
- 0.0%
- Est. flood insurance / yr
- $473 – $860
Fire risk 1/10 · Minimal
- Est. fire insurance / yr
- $713 – $1,323
Heat risk 4/10 · Minor
- Hot days now (above 103°F)
- 7 days/yr
- Hot days in 30 yrs
- 19 days/yr
Wind risk 2/10 · Minimal
- Chance of severe wind over 30 yrs
- 1.0%
Air-quality risk 3/10 · Minor
- Unhealthy air days now
- 2 days/yr
- Unhealthy air days in 30 yrs
- 3 days/yr
Risk factors via First Street. Map © Google.
Why this score? — see what drove the B- grade
The composite is a weighted blend of 9 inputs, each scored 0–100. Each bar is that input's sub-score; the figure is the points it added to the 100-point composite (weight × sub-score).
- Cash flow +25.7/30.0
- ARV discount +15.0/15.0
- DSCR +8.6/10.0
- 1% rule +6.8/10.0
- Rent growth +4.2/5.0
- Livability +3.9/5.0
- Condition / age +2.5/5.0
- Schools +1.6/10.0
- Appreciation +0.0/10.0
$135,643
🖨 Deal sheet 📄 Offer letter ✓ Due diligence
Listing remarks
Government-owned, investor opportunity. Cash or hard money strongly preferred. Property sold strictly as-is, where-is; Seller will make no repairs. All offers due by 5/25/26 at 5pm. Seller will review highest & best after deadline. No escalation clauses. Seller reserves the right to accept an offer at any time. Only agent accompanied showings allowed. See attached addenda. Prominent Title is the preferred title agent.
Key facts
- 3,136 sq ft lot
- Garage
- Built 1924
Property features AI
Finance
- Other: Lease not considered
- HOA & community: No HOA
Exterior
- Parking: Detached garage with 1 garage space
- Utilities: Public water; Public sewer; Natural gas
- Home design: Cape Cod style; Single-family home; One and one half stories
- Construction: Block foundation
- Exterior features: Shingle roof; Wood siding; Windows: Other
Interior
- Kitchen: Kitchen (11 x 10)
- Bedrooms: Two bedrooms total; Primary bedroom on level 1 (14 x 13); Second bedroom on level 2 (18 x 12)
- Bathrooms: One full bathroom on level 1; Primary bathroom includes tub and shower
- Heating & cooling: Forced air heating (natural gas); Gas water heater; Central air conditioning
- Interior features: Five total rooms; Full basement
Neighborhood map
What this means for you Summary
Snapshot
- This is a 2-bed/1.0-bath single-family listed at $136k.
Deal economics
- At list price, monthly cash flow is $327 ($4k/yr) — positive.
- The deal already cash-flows at list — no discount required.
- Meets the 1% rule at list price ($2k rent vs $136k).
- Recommended offer: $128k (6.0% below list) — sets the bar for market timing.
- Cap rate 9.2% vs local median 6.4% in Mount Healthy — top-decile yield for the area; either an underpriced asset or a hidden risk that comps aren't pricing in. Stress-test before assuming the spread holds.
Location & tenants
- Location reads 77/100 on livability (#189 in OH, #2,906 nationally) — a middle-class / working-renter tenant base. Strengths: commute A+, cost of living A+, housing A+; Watch: crime F, amenities F, employment D-.
- Mt Healthy City (suburban): math 12% / reading 24% proficiency, ranked #636 of 656 in OH (top 97%) — low school quality limits family demand, transient renter base, plan for 1-2y turnover; 75% free/reduced lunch — lower-income household profile, screen leases tightly.
- Market conditions: Rents rising fast (+6.9%/yr); 85 active listings in the ZIP; 9 comparable units currently listed for rent nearby; rentals at typical pace (median 22d on market — plan ~3-4 weeks tenant-placement turnaround); 801 units permitted in Hamilton County in 2024 (190 in 5+ unit buildings).
Forward outlook
- Local home prices are declining (-3.0%/yr); year-one equity from $938 of loan paydown is wiped out by about $4k of value loss. Plan a longer hold.
- At projected returns (-3.0% appreciation + 6.9% rent growth), your $38k cash investment doubles in ~8 years — after that, you're playing with house money.
Negotiation context
- It's been on market 72 days — a 6% lower offer ($128k) is reasonable based on typical stale-listing flexibility.
- 4 sale attempts; this cycle's ask is 6% above the opening price — seller raised mid-cycle; expect resistance to lowballs.
Risks & watch-outs
- Watch-outs: built in 1924 — expect roof / HVAC / electrical / plumbing capex.
Questions for the listing agent
- It's been on market 72 days. Have you received any prior offers? Is the seller open to a 6% concession, seller financing, or rate buy-down credit?
- Built in 1924 — when were the roof, HVAC, electrical panel, plumbing, and water heater last replaced?
- Why hasn't it sold? Are there any deal-killer items the seller is aware of (foundation, flood, title, zoning, code violations)?
- Is there a deadline driving the sale (1031 exchange, divorce, estate, relocation)? That informs how much negotiation room exists.
- Crime grade is F in this area — have there been break-ins, vandalism, or insurance claims at this property in the last 3 years? What carrier currently insures it and at what premium?
- What's the average days-on-market for RENTAL listings here right now (not sales)? A rising rental-DOM trend means longer vacancies and softer asking-rent achievability than the comps imply.
- What's the recent tenant-quality profile in this submarket — average credit score on applications, eviction rate, late-payment / NSF rate, and stable-employment percentage? A property-management company in the area should have these aggregated.
- How much new for-sale + rental construction is in the pipeline within 1–3 miles? Heavy new supply typically softens prices + rents 12–24 months out; constrained supply supports both.
Investment metrics
- 1% rule
- 1.18% ✓
- Cap rate
- 9.18%
- Cash-on-cash
- 10.32%
- DSCR
- 1.46
- GRM
- 7.1
CMA / ARV
- ARV (on-the-fly)
- $217,710
- Comps found
- 12
Show comp detail 12 sales within ~0.75 mi
| Address | Dist | Beds/Ba | Sqft | Sold | Price | $/sf | Match |
|---|---|---|---|---|---|---|---|
| 7404 Joseph St | 0.22mi | 3/1.5 (+1) | 1,720 (-7%) | 2mo | $197,600 | $115 | 70 |
| 7428 Werner Ave | 0.54mi | 2/1.0 | 1,773 (-4%) | 6mo | $135,000 | $76 | 64 |
| 1501 Madison Ave | 0.10mi | 3/2.0 (+1) | 1,661 (-10%) | 11mo | $210,000 | $126 | 60 |
| 7400 Hickman St | 0.24mi | 3/1.0 (+1) | 1,645 (-11%) | 9mo | $149,500 | $91 | 59 |
| 1284 Compton Rd | 0.62mi | 3/1.0 (+1) | 1,762 (-4%) | 0mo | $178,000 | $101 | 58 |
| 1378 Adams Rd | 0.74mi | 3/1.0 (+1) | 1,881 (+2%) | 0mo | $222,000 | $118 | 57 |
| 1464 Clovernoll Dr | 0.45mi | 3/1.0 (+1) | 1,706 (-8%) | 8mo | $178,000 | $104 | 55 |
| 7374 Huntridge Ave | 0.23mi | 3/3.0 (+1) | 1,985 (+8%) | 11mo | $241,500 | $122 | 55 |
| 1722 Stevens Ave | 0.46mi | 3/1.0 (+1) | 1,641 (-11%) | 4mo | $103,000 | $63 | 52 |
| 8881 Ebro Ct | 0.51mi | 3/1.0 (+1) | 1,620 (-12%) | 2mo | $204,000 | $126 | 50 |
| 1914 Madison Ave | 0.58mi | 3/2.0 (+1) | 1,666 (-10%) | 0mo | $270,000 | $162 | 48 |
| 1720 Hill Ave | 0.65mi | 3/1.5 (+1) | 1,590 (-14%) | 10mo | $235,000 | $148 | 32 |
Match score weights: distance 35% · size 25% · config 20% · recency 20%. Top-matched comps best support the ARV.
Projected returns pro-forma
-3.0% appreciation · 6.92% rent growth · sell at horizon
- IRR
- 3.5%
- Equity multiple
- 1.14×
- Total profit
- $5,417
- Equity at exit
- $20,225
- IRR
- 16.5%
- Equity multiple
- 2.60×
- Total profit
- $60,802
- Equity at exit
- $11,728
Cash invested: $37,980 (down + closing). Projections, not guarantees.
Landlord ↔ Tenant lean methodology
- Overall (STATE)
- 73 Landlord-Friendly
- State Ohio
- 73 Landlord-Friendly · R+6
- County
- — inherits STATE
- City
- — inherits STATE
ZIP-level market 45231
- Rents YoY
- 6.9%
- Active inventory
- 85
- Price-to-rent
- 7.1×
Monthly cashflow live
- Estimated rent
- $1,600 high interval (Pro) →
- Mortgage (P&I)
- −$711
- Tax est. 1.5%
- −$170 /mo · $2,035/yr
- Insurance
- −$57
- HOA
- −$0
- Vacancy / Maint / Mgmt
- −$336
- Net cashflow
- $327
Break-even live
UW: 25.0% down · 7.5% · 30yr · 1.5% tax · 5.0% vac · 8.0% maint · 8.0% mgmt
Financing live
Cash to close
- Down payment
- $33,911
- Closing costs
- $4,069
- Reserves months
- —
- Total cash needed
- —
Loan-product check · same deal, 3 products live
Conventional
25% down · 7.5% · 30yr
- Down + closing
- —
- Monthly P&I
- —
- Monthly cashflow
- —
- DSCR
- —
- Eligible?
- —
Personal DTI + credit; lowest rate.
DSCR
20% down · 8.5% · 30yr
- Down + closing
- —
- Monthly P&I
- —
- Monthly cashflow
- —
- DSCR
- —
- Eligible?
- —
No personal income docs; deal must DSCR.
Hard money
10% down · 12.0% · 12mo
- Down + closing
- —
- Monthly P&I
- —
- Monthly cashflow
- —
- DSCR
- —
- Eligible?
- —
Short-term bridge; refi at stabilization.
Rent comps 9 comps
| Address | Beds | Baths | Sqft | Rent | $/sqft | DOM | Units | Dist |
|---|---|---|---|---|---|---|---|---|
| 1522 Kinney Ave Cincinnati, OH | 3.0 | 1.0 | 1282 | $1,695 | $1.32 | 17d | 1 | 0.31mi |
| 1522 Kinney Ave Cincinnati, OH | 3.0 | 1.0 | 1282 | $1,095 | $0.85 | 23d | 1 | 0.31mi |
| 7601 Hamilton Ave Unit 2-3 Cincinnati, OH | 2.0 | 1.0 | 1250 | $2,000 | $1.60 | 23d | 1 | 0.45mi |
| 1740 Bising Ave North College Hill, OH | 3.0 | 2.0 | 1235 | $1,697 | $1.37 | 1d | 6 | 0.57mi |
| 1604 W Galbraith Rd Unit F North College Hill, OH | 2.0 | 1.0 | 1250 | $1,150 | $0.92 | 14d | 1 | 0.70mi |
| 9029 Daly Rd Unit 8963 Cincinnati, OH | 3.0 | 2.5 | 1315 | $1,771 | $1.35 | 21d | 1 | 0.79mi |
| 1805 Emerson Ave Cincinnati, OH | 3.0 | 1.0 | 1912 | $1,550 | $0.81 | 23d | 1 | 1.22mi |
| 1015 Thunderbird Ave Cincinnati, OH | 3.0 | 1.5 | 1494 | $2,146 | $1.44 | 43d | 1 | 1.23mi |
| 1104 Archland Dr Cincinnati, OH | 3.0 | 2.0 | 1533 | $2,036 | $1.33 | 7d | 1 | 1.38mi |
Listing history 6 events
-
2026-05-18status Active
-
2026-05-18historical Contingency Pending
-
2026-05-07status Active
-
2026-05-07price $135,643
-
2026-03-16Contingency Pending
-
2026-03-16$127,500
ⓘ Source: listings_history table (triggers on properties + properties_extension) + one-shot
backfill from property_details.listing_events for pre-trigger history.
Climate risk First Street
- Flood 1/10 Low FEMA zone X (unshaded) · 0% chance over 30 yrs
- Wildfire 1/10 Low
- Heat 4/10 Moderate 7 d/yr ≥103°F today · 19 d/yr by 30 yrs out
- Wind 2/10 Low 100% chance of damaging wind over 30 yrs
- Air quality 3/10 Moderate 2 unhealthy d/yr today · 3 by 30 yrs out
Nearby sold comps map
Loading sold comps map…
Walkable amenities ~0.75 mi
Loading nearby amenities…
Taxation est. · year 1
- Rental income
- $19,203
- − Mortgage interest
- −$7,598
- − Property taxes
- −$2,035
- − Insurance
- −$678
- − Repairs & maintenance
- −$1,536
- − Management
- −$1,536
- − Depreciation
- −$3,946
- Taxable income
- $1,873
- Est. tax owed @ 24.0%
- −$450
- After-tax cash flow
- $3,472/yr
For passive investors: Depreciation is non-cash, so a rental often shows a tax loss while cash-flowing — sheltering income. Rental losses are passive: they offset passive income freely, and up to $25,000/yr can offset ordinary (W-2) income if you actively participate and your MAGI is under $100k (phasing out to $0 by $150k); unused losses carry forward. On sale, claimed depreciation is recaptured at up to 25%, and gains may owe capital-gains tax (a 1031 exchange can defer both). Figures are a year-1 estimate at your 24.0% rate — not tax advice; consult a CPA.
Schools (NCES district)
- District
- Mt Healthy City
- NCES district ID
- 3904441
- Math proficiency
- 12% ▼ -21.00%
- Reading proficiency
- 24% ▼ -9.00%
- Median HH income
- $42,699
- Composite
- 15.51/100
- National rank
- #9303
- State rank
- #636 of 656 in OH
Livability — Mount Healthy
- Score
- 77/100
- State rank
- #189
- US rank
- #2906
Category grades
Schools grade is shown separately in the Schools card above.
Census & demographics
- Census place
- Mount Healthy, OH
- County
- Hamilton County · 701,295 people
- Metro
- Cincinnati, OH-KY-IN
- Population (ZIP)
- 40,463
- Household income
- $71,353
- Rent vs Own
- Severe rent burden
- 846.0
Population outlook (Hamilton County) Hauer SSP2
- Today (2025)
- 826,054 people
- By 2030
- 830,947 · +0.6%
- By 2040
- 832,319 · +0.8%
- By 2050
- 822,428 · -0.4%
- By 2075
- 788,688 · -4.5%
- By 2100
- 710,674 · -14.0%
Race, ethnicity, and origin ACS 2023
- Neighborhood character
- Diverse neighborhood (Simpson 0.61)
- Race & ethnicity
- White 47% Black 40% Two or more races 8% Hispanic / Latino 3% Asian 2%
- Common ancestry
- Lithuanian 1% Slovak 1% Iranian 1%
- Foreign-born
- 5% · Canada, India
- Languages at home
- 94% English-only · Spanish 2% Other Indo-European 1% French/Haitian/Cajun 1%
Political lean MEDSL · Hamilton
- 2024 margin
- D (+14.9) · D 57.0% · R 42.1%
- 2008→2024 swing
- +7.9pp toward D · 2008: 7.0pp · 2024: 14.9pp
- All cycles
- 2024: D+14.9 2020: D+15.9 2016: D+9.5 2012: D+4.9 2008: D+7.0
Not yet ingested
- Civics
- —
Market trends
- HPI YoY
- ▼ -181.25%
- Current HPI
- 228.2912
- Rent YoY
- ▲ 6.92%
- Metro
- Cincinnati, OH-KY-IN
- State GDP YoY
- ▲ 1.98%
- F500 in state
- 48
Industry mix (Fortune 500 HQ in OH)
| Industry | F500 HQs | Revenue |
|---|---|---|
| Insurance | 3 | $145B |
|
||
| Industrial Machinery | 3 | $49B |
|
||
| Financial Services | 3 | $24B |
|
||
| Consumer Goods | 2 | $93B |
|
||
| Aerospace / Defense | 2 | $47B |
|
||
| Utilities | 2 | $33B |
|
||
Price history
+6.4% since first listed6 events — show timeline
- 2026-05-18 Relisted — Cincy MLS
- 2026-05-18 Contingent — Cincy MLS
- 2026-05-07 Relisted — Cincy MLS
- 2026-05-07 Price Changed $135,643 Cincy MLS
- 2026-03-16 Listed — Cincy MLS
- 2026-03-16 Listed $127,500 Cincy MLS
Cash-flow waterfall
monthlySold comps — $/sqft
last 12 mo · ≤1 miLoading sold comps…