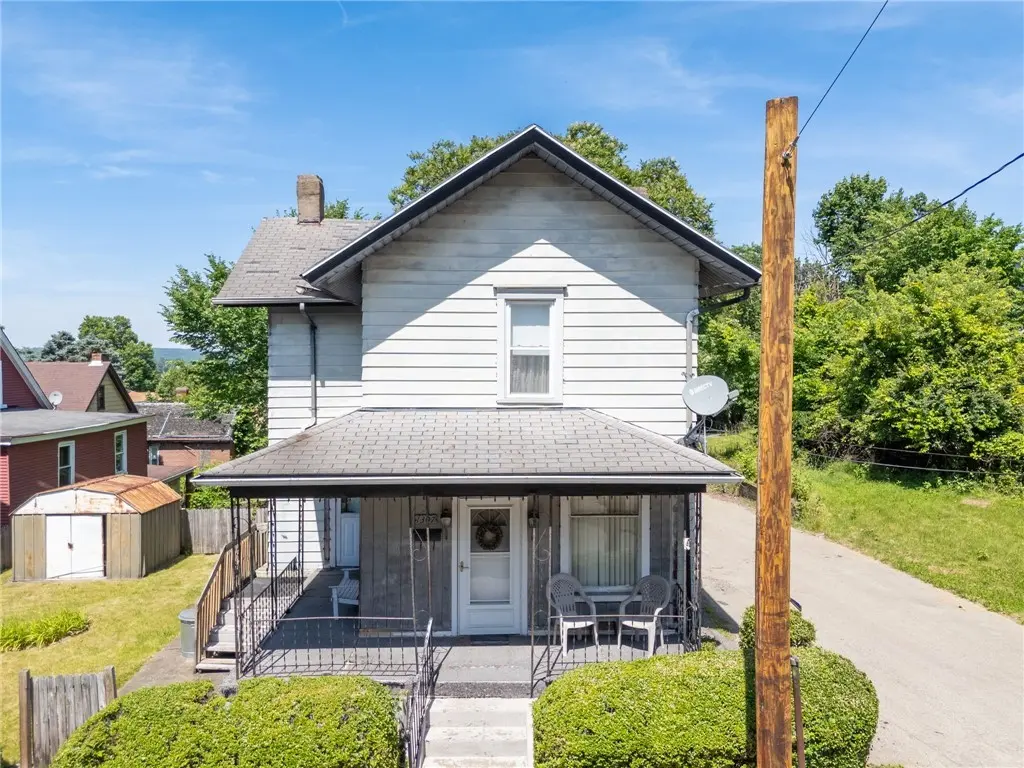
1307 Hays St · Homestead, PA
Flood risk 1/10 · Minimal
- FEMA flood zone
- X (unshaded)
- Chance of flooding over 30 yrs
- 0.0%
- Est. flood insurance / yr
- $473 – $860
Fire risk 1/10 · Minimal
- Est. fire insurance / yr
- $511 – $949
Heat risk 4/10 · Minor
- Hot days now (above 97°F)
- 7 days/yr
- Hot days in 30 yrs
- 17 days/yr
Wind risk 2/10 · Minimal
- Chance of severe wind over 30 yrs
- 0.0%
Air-quality risk 4/10 · Minor
- Unhealthy air days now
- 4 days/yr
- Unhealthy air days in 30 yrs
- 5 days/yr
Risk factors via First Street. Map © Google.
Why this score? — see what drove the B+ grade
The composite is a weighted blend of 9 inputs, each scored 0–100. Each bar is that input's sub-score; the figure is the points it added to the 100-point composite (weight × sub-score).
- Cash flow +30.0/30.0
- ARV discount +15.0/15.0
- 1% rule +10.0/10.0
- DSCR +10.0/10.0
- Livability +3.9/5.0
- Rent growth +3.5/5.0
- Schools +3.1/10.0
- Condition / age +2.5/5.0
- Appreciation +0.0/10.0
$75,000
🖨 Deal sheet 📄 Offer letter ✓ Due diligence
Listing remarks
Loved by the same family for over 50 years, this home has plenty of character and is ready for its next chapter! Enjoy relaxing on the covered front porch, spacious room sizes, and a flat enclosed backyard perfect for pets, gardening, entertaining, or play. A storage shed provides additional space for tools and outdoor equipment. Inside, you'll find a functional layout with plenty of potential to modernize while preserving the home's charm. The full basement offers abundant storage and even includes a classic Pittsburgh potty. Conveniently located just minutes from The Waterfront, shopping, dining, entertainment, major roadways, and downtown Pittsburgh, this home offers a rare combination o
Key facts
- Covered front porch
- Storage shed
- Full basement
Tags
Property features AI
Exterior
- Home design: 2-story property
- Exterior features: Small lot (about 0.05 acres)
Interior
- Kitchen: Microwave; Refrigerator
- Bathrooms: 1 full bathroom
- Interior features: Resale condition
- Laundry & utility: Washer; Dryer
Neighborhood map
What this means for you Summary
Snapshot
- This is a 3-bed/1.0-bath single-family listed at $75k.
Deal economics
- At list price, monthly cash flow is $615 ($7k/yr) — positive.
- The deal already cash-flows at list — no discount required.
- Meets the 1% rule at list price ($1k rent vs $75k).
Location & tenants
- Location reads 77/100 on livability (#366 in PA, #3,204 nationally) — a middle-class / working-renter tenant base. Strengths: amenities A+, commute A+, cost of living A+; Watch: schools F, crime F, employment F.
- Steel Valley SD (suburban): math 29% / reading 45% proficiency, ranked #403 of 539 in PA (top 75%) — families likely to look elsewhere, expect single-tenant / working-renter base with shorter leases.
- Market conditions: Rents rising fast (+4.1%/yr); 92 active listings in the ZIP; 11 comparable units currently listed for rent nearby; rentals at typical pace (median 24d on market — plan ~3-4 weeks tenant-placement turnaround); 2,996 units permitted in Allegheny County in 2024 (1,588 in 5+ unit buildings).
Forward outlook
- Local home prices are declining (-3.0%/yr); year-one equity from $519 of loan paydown is wiped out by about $2k of value loss. Plan a longer hold.
- At projected returns (-3.0% appreciation + 4.1% rent growth), your $21k cash investment doubles in ~4 years — after that, you're playing with house money.
Negotiation context
- Only 3 days on market — expect competitive offers; lowballing is unlikely to land.
Risks & watch-outs
- Watch-outs: built in 1920 — expect roof / HVAC / electrical / plumbing capex.
Questions for the listing agent
- Built in 1920 — when were the roof, HVAC, electrical panel, plumbing, and water heater last replaced?
- Is there a deadline driving the sale (1031 exchange, divorce, estate, relocation)? That informs how much negotiation room exists.
- Schools are F-rated, which usually means shorter tenancies and higher turnover. Who's the typical renter profile here, and what's been the actual vacancy rate?
- Crime grade is F in this area — have there been break-ins, vandalism, or insurance claims at this property in the last 3 years? What carrier currently insures it and at what premium?
- What's the average days-on-market for RENTAL listings here right now (not sales)? A rising rental-DOM trend means longer vacancies and softer asking-rent achievability than the comps imply.
- What's the recent tenant-quality profile in this submarket — average credit score on applications, eviction rate, late-payment / NSF rate, and stable-employment percentage? A property-management company in the area should have these aggregated.
- How much new for-sale + rental construction is in the pipeline within 1–3 miles? Heavy new supply typically softens prices + rents 12–24 months out; constrained supply supports both.
Investment metrics
- 1% rule
- 1.79% ✓
- Cap rate
- 16.13%
- Cash-on-cash
- 35.15%
- DSCR
- 2.56
- GRM
- 4.7
CMA / ARV
- ARV (on-the-fly)
- $140,448
- Comps found
- 12
Show comp detail 12 sales within ~0.75 mi
| Address | Dist | Beds/Ba | Sqft | Sold | Price | $/sf | Match |
|---|---|---|---|---|---|---|---|
| 215 E 15th Ave | 0.25mi | 3/1.0 | 1,122 (+6%) | 8mo | $56,000 | $50 | 71 |
| 1714 Maple St | 0.32mi | 2/2.0 (-1) | 1,024 (-3%) | 4mo | $73,250 | $72 | 68 |
| 1115 Cascade Dr | 0.34mi | 3/2.0 | 981 (-7%) | 2mo | $180,000 | $183 | 67 |
| 208 E 19th Ave | 0.41mi | 2/1.0 (-1) | 1,050 (-1%) | 10mo | $140,007 | $133 | 67 |
| 366 W 13th Ave | 0.14mi | 2/1.0 (-1) | 1,168 (+11%) | 10mo | $70,000 | $60 | 63 |
| 609 E 18th Ave | 0.49mi | 2/1.0 (-1) | 1,156 (+10%) | 1mo | $36,000 | $31 | 56 |
| 1147 Vivjon Dr | 0.45mi | 3/2.0 | 1,000 (-5%) | 12mo | $208,000 | $208 | 56 |
| 203 E 17th Ave | 0.31mi | 2/1.0 (-1) | 900 (-15%) | 4mo | $22,000 | $24 | 53 |
| 700 E 19th Ave | 0.54mi | 2/1.0 (-1) | 1,167 (+10%) | 5mo | $100,000 | $86 | 48 |
| 1328 Overdale Dr | 0.66mi | 3/2.0 | 1,144 (+8%) | 12mo | $170,000 | $149 | 41 |
| 1334 Overdale Dr | 0.67mi | 2/1.0 (-1) | 900 (-15%) | 0mo | $175,000 | $194 | 39 |
| 1312 Cascade Dr | 0.65mi | 2/2.0 (-1) | 900 (-15%) | 5mo | $176,500 | $196 | 31 |
Match score weights: distance 35% · size 25% · config 20% · recency 20%. Top-matched comps best support the ARV.
Projected returns pro-forma
-3.0% appreciation · 4.06% rent growth · sell at horizon
- IRR
- 31.8%
- Equity multiple
- 2.35×
- Total profit
- $28,443
- Equity at exit
- $11,183
- IRR
- 39.4%
- Equity multiple
- 4.87×
- Total profit
- $81,166
- Equity at exit
- $6,485
Cash invested: $21,000 (down + closing). Projections, not guarantees.
Landlord ↔ Tenant lean methodology
- Overall (STATE)
- 62 Landlord-Friendly
- State Pennsylvania
- 62 Landlord-Friendly · EVEN
- County
- — inherits STATE
- City
- — inherits STATE
ZIP-level market 15120
- Home prices YoY
- -16.9%
- Rents YoY
- 4.1%
- Active inventory
- 92
- Price-to-rent
- 4.7×
Monthly cashflow live
- Estimated rent
- $1,340 high interval (Pro) →
- Mortgage (P&I)
- −$393
- Tax from tax record
- −$19 /mo · $229/yr
- Insurance
- −$31
- HOA
- −$0
- Vacancy / Maint / Mgmt
- −$281
- Net cashflow
- $615
Break-even live
UW: 25.0% down · 7.5% · 30yr · 1.5% tax · 5.0% vac · 8.0% maint · 8.0% mgmt
Financing live
Cash to close
- Down payment
- $18,750
- Closing costs
- $2,250
- Reserves months
- —
- Total cash needed
- —
Loan-product check · same deal, 3 products live
Conventional
25% down · 7.5% · 30yr
- Down + closing
- —
- Monthly P&I
- —
- Monthly cashflow
- —
- DSCR
- —
- Eligible?
- —
Personal DTI + credit; lowest rate.
DSCR
20% down · 8.5% · 30yr
- Down + closing
- —
- Monthly P&I
- —
- Monthly cashflow
- —
- DSCR
- —
- Eligible?
- —
No personal income docs; deal must DSCR.
Hard money
10% down · 12.0% · 12mo
- Down + closing
- —
- Monthly P&I
- —
- Monthly cashflow
- —
- DSCR
- —
- Eligible?
- —
Short-term bridge; refi at stabilization.
Rent comps 11 comps
| Address | Beds | Baths | Sqft | Rent | $/sqft | DOM | Units | Dist |
|---|---|---|---|---|---|---|---|---|
| 300 W 13th Ave Unit 302 Homestead, PA | 2.0 | 1.0 | 1088 | $1,150 | $1.06 | 16d | 1 | 0.03mi |
| 300 W 13th Ave Homestead, PA | 2.0 | 1.0 | 1088 | $1,125 | $1.03 | 16d | 1 | 0.04mi |
| 810 Amity St Unit 2 Homestead, PA | 2.0 | 1.0 | 800 | $995 | $1.24 | 12d | 1 | 0.32mi |
| 623 E 18th Ave Homestead, PA | 2.0 | 1.0 | 1156 | $1,600 | $1.38 | 43d | 1 | 0.52mi |
| 1254 Edgewood Dr Homestead, PA | 3.0 | 1.0 | 1144 | $1,725 | $1.51 | 43d | 1 | 0.59mi |
| 621 E 9th Ave Homestead, PA | 2.0 | 2.0 | 1400 | $1,425 | $1.02 | 23d | 1 | 0.62mi |
| 3305 W Run Rd Munhall, PA | 2.0 | 1.0 | 1100 | $1,365 | $1.24 | 23d | 1 | 0.93mi |
| 214 Vine St Homestead, PA | 2.0 | 1.0 | 1034 | $1,150 | $1.11 | 43d | 1 | 0.94mi |
| 931 Hilltop St Homestead, PA | 3.0 | 1.5 | 1312 | $1,500 | $1.14 | 14d | 1 | 0.97mi |
| 308 Lea St Homestead, PA | 4.0 | 2.0 | 1480 | $1,490 | $1.01 | 3d | 1 | 1.04mi |
| 3705 Botsford St Apt 2 Munhall, PA | 3.0 | 1.0 | 1000 | $1,195 | $1.20 | 43d | 1 | 1.26mi |
Listing history 4 events
-
2026-06-16status $75,000 Pending 3 DOM
-
2026-06-15days on market $75,000 Active 3 DOM
-
2026-06-13remarks 699-char remark
-
2026-06-13$75,000 Active 1 DOM
ⓘ Source: listings_history table (triggers on properties + properties_extension) + one-shot
backfill from property_details.listing_events for pre-trigger history.
Tax reassessment forecast PA · Partial reset (capped growth)
- Current annual tax
- $229 · $19/mo
- Projected year-2 tax
- $707 · $59/mo
- Expected delta
- +$478/yr (+$40/mo · 208.7%)
ⓘ Screening estimate from a state-policy table — verify with the county assessor before closing.
Climate risk First Street
- Flood 1/10 Low FEMA zone X (unshaded) · 0% chance over 30 yrs
- Wildfire 1/10 Low
- Heat 4/10 Moderate 7 d/yr ≥97°F today · 17 d/yr by 30 yrs out
- Wind 2/10 Low 0% chance of damaging wind over 30 yrs
- Air quality 4/10 Moderate 4 unhealthy d/yr today · 5 by 30 yrs out
Nearby sold comps map
Loading sold comps map…
Walkable amenities ~0.75 mi
Loading nearby amenities…
Taxation est. · year 1
- Rental income
- $16,082
- − Mortgage interest
- −$4,201
- − Property taxes
- −$229
- − Insurance
- −$375
- − Repairs & maintenance
- −$1,287
- − Management
- −$1,287
- − Depreciation
- −$2,182
- Taxable income
- $6,522
- Est. tax owed @ 24.0%
- −$1,565
- After-tax cash flow
- $5,816/yr
For passive investors: Depreciation is non-cash, so a rental often shows a tax loss while cash-flowing — sheltering income. Rental losses are passive: they offset passive income freely, and up to $25,000/yr can offset ordinary (W-2) income if you actively participate and your MAGI is under $100k (phasing out to $0 by $150k); unused losses carry forward. On sale, claimed depreciation is recaptured at up to 25%, and gains may owe capital-gains tax (a 1031 exchange can defer both). Figures are a year-1 estimate at your 24.0% rate — not tax advice; consult a CPA.
Schools (NCES district)
- District
- Steel Valley SD
- NCES district ID
- 4222790
- Math proficiency
- 29% ▼ -1.00%
- Reading proficiency
- 45% ▼ -4.00%
- Median HH income
- $39,505
- Composite
- 30.94/100
- National rank
- #6111
- State rank
- #403 of 539 in PA
Livability — Homestead
- Score
- 77/100
- State rank
- #366
- US rank
- #3204
Category grades
Schools grade is shown separately in the Schools card above.
Census & demographics
- Census place
- Homestead, PA
- County
- Allegheny County · 1,022,028 people
- Metro
- Pittsburgh, PA
- Population (ZIP)
- 18,029
- Household income
- $55,714
- Rent vs Own
- Severe rent burden
- 669.0
Population outlook (Allegheny County) Hauer SSP2
- Today (2025)
- 1,250,282 people
- By 2030
- 1,256,482 · +0.5%
- By 2040
- 1,256,318 · +0.5%
- By 2050
- 1,244,169 · -0.5%
- By 2075
- 1,197,693 · -4.2%
- By 2100
- 1,093,187 · -12.6%
Race, ethnicity, and origin ACS 2023
- Neighborhood character
- Predominantly White (74%)
- Race & ethnicity
- White 74% Black 20% Two or more races 4% Hispanic / Latino 2%
- Common ancestry
- Romanian 6% Lithuanian 1% Scotch-Irish 1%
- Foreign-born
- 3% · South Korea, Canada
- Languages at home
- 95% English-only · Spanish 3% Russian/Polish/Slavic 1%
Political lean MEDSL · Allegheny
- 2024 margin
- Strong D (+20.3) · D 59.7% · R 39.4%
- 2008→2024 swing
- +4.8pp toward D · 2008: 15.5pp · 2024: 20.3pp
- All cycles
- 2024: D+20.3 2020: D+20.4 2016: D+16.4 2012: D+14.4 2008: D+15.5
Not yet ingested
- Civics
- —
Market trends
- HPI YoY
- ▼ -59.52%
- Current HPI
- 292.5607
- Rent YoY
- ▲ 4.06%
- Metro
- Pittsburgh, PA
- State GDP YoY
- ▲ 1.68%
- F500 in state
- 34
Industry mix (Fortune 500 HQ in PA)
| Industry | F500 HQs | Revenue |
|---|---|---|
| Healthcare | 2 | $309B |
|
||
| Insurance | 2 | $27B |
|
||
| Telecommunications / Media | 1 | $124B |
|
||
| Industrial Distribution | 1 | $22B |
|
||
| Financial Services | 1 | $20B |
|
||
| Chemicals / Materials | 1 | $18B |
|
||
Price history
1 event — show timeline
- 2026-06-12 Listed $75,000 West Penn MLS
Cash-flow waterfall
monthlySold comps — $/sqft
last 12 mo · ≤1 miLoading sold comps…